Introduction
India's Quick Commerce (Q-Commerce) sector has evolved from a niche experiment to a mainstream
channel, rapidly transforming how urban consumers shop for essentials. With services promising
deliveries in 10–20 minutes, the shift is being fueled by rising consumer expectations,
last-mile infrastructure improvements, and smart fulfillment technologies. Platforms like
Blinkit, Zepto, Instamart, and Flipkart Minutes are redefining urban retail by offering
lightning-fast convenience and hyperlocal SKU personalization.
This new model thrives on immediacy, but it also creates complex operational challenges that
demand data-backed decision-making. That’s where Track Q-Commerce Trends with Urban
Retail Data Scraping becomes essential. Retailers, analysts, and investors can now
access granular datasets related to price trends, delivery performance, SKU availability, and
user behavior across cities.
In this research report, we take a practical look at how web scraping and data extraction
solutions can empower decision-makers to gain deep visibility into Q-Commerce ecosystems. We
showcase how platforms can leverage retail data scraping to assess demand forecasting accuracy,
fulfillment gaps, and inventory density across zones. The goal is clear: stay ahead of this
fast-moving trend by turning unstructured digital shelf data into structured, actionable retail
intelligence.
Why Q-Commerce Demands a Data-Driven Approach?

Unlike traditional eCommerce, Q-Commerce thrives on speed, proximity, and precision. Customers
expect 10-minute deliveries of everyday essentials — not optional extras, but must-haves like
bread, milk, soap, or detergent. This level of service can only be sustained by deeply informed
decisions about inventory planning, warehouse zoning, SKU selection, and delivery patterns. In
this high-stakes, low-margin model, even a 5% forecasting error can mean lost revenue or spoiled
goods.
Hence, businesses now rely on Quick Commerce Data Scraping Services in India to access live data
from apps, portals, and platforms. These services allow stakeholders to track price changes,
product rotation, demand surges, and out-of-stock patterns in real time — far more efficiently
than relying on API access or manual analysis. For example, platforms can instantly know which
brands are trending in a given pin code or how discounts vary across cities.
Moreover, retailers can now Extract Quick Commerce Product Data from their competitors, helping
optimize their own assortments, promotions, and delivery strategies. In short, data scraping
enables Q-Commerce participants to identify microtrends before they become macro trends, adjust
operations on the fly, and stay competitive in a space where speed and relevance win.
Q-Commerce Data Use Cases
-
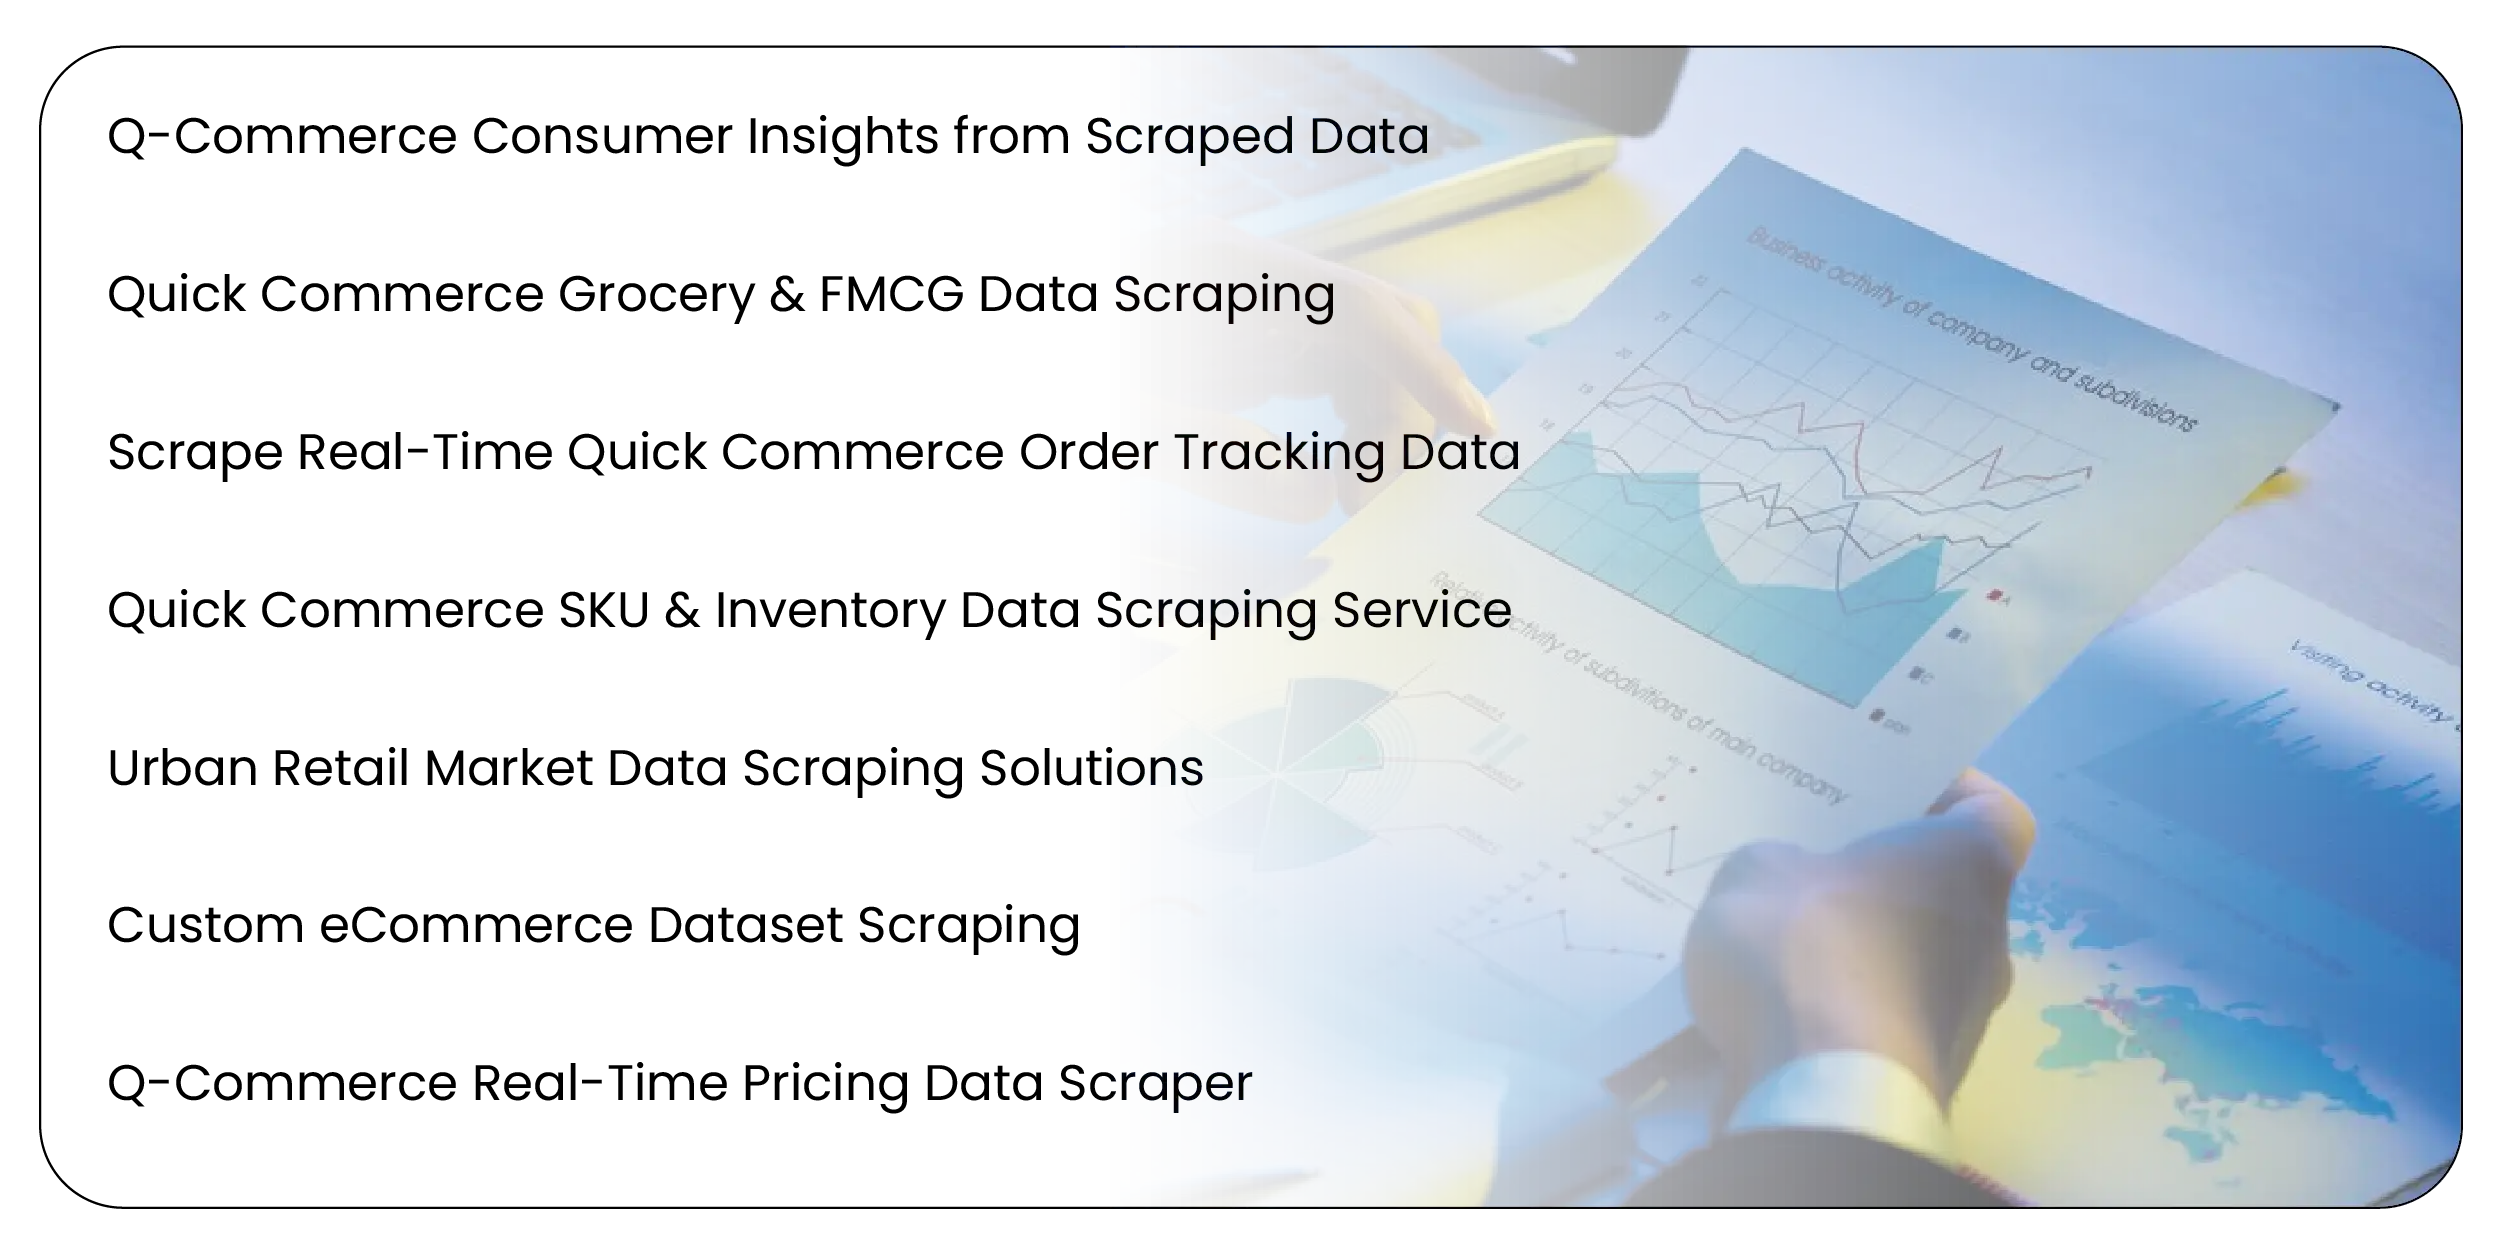
Q-Commerce Consumer Insights from Scraped Data: Retailers and brands can
use web scraping to monitor buying trends across pin codes or neighborhoods. Patterns like
“weekday evening purchases of snacks” or “weekend health food spikes” help tailor marketing
and stocking strategies.
-
Quick Commerce Grocery & FMCG Data Scraping: Grocery is the heart of
Q-Commerce. Scraping helps track pricing volatility, stock availability, and the entry of
new SKUs across FMCG categories like beverages, household care, and personal care.
-
Scrape Real-Time Quick Commerce Order Tracking Data: By monitoring delivery
timestamps and status updates across platforms, businesses can benchmark actual delivery
speed vs promised SLAs — a key factor in user retention.
-
Quick Commerce SKU & Inventory Data Scraping Service: Helps map regional
SKU availability, showing which products are served in which zones, and where potential
stockouts or fulfillment inefficiencies lie.
-
Urban Retail Market Data Scraping Solutions: Use scraped data to analyze
inventory saturation across Tier 1 and Tier 2 cities, identify underserved localities, and
spot supply chain gaps.
-
Custom eCommerce Dataset Scraping: Enterprises can request category- or
brand-specific scraping projects tailored to strategic objectives.
-
Q-Commerce Real-Time Pricing Data Scraper: Automatically detect price
drops, flash deals, and regional price variations — crucial for dynamic pricing strategies.
Data Tables (2020-2025)
Year-on-Year Q-Commerce Market Growth (%)
| Year |
Market Size Growth (%) |
| 2020 |
15% |
| 2021 |
31% |
| 2022 |
50% |
| 2023 |
78% |
| 2024 |
91% |
| 2025 |
105% (est.) |
Analysis: The rapid double-digit growth since 2021 shows how
post-pandemic behaviors have permanently shifted toward Q-Commerce. Urban youth adoption is a
key driver.
Average Delivery Time (in Minutes)
| Year |
Avg. Delivery Time |
| 2020 |
38 |
| 2021 |
32 |
| 2022 |
25 |
| 2023 |
21 |
| 2024 |
17 |
| 2025 |
14 (est.) |
Analysis: Speed continues to define Q-Commerce success.
Delivery SLAs have reduced by over 60% since 2020, enabled by dark stores and micro-warehousing.
Average SKU Count per Platform
| Year |
Avg. SKU Count |
| 2020 |
1,500 |
| 2021 |
2,200 |
| 2022 |
3,600 |
| 2023 |
4,800 |
| 2024 |
6,000 |
| 2025 |
7,200 (est.) |
Analysis: Platforms now aim for higher product diversity per
delivery zone. Quick Commerce SKU & Inventory Data Scraping Service helps brands detect listing
gaps in real time.
Q-Commerce Order Volume (in Millions)
| Year |
Orders (M) |
| 2020 |
120 |
| 2021 |
190 |
| 2022 |
310 |
| 2023 |
520 |
| 2024 |
850 |
| 2025 |
1100 (est.) |
Analysis: With order volume nearly doubling yearly, platforms
depend heavily on Urban Retail Market Data Scraping Solutions to forecast demand across
micro-markets.
FMCG Share in Total Orders (%)
| Year |
FMCG Share |
| 2020 |
55% |
| 2021 |
59% |
| 2022 |
64% |
| 2023 |
68% |
| 2024 |
70% |
| 2025 |
73% (est.) |
Analysis: Quick Commerce Grocery & FMCG Data Scraping shows
that personal care and daily use FMCG products dominate over fresh food in Q-Commerce channels.
Average Order Value (INR)
| Year |
AOV (INR) |
| 2020 |
₹285 |
| 2021 |
₹310 |
| 2022 |
₹325 |
| 2023 |
₹350 |
| 2024 |
₹360 |
| 2025 |
₹375 |
Analysis: Order value is growing gradually, indicating users
are bundling more items. Track Q-Commerce Trends with Urban Retail Data Scraping to understand
bundling patterns.
Repeat Customer Rate (%)
| Year |
Repeat Rate |
| 2020 |
21% |
| 2021 |
32% |
| 2022 |
42% |
| 2023 |
49% |
| 2024 |
54% |
| 2025 |
58% (est.) |
Analysis: High repeat rates prove Q-Commerce is habitual.
Scraped data confirms loyalty is driven by platform speed, SKU match, and delivery experience.
City-wise Share of Orders (%)
| City |
2025 Share (est.) |
| Bangalore |
22% |
| Mumbai |
20% |
| Delhi NCR |
18% |
| Hyderabad |
14% |
| Pune |
11% |
| Others |
15% |
Analysis: Large metros account for 70%+ of order volume.
Brands Track Q-Commerce Trends with Urban Retail Data Scraping to create city-specific
campaigns.
% of Orders Delivered in <20 Minutes
| Year |
% Orders < 20 min |
| 2020 |
8% |
| 2021 |
12% |
| 2022 |
24% |
| 2023 |
38% |
| 2024 |
52% |
| 2025 |
65% (est.) |
Analysis: Majority of 2025 orders will be delivered in under
20 mins. Scrape Real-Time Quick Commerce Order Tracking Data to validate platform performance.
Promotions & Discounts per Order (%)
| Year |
Orders with Discounts (%) |
| 2020 |
45% |
| 2021 |
51% |
| 2022 |
60% |
| 2023 |
57% |
| 2024 |
53% |
| 2025 |
50% (est.) |
Analysis: Discount dependency is stabilizing, showing more
organic usage. Q-Commerce Real-Time Pricing Data Scraper helps track promo vs. retail price
patterns.
Conclusion
Q-Commerce in India is no longer a novelty — it’s a fully-fledged retail
category. Businesses and researchers must Track Q-Commerce Trends with Urban Retail Data
Scraping to stay aligned with evolving delivery models, SKU logistics, and urban consumer
expectations.
Looking to stay ahead? Start using data scraping tools to decode Q-Commerce
today!