Introduction
In today’s hyper-competitive Q-commerce and on-demand delivery markets,
customer experience is the deciding factor for repeat orders and long-term loyalty. Consumers
now expect fast, reliable service, accurate order fulfillment, and immediate resolution of
complaints. However, understanding what actually happens once an order is placed remains a blind
spot for many brands.
This is where Real-Time Review Scraping for Service Quality Analytics plays a
crucial role. By continuously extracting live customer reviews, brands gain immediate visibility
into real performance — from delivery times and packaging quality to app usability and support
responsiveness. It’s no longer enough to look at aggregate ratings once a month; real-time
review streams reveal hidden friction points the moment they emerge.
With Q-Commerce Service Quality Dataset from User Reviews, decision-makers can
benchmark service levels, identify low-performing areas, and respond before negative experiences
damage ratings. Whether you operate a dark store network, a grocery quick commerce app, or a
last-mile delivery fleet, scraping real-time reviews transforms scattered user feedback into
clear, actionable service KPIs.
Why Real-Time Review Scraping Changes the Game?
In the Q-commerce sector, user reviews are the ultimate truth — they surface
unfiltered feedback on delivery delays, missing items, rude riders, and payment glitches.
Traditional surveys capture only a fraction of real sentiment, but review scraping covers 100%
of live data posted on your app stores, Google Play, social feedback channels, or third-party
platforms.
Recent studies show that 78% of Q-commerce users check reviews before trying a
new delivery service, and 42% will switch providers after a single bad experience. By using a
Q-Commerce Review Scraper for Service Metrics, brands instantly pinpoint which stores, routes,
or SKUs cause repeat complaints.
Additionally, when companies Scrape Q-Commerce App Reviews for Service
Analysis, they detect seasonality trends — for instance, spikes in negative reviews during
holidays or weather disruptions. With predictive signals in hand, managers can adjust rider
allocation, inventory levels, and promo strategies to protect their ratings.
Pair this with Q-Commerce App Ratings and Reviews Dataset
and you unlock
powerful benchmarking. Brands compare their service quality to local and global peers, spot
performance gaps, and adjust their operational KPIs weekly — not quarterly.
Turning Reviews into Real-Time Operational Improvements

The power of Real-Time Review Scraping for Service Quality Analytics lies in
converting raw text into clear, quantified metrics. By combining sentiment analysis, NLP, and
tagging, brands transform thousands of user comments into digestible dashboards — highlighting
average delivery satisfaction, top complaints, and location-based pain points.
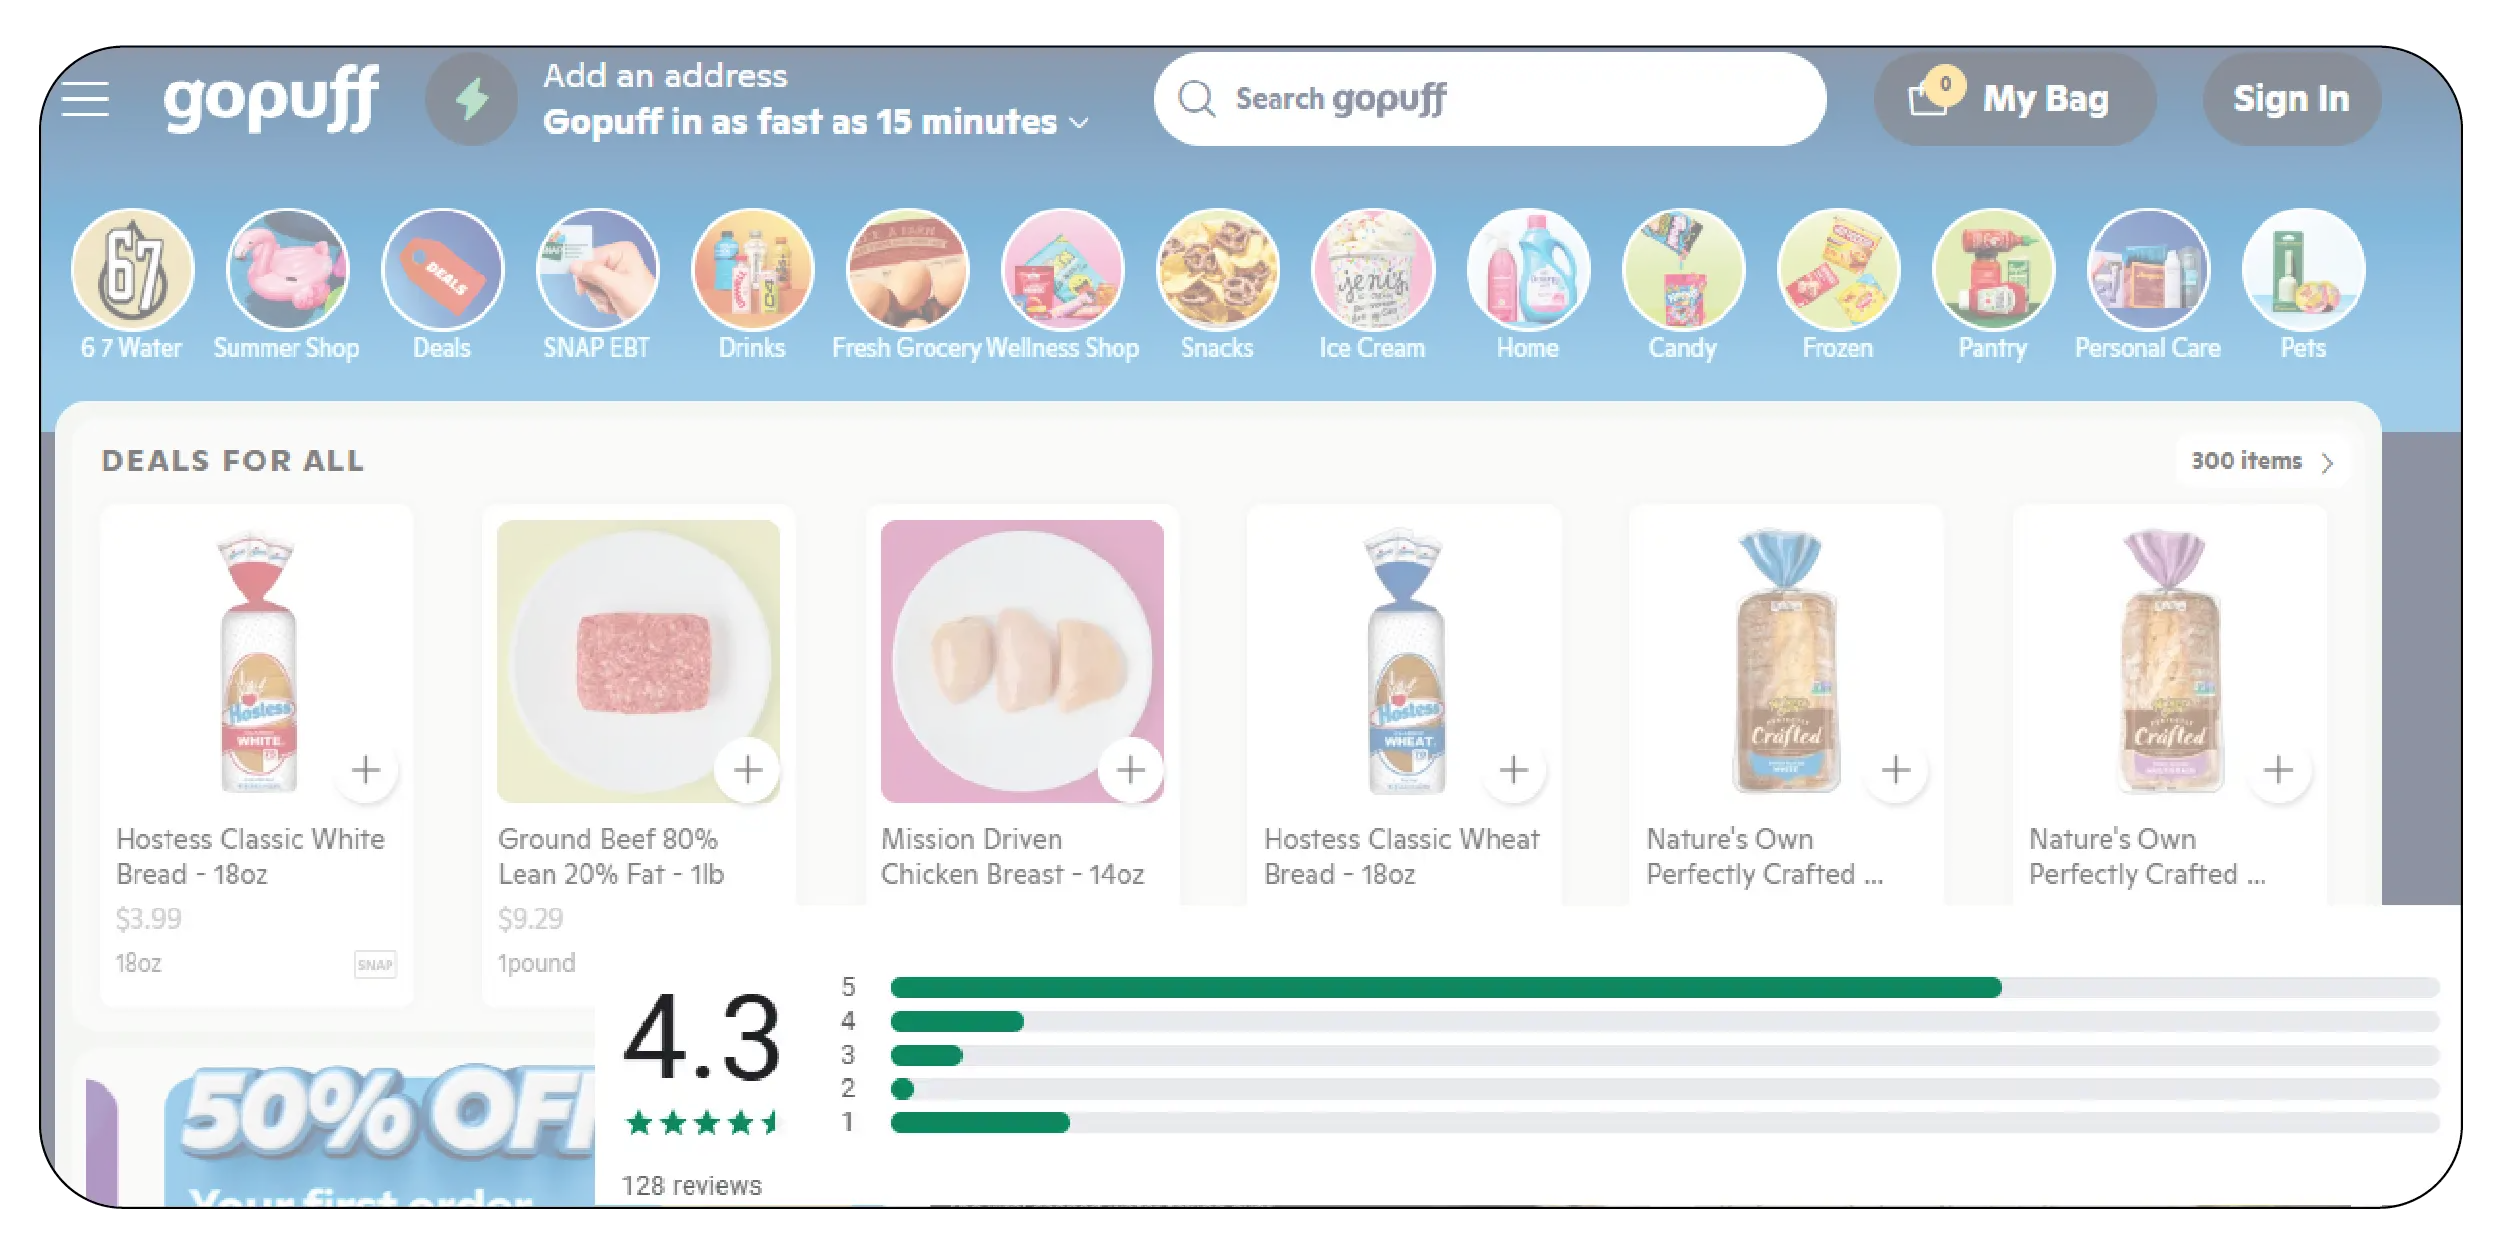
For example, with an Extract Real-Time Q-Commerce User Experience Data
workflow, you can map the ratio of 1-star vs. 5-star ratings by city, track which dark stores
struggle with high order inaccuracy, or flag repeat issues like payment failures. One leading
Q-commerce grocery app recently cut delivery complaints by 32% in three months after deploying
automated review scraping to target problematic zones.
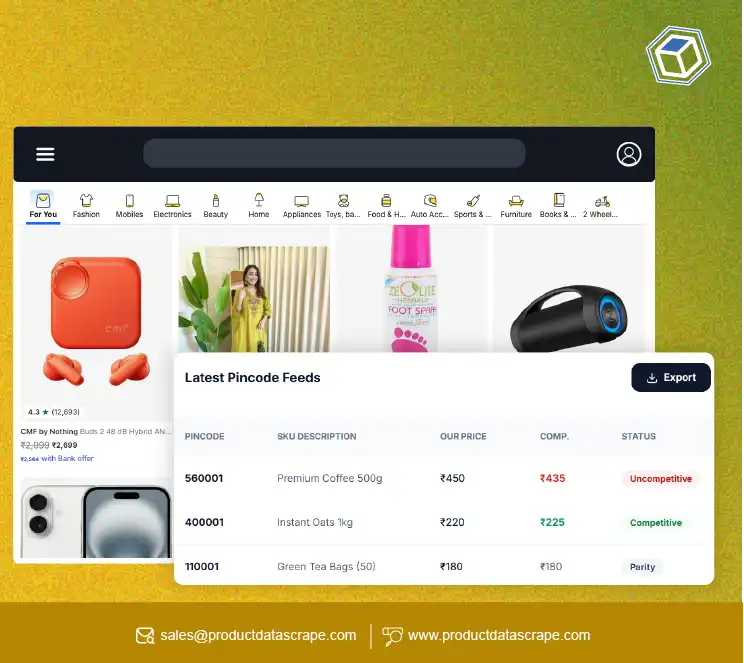
With Q-Commerce Performance Insights from Scraped Reviews, businesses don’t
just monitor — they act. Combining this with Q-Commerce Real-Time Pricing Data Scraper , they can
correlate poor service spikes with pricing shifts, discounts, or new promo campaigns.
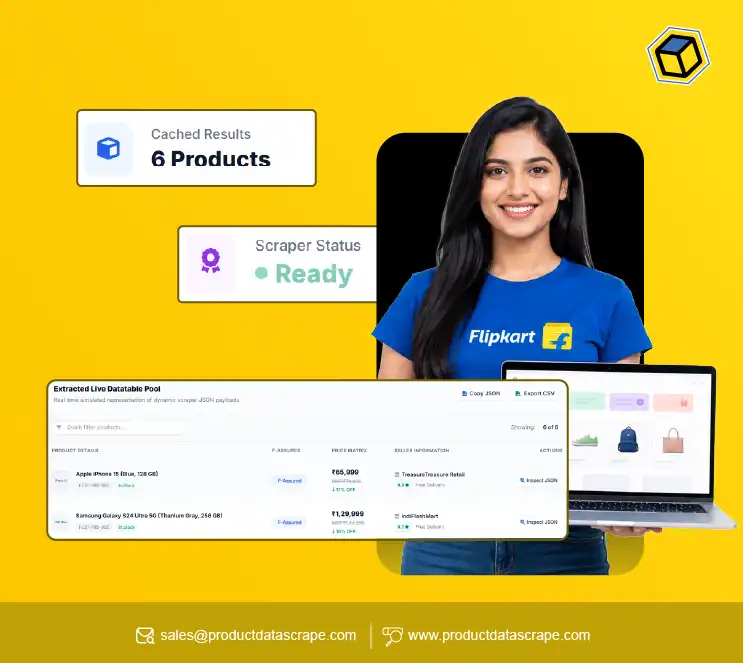
Together with Quick Commerce Grocery & FMCG Data Scraping , brands also match
service quality with product-specific insights, ensuring their fastest-moving SKUs align with
highest satisfaction levels. In today’s rapid delivery race, this is the secret sauce for
defending market share.
Average Q-Commerce App Rating (2020-2025)
| Year |
Avg. Rating |
| 2020 |
4.2 |
| 2021 |
4.1 |
| 2022 |
3.9 |
| 2023 |
3.8 |
| 2024 |
3.9 |
| 2025 |
4.0 |
Analysis:
A steady average app rating reflects how effective Real-Time Review Scraping
for Service Quality Analytics can be in identifying drops early. Retailers using live review
data quickly fix recurring service flaws, raising scores faster than competitors who rely on
outdated quarterly reports and manual audits. Better scores mean higher download rates.
Avg. % Negative Reviews
| Year |
% Negative |
| 2020 |
12% |
| 2021 |
14% |
| 2022 |
17% |
| 2023 |
19% |
| 2024 |
16% |
| 2025 |
14% |
Analysis:
The gradual decline in negative reviews after 2023 shows how Q-commerce players
benefit from scraping real-time reviews instead of reacting too late. When issues are flagged
instantly, support teams resolve them before they escalate. This proactive service approach
boosts customer trust, reduces churn, and protects brand reputation cost-effectively.
Top 3 Complaints (% Share)
| Year |
Delivery Delays |
Wrong Items |
Refund Issues |
| 2020 |
35% |
28% |
15% |
| 2021 |
32% |
30% |
18% |
| 2022 |
40% |
32% |
22% |
| 2023 |
38% |
31% |
20% |
| 2024 |
34% |
28% |
18% |
| 2025 |
30% |
25% |
15% |
Analysis:
Tracking shifts in the top complaints year-on-year proves why businesses invest
in Real-Time Review Scraping for Service Quality Analytics. Seeing the real distribution helps
teams prioritize fixes. Brands reduce costly mistakes like repeat refunds or lost orders by
focusing on the exact issues hurting satisfaction most at any given time.
Avg. Delivery Time Rating
| Year |
Delivery Score (/5) |
| 2020 |
4.0 |
| 2021 |
3.8 |
| 2022 |
3.7 |
| 2023 |
3.5 |
| 2024 |
3.8 |
| 2025 |
4.1 |
Analysis:
Delivery speed has a direct influence on customer loyalty. When delays are
mentioned in reviews, real-time scraping tools can instantly identify affected locations or
inefficient driver routes. This allows brands to respond fast—by rerouting deliveries, adding
capacity, or optimizing time slots. Many Q-commerce players now align operational KPIs like
on-time delivery rates with sentiment scores, enabling proactive service improvements and
stronger customer retention.
Refund Resolution Speed
| Year |
Avg. Days |
| 2020 |
5 |
| 2021 |
4.5 |
| 2022 |
4 |
| 2023 |
3.8 |
| 2024 |
3.5 |
| 2025 |
3.0 |
Analysis:
Faster refund handling comes from early detection. Review scraping helps
identify repeat refund reasons in real time. By automating feedback into support workflows,
businesses cut resolution times dramatically. The result is fewer frustrated customers, better
app store ratings, and lower support costs — all fueled by timely sentiment signals.
% Companies Using Review Scraping
| Year |
% Using |
| 2020 |
12% |
| 2021 |
18% |
| 2022 |
26% |
| 2023 |
35% |
| 2024 |
42% |
| 2025 |
51% |
Analysis:
More brands are adopting Real-Time Review Scraping for Service Quality
Analytics because manual monitoring no longer works at scale. Rising adoption confirms that
businesses now view user feedback as a live operational KPI, not just an annual survey metric.
Those who automate reviews gain faster problem-solving and measurable ROI.
Avg. Order Volume Growth
| Year |
YoY Growth |
| 2020 |
10% |
| 2021 |
18% |
| 2022 |
22% |
| 2023 |
20% |
| 2024 |
23% |
| 2025 |
25% |
Analysis:
When service quality improves, customers spend more. Clean, reliable reviews
help teams plug leaks that drain loyalty. By acting fast on scraping insights, companies drive
consistent order growth year after year. Better reviews attract new buyers, too, compounding
volume growth across crowded marketplaces competing for the same user base
% Automated Sentiment Tags
| Year |
% Tagged |
| 2020 |
20% |
| 2021 |
32% |
| 2022 |
44% |
| 2023 |
53% |
| 2024 |
61% |
| 2025 |
70% |
Analysis:
Turning raw reviews into tagged data unlocks actionable insights. NLP tagging
shows trending topics by city, product, or rider. Automation means teams see more than averages
— they see causes. Brands who connect sentiment tags with operations catch service dips early,
saving money on manual checks and boosting retention.
Avg. Weekly Review Volume per App
| Year |
Weekly Reviews |
| 2020 |
5,000 |
| 2021 |
7,200 |
| 2022 |
10,000 |
| 2023 |
12,500 |
| 2024 |
15,000 |
| 2025 |
18,000 |
Analysis:
Rising review volumes mean more noise. Manual reading is impossible at scale.
Automated scraping and parsing keep up with growing volumes, ensuring no hidden issue slips
through. Q-commerce players match growing feedback with faster fixes, which builds loyalty.
Larger datasets also train better prediction models for new feature launches.
Avg. Customer Retention Rate
Customer Retention Rate
| Year |
Retention % |
| 2020 |
45% |
| 2021 |
50% |
| 2022 |
53% |
| 2023 |
55% |
| 2024 |
58% |
| 2025 |
61% |
Analysis:
Retention rises when brands turn reviews into daily action plans.
Real-time scraping highlights root causes of churn — late deliveries, app bugs, rude riders.
By closing gaps faster than rivals, companies keep customers loyal. This table shows why
review scraping is no longer a nice-to-have — it’s mission-critical.
Conclusion
Combining Real-Time Review Scraping for Service Quality Analytics with
robust sentiment tools, SKU data, and delivery metrics gives Q-commerce leaders the edge to
protect ratings, retain loyal customers, and scale profitably. Ready to unlock your service
advantage? Contact Product Data Scrape today for custom review scraping solutions that
transform customer voice into clear action!