
Introduction
The Indian grocery retail sector is experiencing significant growth, driven by evolving consumer preferences, organized retail expansion, and the rise of online grocery platforms. Using Product-Wise Sales Data Extraction for Indian Grocery Chains provides retailers with actionable insights on sales trends, pricing, promotions, and inventory management. By tapping into this granular data, companies can forecast demand, optimize stock levels, and improve marketing strategies.
With the increasing importance of real-time analytics, tools like Web Data Intelligence API enable seamless integration of sales data into dashboards, providing stakeholders with accurate, up-to-date information. This empowers retailers to respond swiftly to market changes, track competitor performance, and ensure better profitability across all categories. By leveraging both online and offline data, supermarkets and grocery chains can unlock growth opportunities and maintain a competitive edge in a rapidly evolving retail landscape.
Understanding Product Performance in Indian Supermarkets
Retailers need detailed insights into how individual products perform across different stores and regions. Product-wise sales data scraping for Indian supermarkets allows businesses to monitor category-wise sales, track stock levels, and measure product popularity.
By combining sales data with visual product intelligence through Scrape Indian Online Grocery Store Images, companies gain clarity on product placement, packaging effectiveness, and promotional success. For example, tracking FMCG products, snacks, and beverages across multiple outlets reveals seasonal sales peaks and demand shifts.
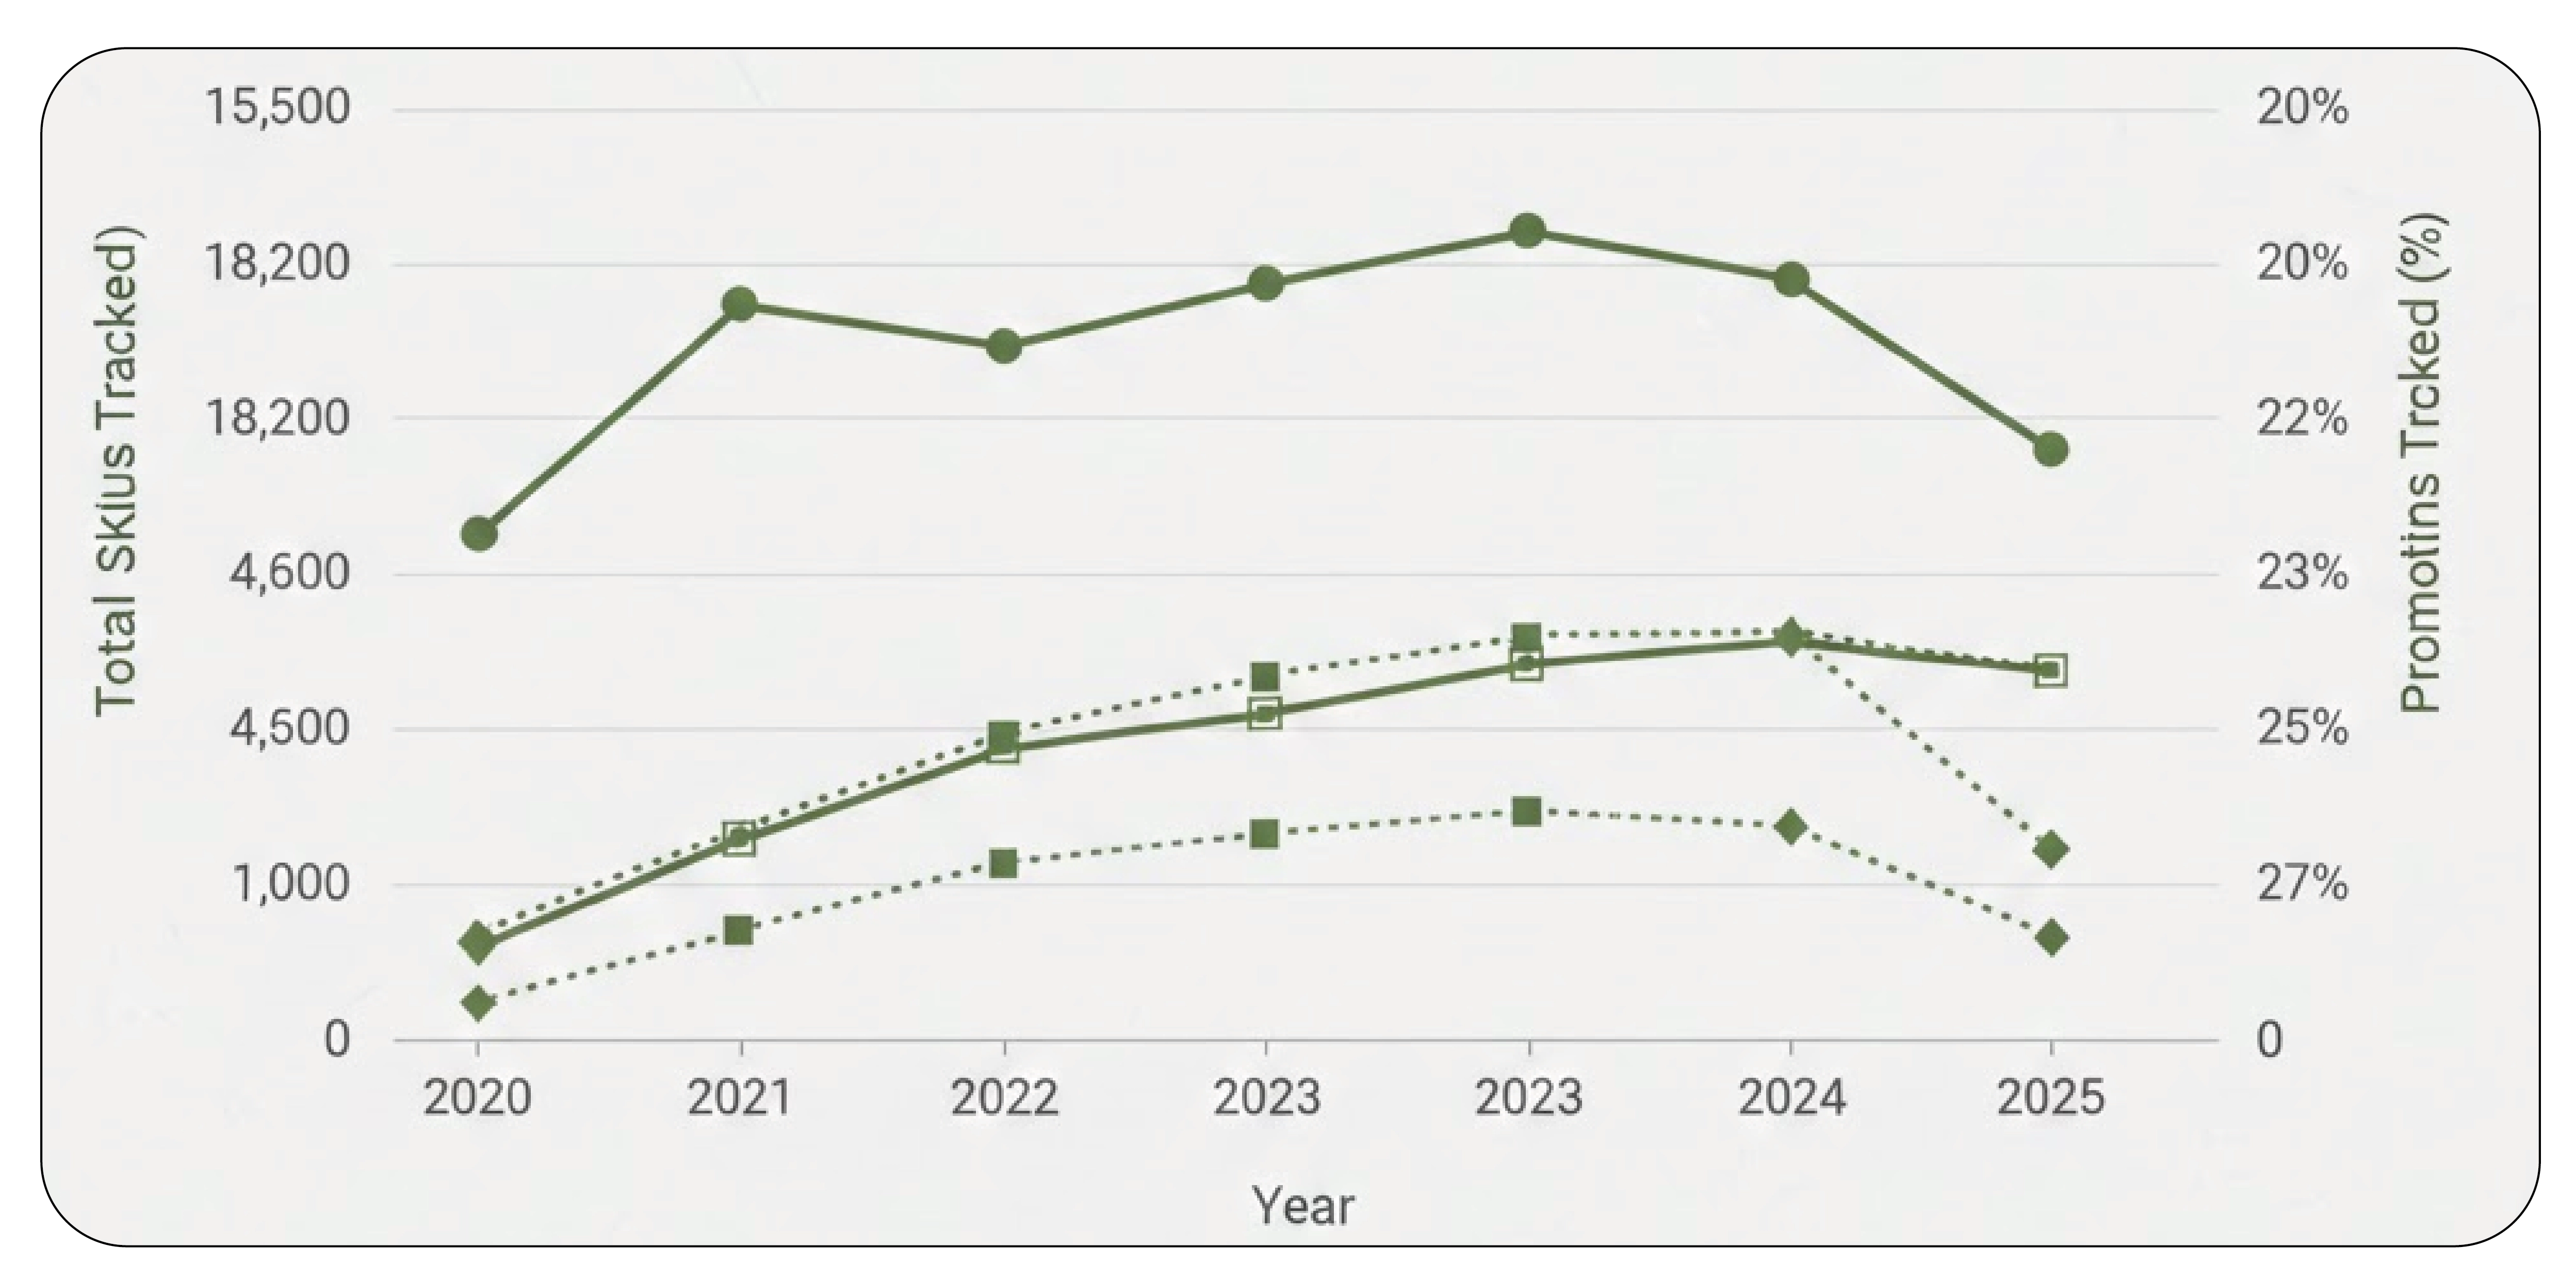
Indian Supermarket Sales Trends (2020–2025)
| Year |
Total SKUs Tracked |
Avg. Monthly Sales per SKU |
Promotions Tracked (%) |
| 2020 | 12,000 | 3,200 | 18% |
| 2021 | 15,500 | 3,600 | 20% |
| 2022 | 18,200 | 4,100 | 22% |
| 2023 | 21,000 | 4,500 | 23% |
| 2024 | 24,500 | 5,000 | 25% |
| 2025 | 28,000 | 5,600 | 27% |
This data highlights trends in product popularity and promotional effectiveness, enabling informed merchandising decisions.
Leveraging Data Extraction Services for Strategic Insights
Retail chains require systematic Indian grocery chain data extraction services to monitor sales, pricing, and product availability across multiple locations. These services streamline the collection of daily, weekly, and monthly sales data, ensuring retailers can act on real-time insights.
By capturing metrics such as stock-outs, turnover rates, and category performance, supermarkets can optimize supply chain operations and reduce inventory costs. Automated extraction also enables benchmarking across competitors and regions, helping businesses identify growth opportunities and adjust promotional strategies effectively.
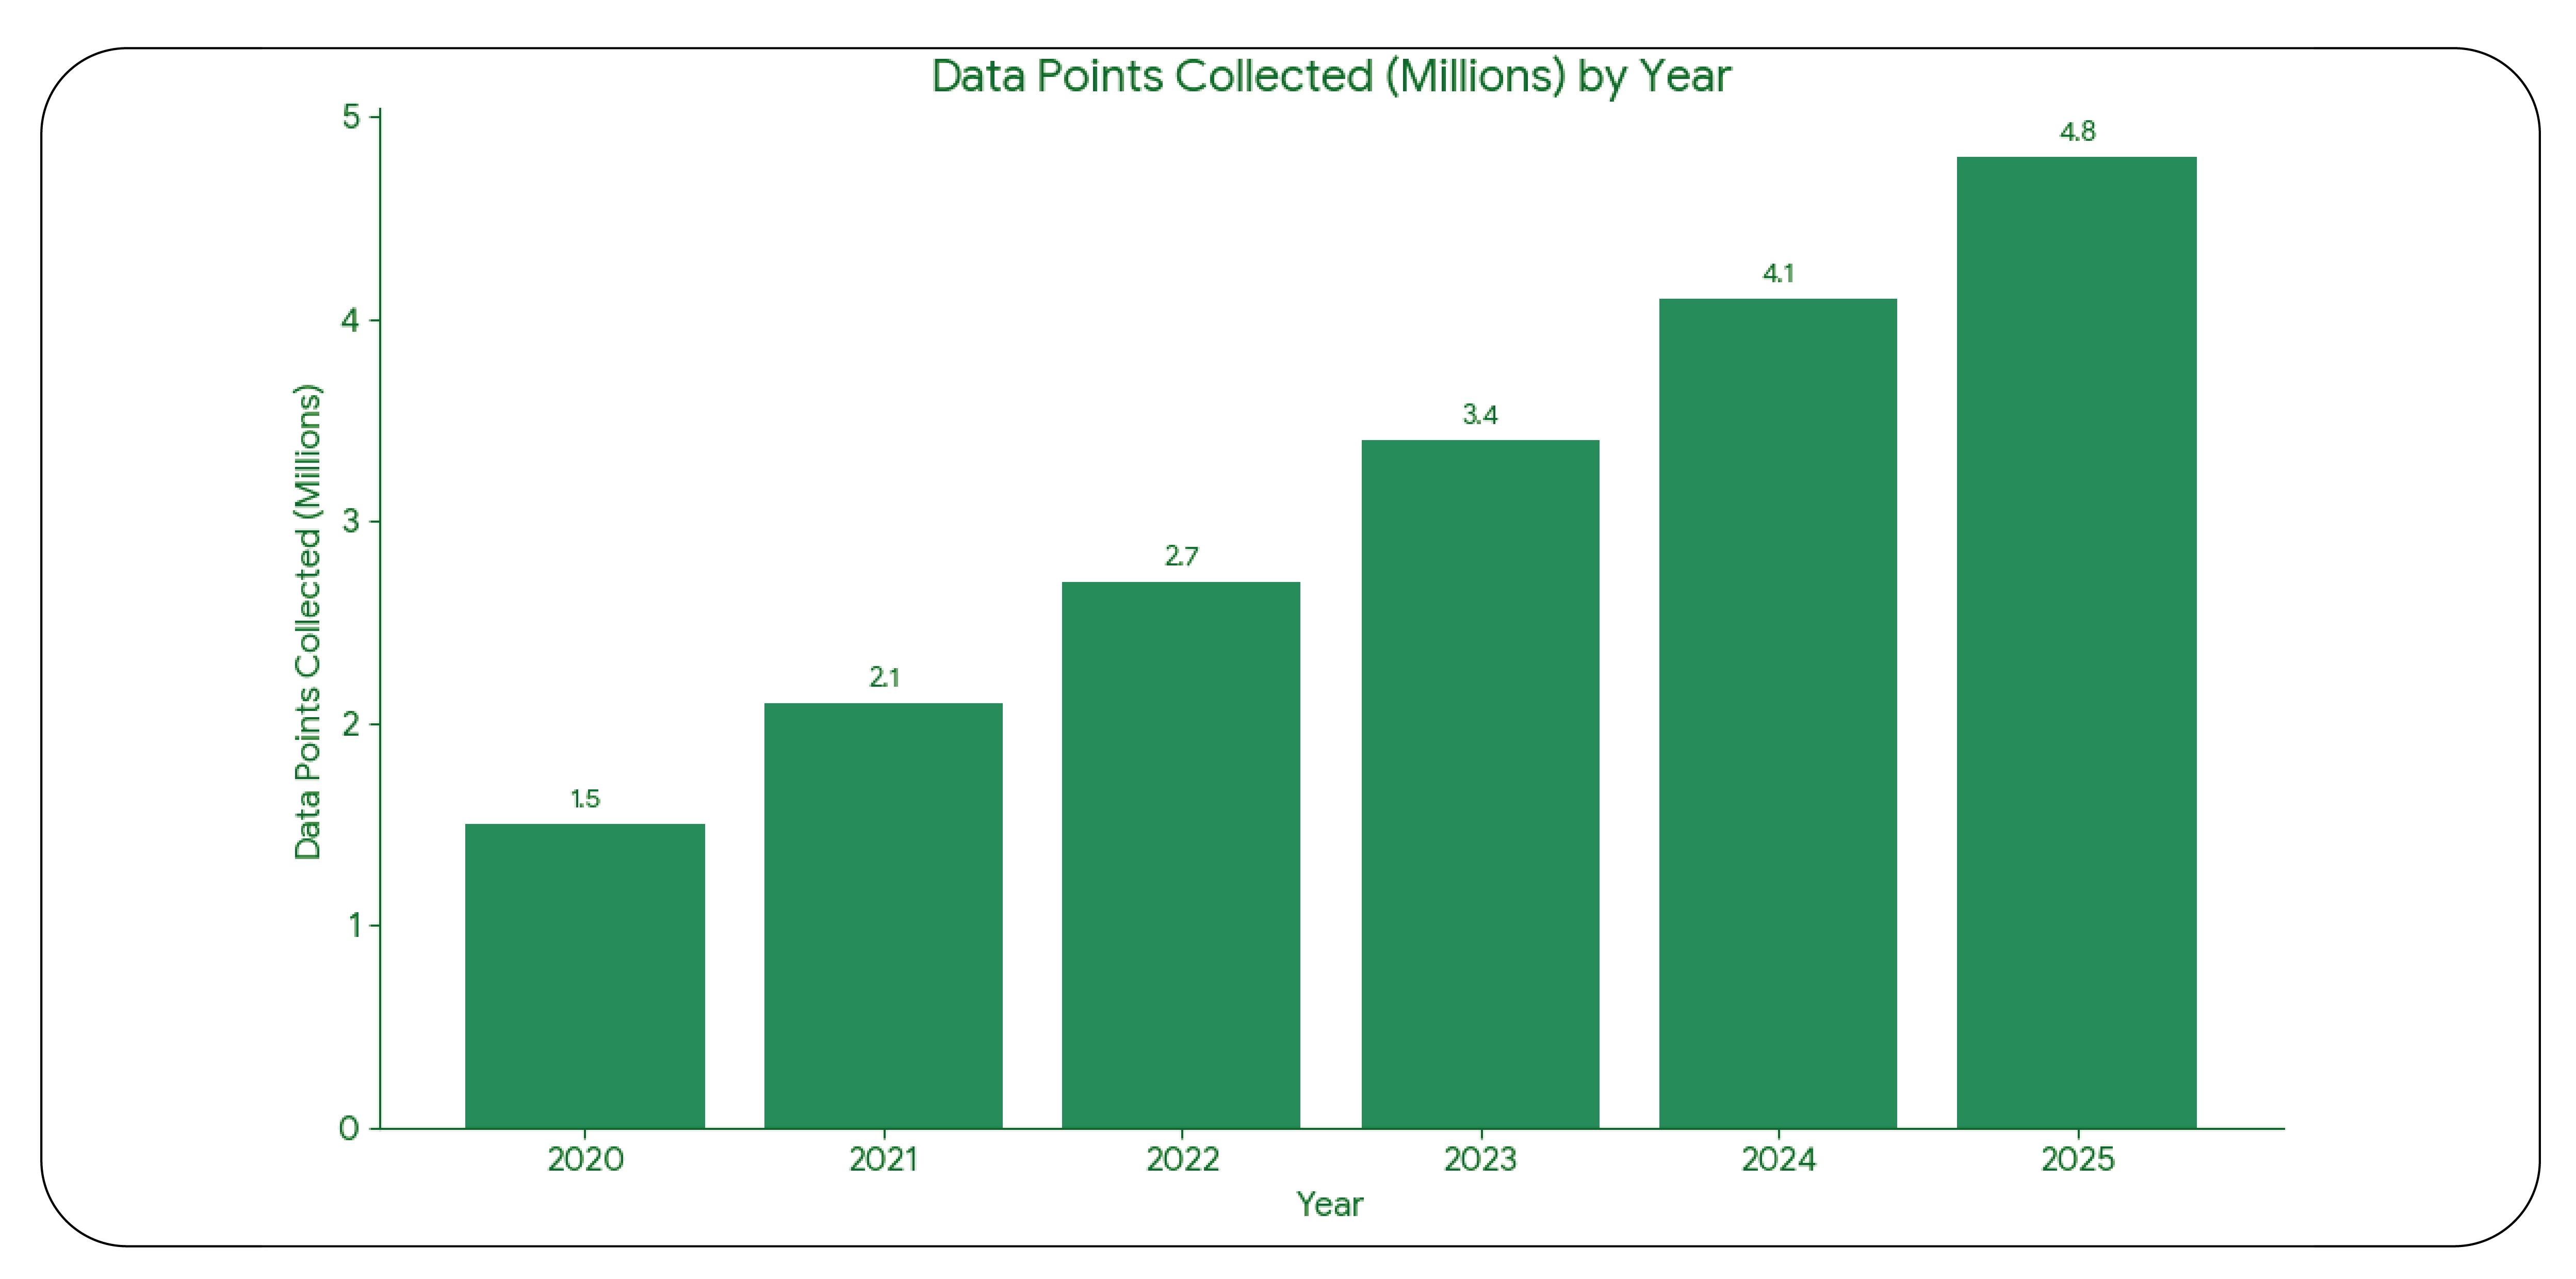
Data Extraction Metrics (2020–2025)
| Year |
Stores Covered |
SKUs Extracted |
Data Points Collected (Millions) |
| 2020 | 120 | 12,000 | 1.5 |
| 2021 | 150 | 15,500 | 2.1 |
| 2022 | 180 | 18,200 | 2.7 |
| 2023 | 210 | 21,000 | 3.4 |
| 2024 | 250 | 24,500 | 4.1 |
| 2025 | 300 | 28,000 | 4.8 |
SKU-Level Insights for Smarter Retail Decisions
Tracking SKU-level sales dataset for India allows grocery chains to make data-driven decisions. Each product’s performance can be analyzed for pricing, demand patterns, and seasonal trends.
Using a Scraper to Collect Commerce Intelligence, businesses can consolidate online and offline sales data, enabling precise forecasting. This empowers retailers to identify slow-moving SKUs, optimize promotional strategies, and enhance shelf management.
SKU Performance (2020–2025)
| Year |
SKUs Tracked |
Avg. Daily Sales |
Fast-Moving SKUs (%) |
| 2020 | 12,000 | 120 | 25% |
| 2021 | 15,500 | 140 | 28% |
| 2022 | 18,200 | 160 | 31% |
| 2023 | 21,000 | 180 | 34% |
| 2024 | 24,500 | 200 | 37% |
| 2025 | 28,000 | 220 | 40% |
Analyzing Historical Product Sales
Historical data is critical for forecasting and strategy. By maintaining a historical product-wise sales dataset, grocery chains can identify trends, peak seasons, and category growth over time.
Analyzing five-year trends from 2020–2025 allows retailers to predict consumer demand, adjust procurement cycles, and plan targeted promotions. Historical data also helps in understanding market fluctuations and regional preferences, giving businesses a competitive edge in inventory and pricing decisions.
Historical Sales Trends (2020–2025)
| Year |
Total Revenue (INR Crores) |
Avg. SKU Revenue |
Seasonal Sales Peaks |
| 2020 | 1,200 | 10,000 | Diwali, Summer |
| 2021 | 1,450 | 11,200 | Diwali, Monsoon |
| 2022 | 1,720 | 12,500 | Diwali, Summer |
| 2023 | 2,000 | 13,800 | Diwali, Monsoon |
| 2024 | 2,350 | 15,200 | Diwali, Summer |
| 2025 | 2,700 | 16,500 | Diwali, Monsoon |
API-Based Real-Time Sales Extraction

Modern retail demands real-time visibility into sales performance. API-based sales data extraction enables automated retrieval of store and SKU-level metrics, feeding dashboards for instant insights.
Integration with POS and e-commerce platforms ensures live tracking of stock-outs, demand surges, and promotions. Retailers can react quickly to changing market conditions, optimizing inventory and marketing strategies while improving operational efficiency.
API Extraction Metrics (2020–2025)
| Year |
API Calls/Day |
SKUs Updated |
Response Accuracy (%) |
| 2020 | 10,000 | 12,000 | 92% |
| 2021 | 15,000 | 15,500 | 94% |
| 2022 | 20,000 | 18,200 | 95% |
| 2023 | 25,000 | 21,000 | 96% |
| 2024 | 30,000 | 24,500 | 97% |
| 2025 | 35,000 | 28,000 | 98% |
Store-Level POS Analytics
Store-level POS sales data scraper captures detailed transactions, helping grocery chains analyze footfall, basket size, and product-level purchases. This data enables tailored promotions, category optimization, and demand forecasting.
Combining POS analytics with Product-Wise Sales Data Extraction for Indian Grocery Chains ensures a complete view of retail operations, from individual stores to regional and national trends. Retailers can plan inventory, promotions, and pricing strategies accurately.
POS Sales Metrics (2020–2025)
| Year |
Stores Monitored |
Transactions/Month (Millions) |
Avg. Basket Value (INR) |
| 2020 | 120 | 15 | 450 |
| 2021 | 150 | 18 | 480 |
| 2022 | 180 | 22 | 520 |
| 2023 | 210 | 25 | 550 |
| 2024 | 250 | 28 | 580 |
| 2025 | 300 | 32 | 620 |
Product Data Scrape offers comprehensive solutions to Extract Grocery & Gourmet Food Data with high accuracy and scalability. Leveraging Product-Wise Sales Data Extraction for Indian Grocery Chains, we provide real-time insights into sales trends, inventory, and promotions. Our automated scraping tools, API integrations, and POS-level analytics enable retailers to make data-driven decisions, optimize operations, and enhance competitiveness across India’s grocery sector.
Conclusion
With a robust Grocery store dataset, retailers gain visibility into SKU-level performance, historical trends, and POS-level insights. Combining automated data extraction, analytics dashboards, and API-based solutions empowers businesses to forecast demand, optimize inventory, and implement targeted marketing strategies. Product Data Scrape ensures accurate, actionable, and real-time data, helping Indian grocery chains stay competitive and maximize profitability in an increasingly complex retail landscape.


.webp)


