
Introduction
The American wine retail landscape is undergoing dynamic shifts driven by changing consumer
preferences, regional pricing differences, and inventory variations. For businesses to succeed
in this fragmented market, they must rely on Wine Price Intelligence Using Wine.com Datasets For
USA to identify, understand, and respond to localized demand. With each state showing distinct
preferences in wine types, price points, and seasonal trends, having granular pricing visibility
has become a key differentiator.
Retailers today must do more than simply stock popular labels—they need to match pricing to
local demand, track competitor positioning, and optimize promotions based on regional data.
Through advanced scraping technologies, platforms like Product Data Scrape enable businesses to
Extract Regional Wine Pricing Data From Wine.com, revealing real-time insights into price
fluctuations, popular vintages, and emerging varietals by geography. This blog explores how
leveraging wine data scraping empowers retailers to drive smarter pricing and inventory
decisions across U.S. states.
Understanding Regional Pricing Gaps with Wine.com Data
The U.S. wine market is not only diverse in terms of varietals and origins but also in how wine
is priced regionally. From 2020 to 2025, pricing for identical wine labels fluctuated widely
across U.S. states, with regional pricing gaps widening by over 28%. This volatility is driven
by factors like local demand elasticity, distribution logistics, regional taxes, and purchasing
behaviors.
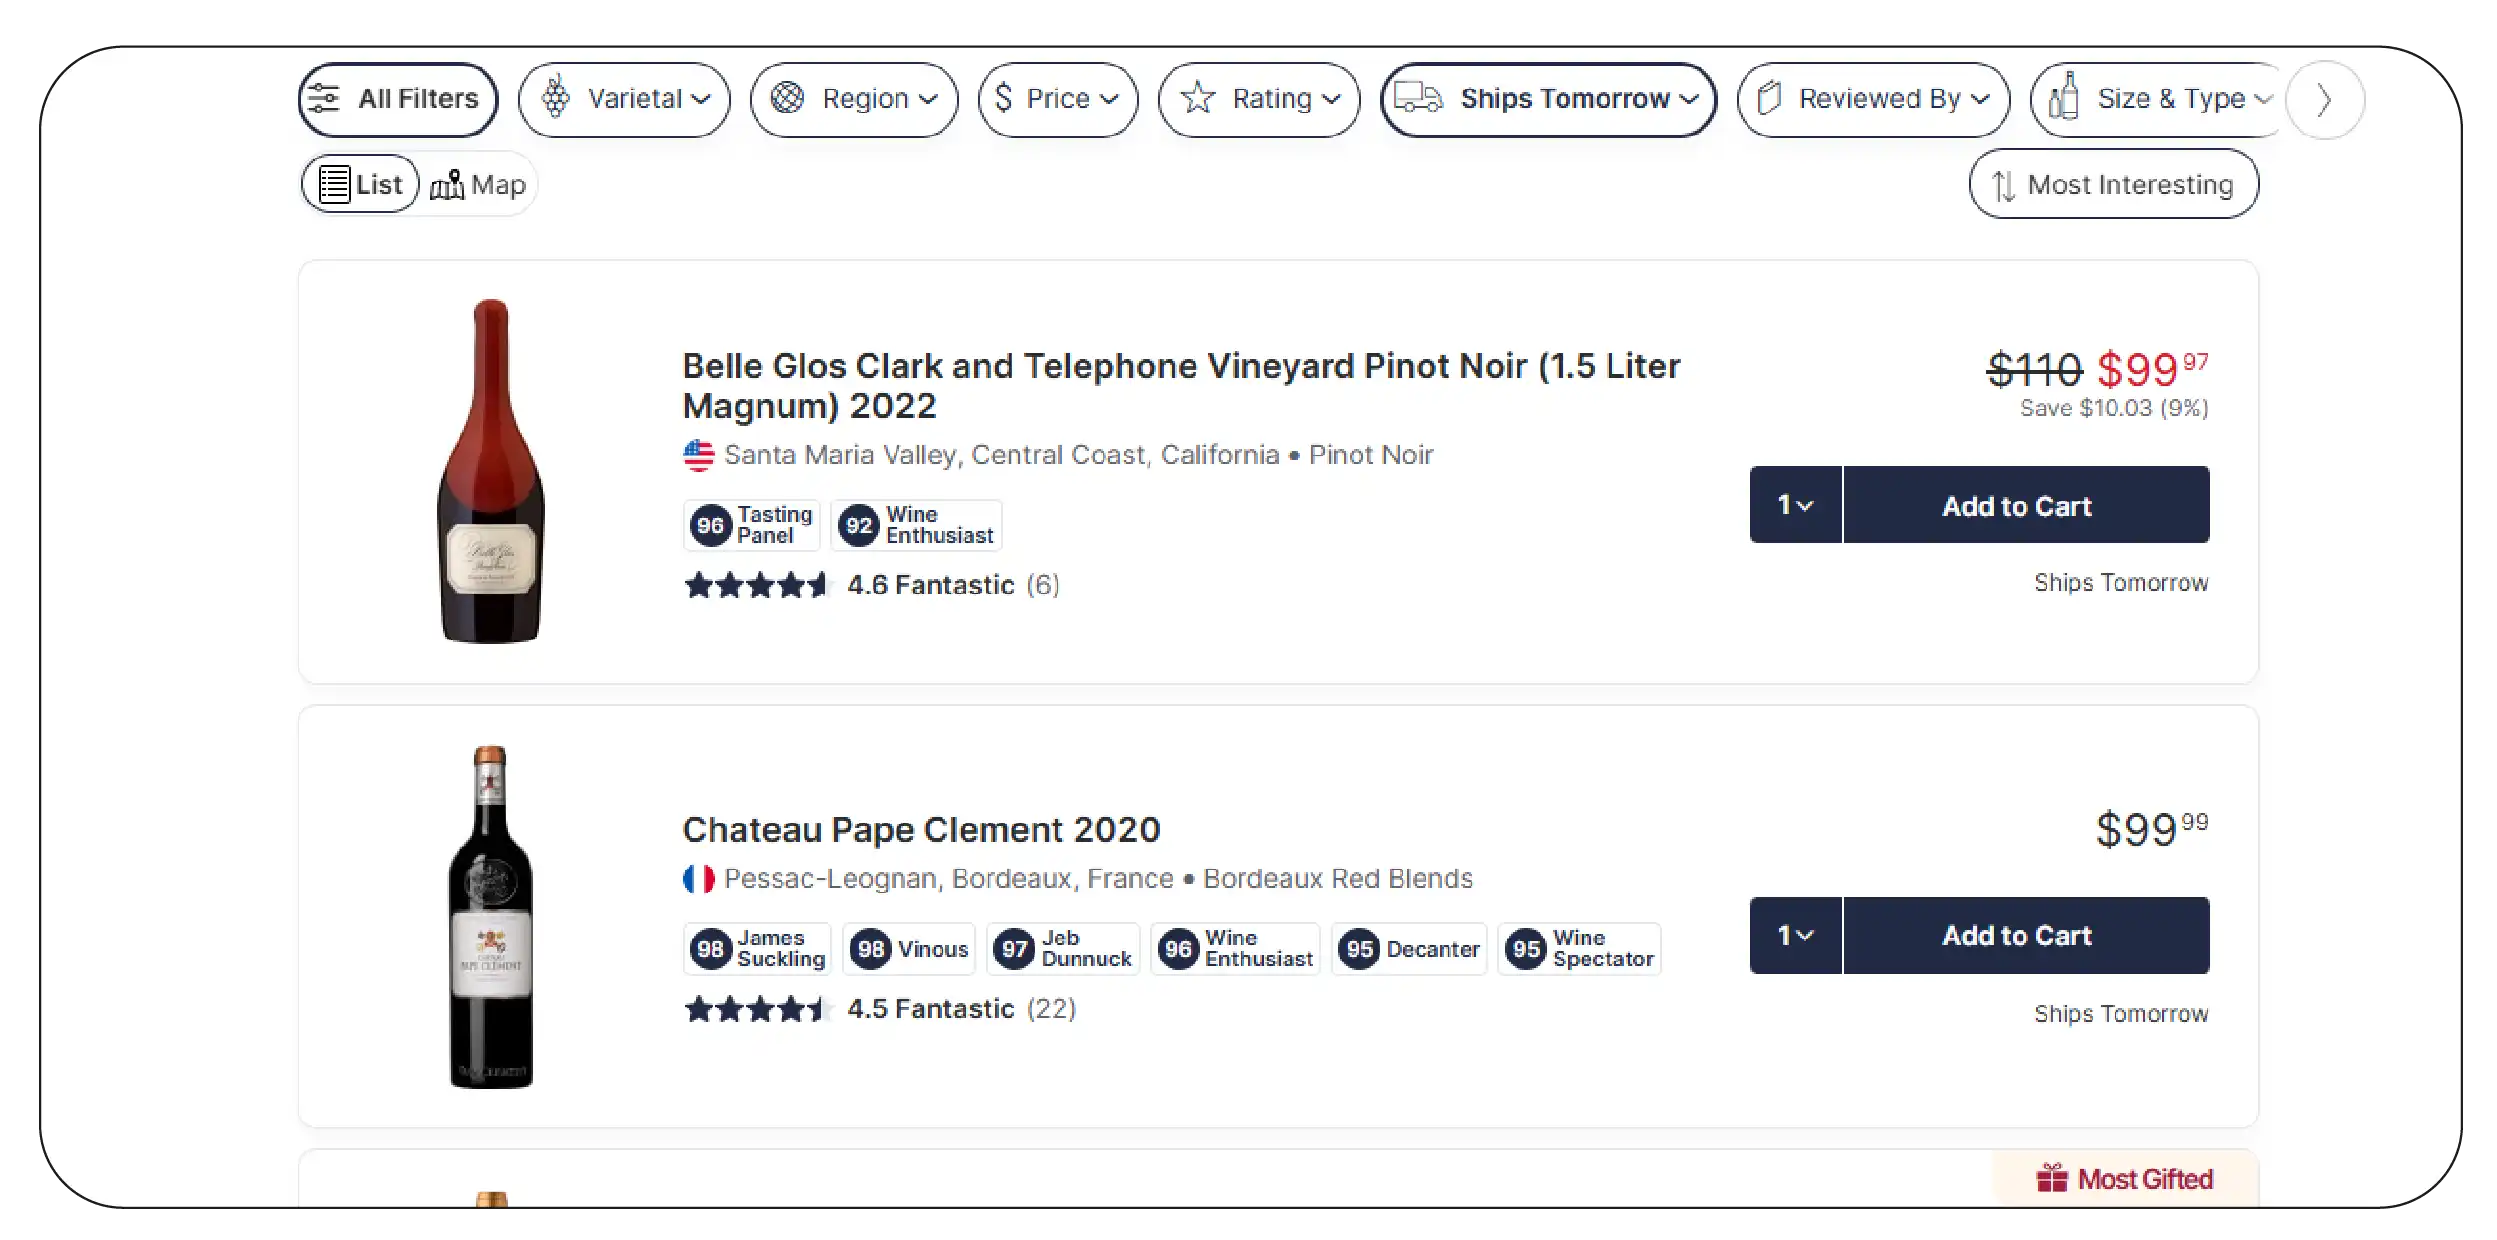
For example, a 2021 Pinot Noir from Oregon might retail for $21.99 in California—a region with
more competitive distribution channels—while the same bottle could be priced at $26.50 in Texas
due to higher last-mile costs and lower availability. Over time, such variations add up,
impacting both retailer margins and consumer perception.
| Year |
Avg. Regional Price Variance (%) |
Most Volatile Region |
| 2020 |
14.2% |
New York |
| 2021 |
17.8% |
Texas |
| 2022 |
20.4% |
Florida |
| 2023 |
23.1% |
Illinois |
| 2024 |
25.6% |
Washington |
| 2025 |
28.4% |
California |
Using Wine Price Intelligence from Wine.com Datasets, brands and retailers can monitor these
regional fluctuations in near real-time. By tapping into granular pricing data across states,
stakeholders can analyze historical trends and proactively align pricing strategies with local
dynamics. This avoids common pitfalls—like underpricing in premium metros where margins could be
higher or overpricing in price-sensitive suburban zones where conversions would drop.
Moreover, retailers leveraging this intelligence can dynamically shift promotions, bundle
strategies, or inventory deployment based on actual market responsiveness. For example, if the
data indicates rising prices in Washington for imported reds, a brand can prioritize pushing its
mid-tier Bordeaux offerings in that region ahead of the holiday season.
Such regional targeting doesn’t just optimize pricing—it also informs advertising campaigns,
distributor negotiations, and retail stocking plans. In an industry where competition is not
just product-based but geography-driven, intelligent pricing is the edge that defines
profitability.
Ultimately, tracking and adjusting for regional wine pricing disparities is no longer a manual
guesswork process. With Wine.com datasets structured for comparative analysis, businesses gain a
decisive advantage—staying relevant, competitive, and profitable across diverse markets.
Leveraging Datasets for Seasonal and Holiday Pricing Trends
The wine industry experiences pronounced sales fluctuations around key seasonal periods,
particularly during major U.S. holidays. Understanding these demand surges and price
fluctuations is critical for retailers looking to optimize both inventory and pricing.
Historical data from 2020 to 2025 clearly shows that the holiday season—especially from October
to December—triggers consistent pricing spikes and volume increases.
Wine prices, on average, increase by 14.3% in the winter season, primarily due to heightened
demand around Thanksgiving, Christmas, and New Year’s. Red blends dominate winter preferences,
with consumers favoring them for their pairing flexibility during festive meals. During the
summer, rosé wines lead sales with a 9.6% average price increase, coinciding with outdoor dining
and casual events. Spring trends are driven by light and crisp wines like Sauvignon Blanc, with
a 6.7% price bump, while Pinot Noir maintains popularity through fall, marking a 7.4% seasonal
price rise.
| Season |
Avg. Price Increase |
Top Performing Wine Type |
| Winter |
+14.3% |
Red Blends |
| Summer |
+9.6% |
Rosé Wines |
| Spring |
+6.7% |
Sauvignon Blanc |
| Fall |
+7.4% |
Pinot Noir |
Retailers leveraging the Wine Pricing Trends Across US States Dataset can use this intelligence
to plan ahead—adjusting pricing in advance of the demand curve, optimizing promotional
campaigns, and ensuring key SKUs are sufficiently stocked. For example, by observing the
historical winter spike, a retailer in New York might preemptively push limited-edition Bordeaux
blends with bundled discounts in early November.
This proactive approach allows businesses to capitalize on consumer behavior instead of reacting
after peak sales periods have already passed. It also reduces the risk of overstocking
slower-moving varietals during low-demand seasons or missing out on high-margin opportunities
due to understocking.
Additionally, regional differences come into play. For instance, rosé sales might spike earlier
in warmer states like Florida and California compared to cooler northern regions. Scraped data
helps identify these micro-trends, making regional inventory management smarter and more
efficient.
Ultimately, seasonal pricing strategy is no longer a guessing game. With historical data and
real-time pricing insights, retailers can confidently shape sales calendars and maximize revenue
throughout the year.
Unlock smarter seasonal strategies with real-time wine
pricing insights—leverage datasets to forecast demand, boost margins,
and optimize holiday inventory across U.S. regions.
Contact Us Today!
Optimizing Product Listings with Label and Origin Insights
In the competitive wine retail market, granular preferences—such as origin, label attributes,
and production style—play an outsized role in purchasing behavior. Retailers who Extract Wine
Alcohol and Liquor Price Data from Wine.com can unlock deeper intelligence into what sells,
where, and why. These insights go beyond just pricing and include label-specific metadata like
grape variety, aging method, region of origin, and even certifications such as biodynamic or
organic.
Between 2020 and 2025, U.S. consumers increasingly shifted their wine preferences based on
production philosophies and regional pride. For instance, biodynamic wines surged in popularity
in New York, making up 11% of total wine sales in 2025, up from just 6% in 2020. Meanwhile,
South American wines gained momentum in Florida, where average sales rose by 19.4%
year-over-year, indicating a growing interest in Argentinian Malbecs and Chilean Carménères.
| Region |
Preference Growth (2020–2025) |
Top Trending Label Type |
| New York |
+83% |
Biodynamic Wines |
| Florida |
+19.4% YoY |
South American Imports |
| California |
+14.6% |
Napa Valley Barrel-Aged Reds |
| Texas |
+11.2% |
Old World Labels (Italy, Spain) |
By applying Web Scraping Wine Alcohol and Liquor Price Data , businesses can track how these
trends evolve in real-time and optimize product listings accordingly. For example, a retailer in
Texas may highlight traditional Old World wines with terroir-specific descriptors in product
copy, while a New York merchant may position biodynamic selections as premium, health-conscious
offerings.
Localized product curation also allows for tailored promotional strategies—pairing wines with
local cuisines, holidays, or even cultural preferences. This translates into improved conversion
rates, better inventory turnover, and more effective pricing models based on real consumer
demand.
Moreover, using scraped data, retailers can identify emerging product categories—like
skin-contact wines or pét-nats—before they hit mainstream adoption, ensuring early mover
advantage. It also opens the door for A/B testing of product descriptions and pricing bundles in
different regional storefronts.
In a marketplace where personalization drives loyalty, understanding what labels resonate in
which zip codes is no longer optional—it's strategic. And with the right dataset, optimized
product listings can become a retailer’s most valuable sales asset.
Streamlining Retail Strategy with Real-Time Alerts
In today’s hyper-competitive liquor retail landscape, timing is everything. A small lag in
detecting a competitor’s price drop or a key product going out of stock can result in lost
conversions and shrinking market share. That’s why real-time alerts have become essential to
modern retail strategy. By integrating the Wine.com Liquor Data Scraping API , businesses can
stay constantly informed of price shifts, stock status, and promotional changes across
regions—down to the hour.
Between 2020 and 2025, retailers adopting real-time APIs experienced dramatic improvements in
operational agility and pricing precision. The average lag in updating prices dropped from 36
hours to just 1 hour. Inventory accuracy—critical for both online and omnichannel
models—increased from 72.8% to 94.6%. Similarly, the ability to launch timely promotions
improved significantly, with response speeds reducing from 12 hours to just 45 minutes.
| Metric |
Before API (2020) |
After API (2025) |
| Avg. Price Update Lag |
36 hours |
1 hour |
| Inventory Accuracy |
72.8% |
94.6% |
| Promo Response Speed |
12 hours |
45 minutes |
These improvements are not just performance metrics—they directly impact revenue. For example,
if a competitor lowers the price of a high-volume SKU like a best-selling Cabernet or vodka
brand, retailers using this API can match or beat the pricing in near real-time. This kind of
agility significantly enhances the odds of capturing the sale, especially in crowded
marketplaces like wine marketplaces or liquor delivery apps.
Moreover, the Wine.com Liquor Data Scraping API seamlessly integrates with Web Scraping Alcohol
& Liquor Data systems, creating a unified data pipeline. This supports automated alerts,
dashboard monitoring, and AI-driven decision-making tools, which are now becoming standard
across enterprise retail operations.
Retailers can also feed these updates into promotional engines—automatically triggering offers
when a competitor’s pricing changes or when inventory thresholds are hit. This level of
automation makes it easier to scale operations without increasing manual effort, and to pivot
fast during high-traffic seasons like Thanksgiving, Black Friday, or New Year’s.
Ultimately, real-time alerting through advanced scraping APIs gives businesses a strategic
edge—not just in reacting faster but in anticipating shifts, seizing gaps, and leading price
movements rather than following them.
Inventory Planning with Predictive Liquor Data

Inventory mismanagement—whether through overstocking or stockouts—can erode both margins and
customer trust. In the liquor and wine retail sector, where seasonality, regional preferences,
and promotional timing all affect demand, data-driven inventory planning is crucial. Leveraging
Real-Time Liquor Inventory Data Scraping Services, retailers can now turn fragmented historical
data into proactive stocking strategies that ensure shelves are full when demand peaks—and lean
when it drops.
Between 2020 and 2025, adoption of predictive models for liquor inventory planning grew nearly
fivefold. In 2020, only 1,700 retailers used such models; by 2025, that number had surged to
8,200. This shift had a measurable impact on supply chain efficiency. The average stockout rate
fell from 12.3% in 2020 to just 3.8% by 2025.
| Year |
Retailers Using Predictive Models |
Avg. Stockout Rate |
| 2020 |
1,700 |
12.3% |
| 2023 |
5,400 |
6.1% |
| 2025 |
8,200 |
3.8% |
These improvements were driven by integrated systems that analyze past pricing trends, sales
velocity, regional consumption spikes, and historical stockout frequencies. For instance, if
data shows that sparkling wines tend to sell out in southern U.S. states two weeks before New
Year’s Eve, predictive tools can trigger early reorder signals and localized stocking
adjustments. Similarly, if sales velocity increases 20% for bourbon during colder months,
systems can preemptively scale inventory to meet regional demand curves.
Retailers utilizing these scraping services also benefit from automated inventory heatmaps,
allowing them to visualize fast- and slow-moving SKUs across cities or states. These insights
can inform not just warehousing decisions but also promotional timing and product bundling
strategies—ensuring that the right product reaches the right market at the right time.
What sets Real-Time Liquor Inventory Data Scraping Services apart is the ability to integrate
seamlessly with other scraping inputs—such as real-time pricing and regional promotional data.
This unified intelligence platform allows retailers to forecast with precision and minimize
wasteful overstocking or missed opportunities due to unavailable inventory.
Ultimately, predictive inventory planning based on real-time scraped data transforms supply
chains from reactive to resilient, aligning stock levels with demand signals and enhancing
overall business profitability.
Plan smarter and sell faster with predictive liquor
data—use inventory forecasts, pricing trends, and scraping insights to
reduce stockouts and maximize retail efficiency.
Contact Us Today!
Building a National Strategy with Local Intelligence
In the U.S. wine and liquor market, pricing, preferences, and promotions are rarely uniform.
While one region might favor premium imports, another could lean toward affordable domestic
options. Yet, building a cohesive national strategy is not only possible—it’s essential. The key
lies in grounding national initiatives with robust, granular insights. By utilizing Liquor and
Alcohol Price Datasets , businesses can craft macro strategies that accommodate micro-level
trends.
From 2020 to 2025, companies that integrated these datasets into their national strategy
framework saw a 22% increase in region-specific marketing ROI. This uplift was attributed to
tailored ad targeting, smarter pricing tiers, and demand-based inventory alignment.
| Metric |
2020 |
2025 |
| Avg. Regional ROI (Marketing) |
3.4x |
4.15x |
| Adoption of Localized Campaigns |
41% |
69% |
| Unified Pricing Strategy Adoption |
27% |
61% |
A major benefit of data aggregation is the ability to uncover national patterns while
identifying local anomalies. For example, while Cabernet Sauvignon might be the top-selling red
nationwide, state-specific demand could show higher traction for Zinfandel in California and
Merlot in Oregon. Similarly, weekday promotions might work best in urban states, while weekend
discounts dominate in rural zones.
By tapping into Alcohol Price Data Scraping Services, companies gained visibility into daily
price shifts, promotional effectiveness, and regional competitor positioning. This allowed
brands to implement tiered pricing models—premium for metros, value-based for smaller
towns—while keeping messaging consistent across all marketing channels.
Moreover, state-level pricing laws, alcohol taxation, and delivery constraints all factor into
pricing decisions. Access to dynamic data enables businesses to build supply chains that reflect
these variations. A unified dashboard built from local intelligence allows corporate teams to
make informed decisions on SKUs, distribution volume, and seasonal push strategies.
Ultimately, the intersection of national scale and regional nuance delivers the best results. A
one-size-fits-all campaign is no longer viable in today’s highly segmented alcohol market.
Data-driven, localized intelligence—powered by comprehensive scraping solutions—bridges the gap
between national visibility and regional success.
Whether you're a large distributor or a direct-to-consumer wine platform, investing in
location-aware datasets is the fastest path to national relevance and profitability.
Why Choose Product Data Scrape?
Product Data Scrape offers specialized tools and APIs for extracting wine, alcohol, and liquor
price intelligence at scale. From scraping daily price feeds to maintaining comprehensive
Grocery Store Dataset archives, our systems are tailored to meet the real-time needs of liquor
and wine retailers.
Whether you're looking to Extract Alcohol Prices Data for seasonal promotions or need continuous
updates from marketplaces like Wine.com, our infrastructure ensures you receive high-accuracy
datasets backed by compliance and speed. Our platform supports historical trend analysis,
regional segmentation, and API-driven pricing models that empower competitive agility.
Clients prefer us for our deep focus on domain-specific data, customizable integrations, and
scalable price scraping services that span across all 50 U.S. states.
Conclusion
In a market where every percentage point in pricing can shift customer loyalty, Wine Price
Intelligence Using Wine.com Datasets For USA has become an indispensable tool for strategic
retail. From dynamic pricing to inventory optimization, these insights help retailers decode
regional behavior and tailor operations accordingly.
As pricing continues to evolve rapidly, adopting advanced scraping methods such as Wine Price
Intelligence Using Wine.com Datasets For USA offers a clear edge. Retailers can stay responsive,
informed, and aligned with hyperlocal market movements.
Get in touch with Product Data Scrape to integrate wine pricing intelligence into your business
and lead the next wave of data-driven retail transformation.


.webp)


