
Introduction
The Indian quick commerce (q-commerce) sector has seen an unprecedented surge over the past few years, driven by increasing smartphone penetration, digital payments, and the need for instant delivery of groceries and FMCG products. Companies are now competing not just at the city or region level, but at the pincode-wise level, optimizing pricing strategies to capture micro-markets efficiently. Understanding Pincode-Wise Price Wars in Indian Quick Commerce is critical for brands aiming to maintain competitiveness, predict demand patterns, and make informed pricing decisions.
With a focus on hyperlocal markets, quick commerce players are increasingly leveraging product data scrape techniques to monitor competitor pricing, consumer behavior, and inventory levels in real time. This report delves into granular Pincode-Level Price Intelligence in India, competitive insights, pricing trends, and the role of data scraping tools in shaping the pricing landscape from 2020 to 2026.
Understanding Localized Pricing Patterns
Companies have begun shifting from city-wide pricing strategies to granular pincode-level insights, enabling them to tailor discounts and offers to specific neighborhoods. Analyzing data from 2020–2026 reveals distinct variations in product pricing based on geographic and socio-economic factors.
| Year |
Average Delivery Price (INR) |
Average Grocery Basket Price (INR) |
Active Q-Commerce Players |
Hyperlocal Discount (%) |
| 2020 |
35 |
450 |
12 |
5 |
| 2021 |
33 |
470 |
18 |
7 |
| 2022 |
32 |
490 |
25 |
10 |
| 2023 |
31 |
510 |
32 |
12 |
| 2024 |
30 |
530 |
40 |
14 |
| 2025 |
29 |
550 |
48 |
16 |
| 2026 |
28 |
570 |
55 |
18 |
Tracking Pincode-Level Price Intelligence in India helps brands understand which areas are price-sensitive, where to deploy aggressive promotions, and how to optimize delivery charges. Retailers can monitor competitors’ basket pricing and promotional strategies within specific zones, allowing hyperlocal campaigns that maximize ROI.
Competitive Pricing Across the Nation
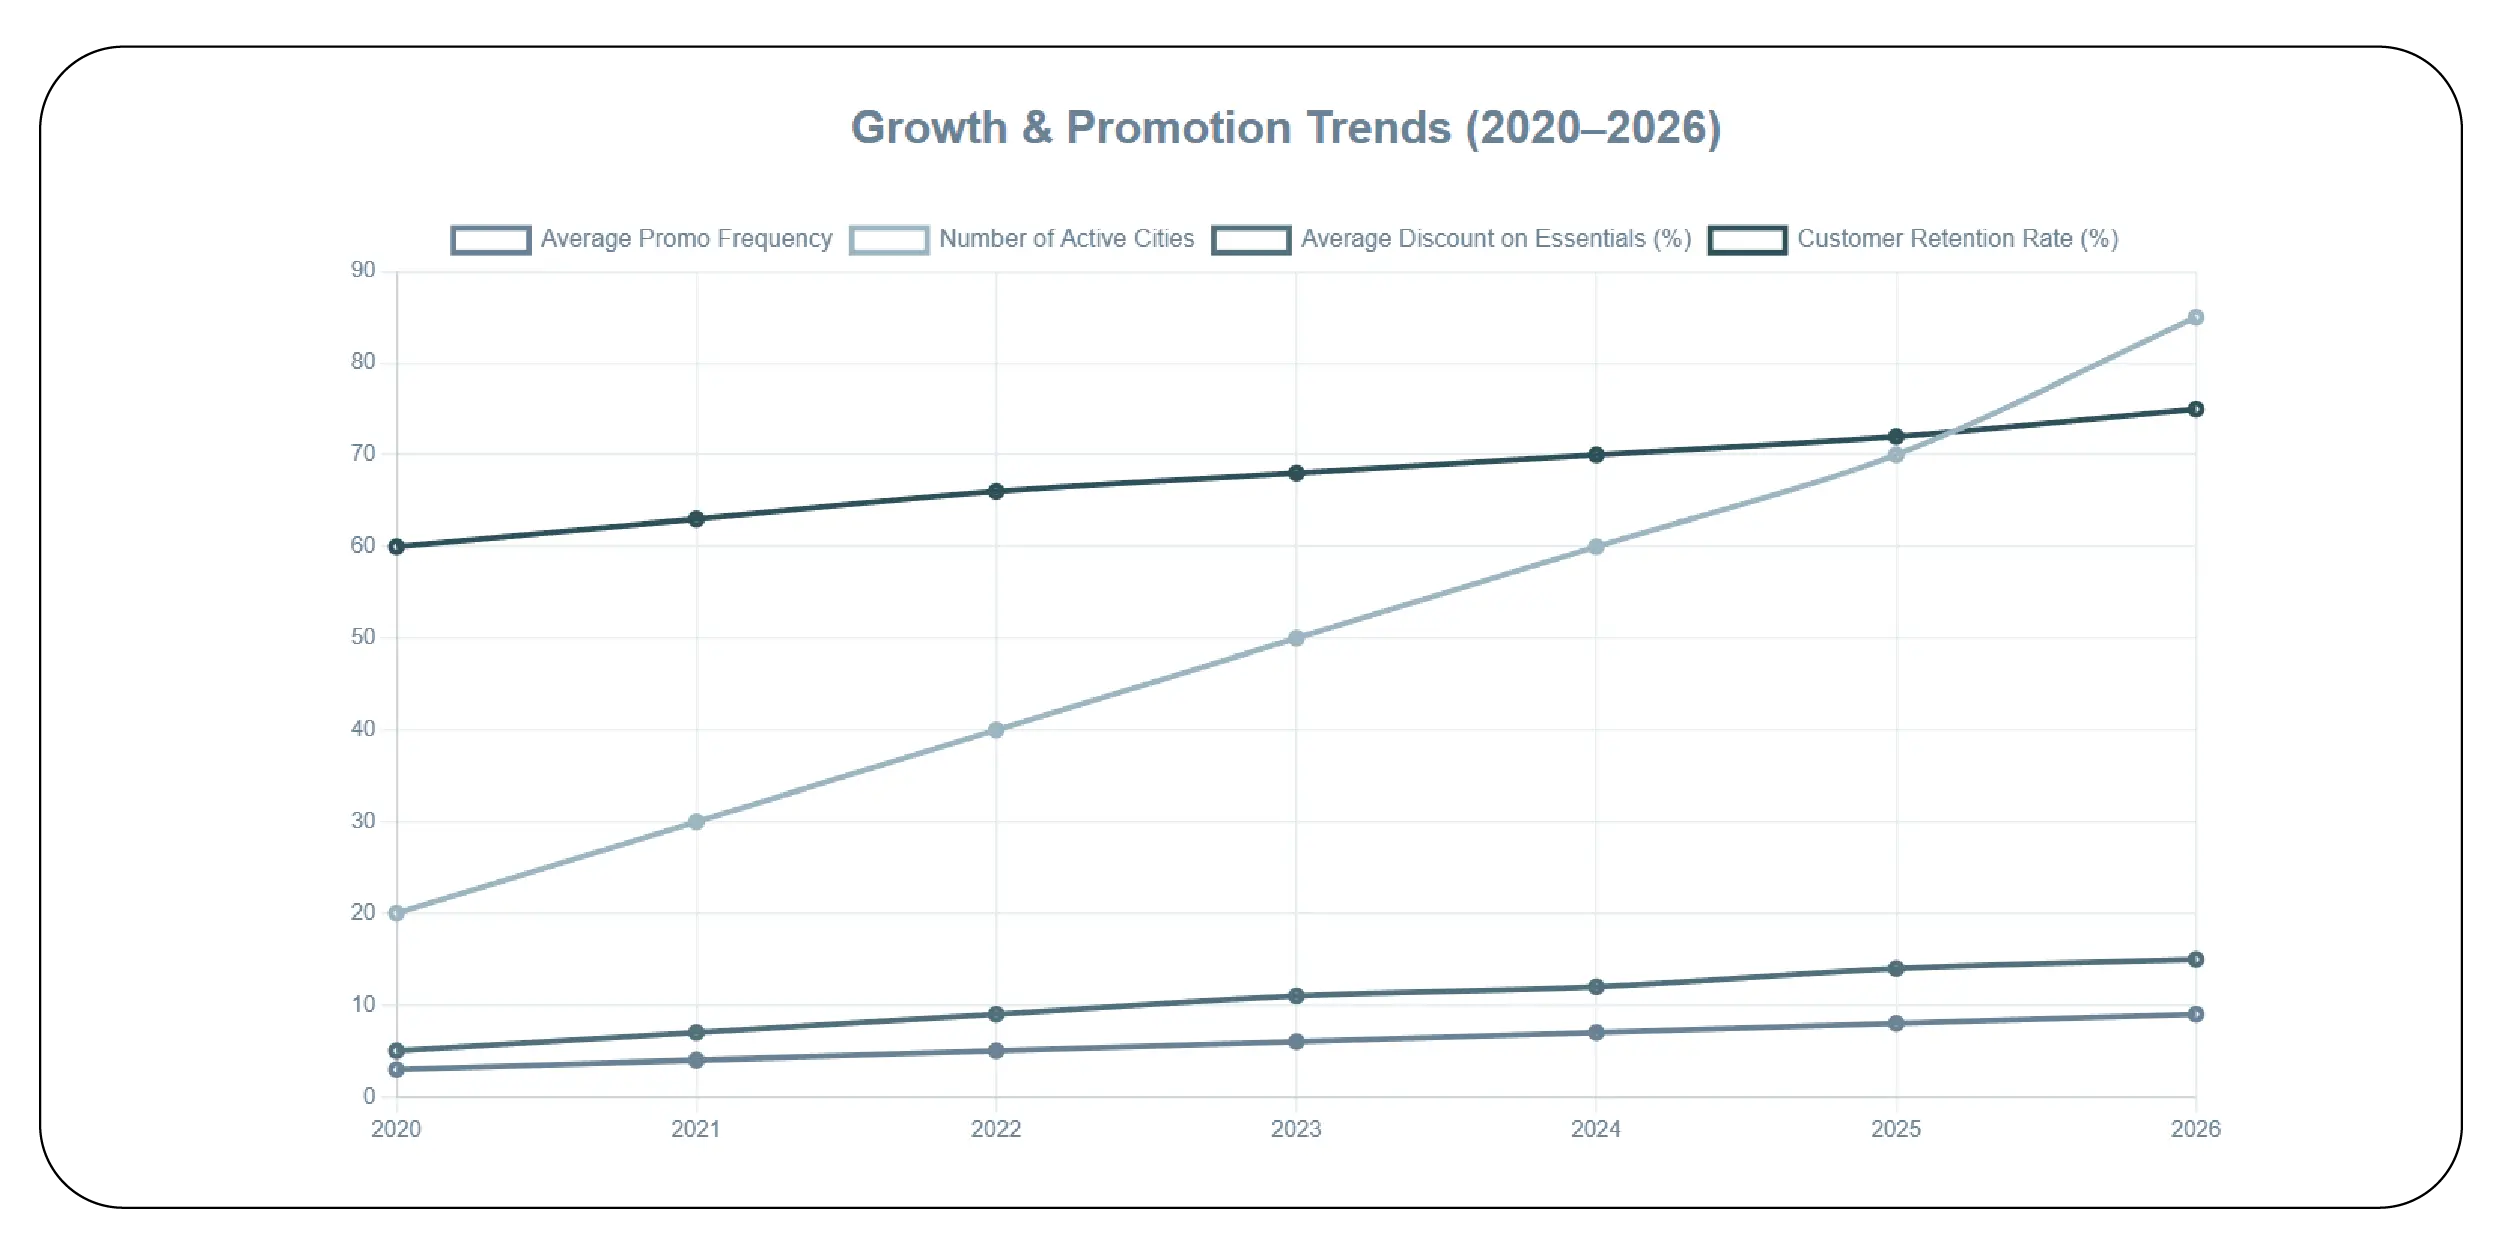
India’s quick commerce pricing landscape has matured significantly between 2020 and 2026. Businesses have adopted dynamic pricing models that respond in real-time to competitor offers, inventory fluctuations, and consumer demand.
| Year |
Average Promo Frequency |
Number of Active Cities |
Average Discount on Essentials (%) |
Customer Retention Rate (%) |
| 2020 |
3 |
20 |
5 |
60 |
| 2021 |
4 |
30 |
7 |
63 |
| 2022 |
5 |
40 |
9 |
66 |
| 2023 |
6 |
50 |
11 |
68 |
| 2024 |
7 |
60 |
12 |
70 |
| 2025 |
8 |
70 |
14 |
72 |
| 2026 |
9 |
85 |
15 |
75 |
The evolution of the India Quick Commerce Pricing Landscape shows a clear trend toward hyperlocal customization. Companies that fail to adopt such models risk losing market share to competitors with agile pricing strategies. Insights derived from product data scrape allow for predictive pricing, offering a competitive edge.
Leveraging Neighborhood-Level Insights
Hyperlocal strategies enable companies to identify micro-trends that city-wide analytics might miss. Using Hyperlocal Pricing Intelligence Using Pincode-Level Data, businesses can understand customer preferences, buying patterns, and peak demand hours for each pincode.
| Pincode |
Avg. Basket Value (INR) |
Peak Order Hour |
Promo Sensitivity (%) |
Competitor Count |
| 110001 |
520 |
18:00 |
15 |
5 |
| 560001 |
540 |
20:00 |
17 |
6 |
| 400001 |
500 |
19:00 |
14 |
4 |
| 600001 |
550 |
21:00 |
18 |
7 |
| 700001 |
530 |
18:30 |
16 |
5 |
Analyzing Hyperlocal Pricing Intelligence Using Pincode-Level Data empowers retailers to optimize stock allocation, introduce personalized promotions, and improve delivery efficiency. These insights not only drive sales but also enhance customer loyalty by providing targeted deals tailored to local preferences.
Tracking Price Trends and Market Competition
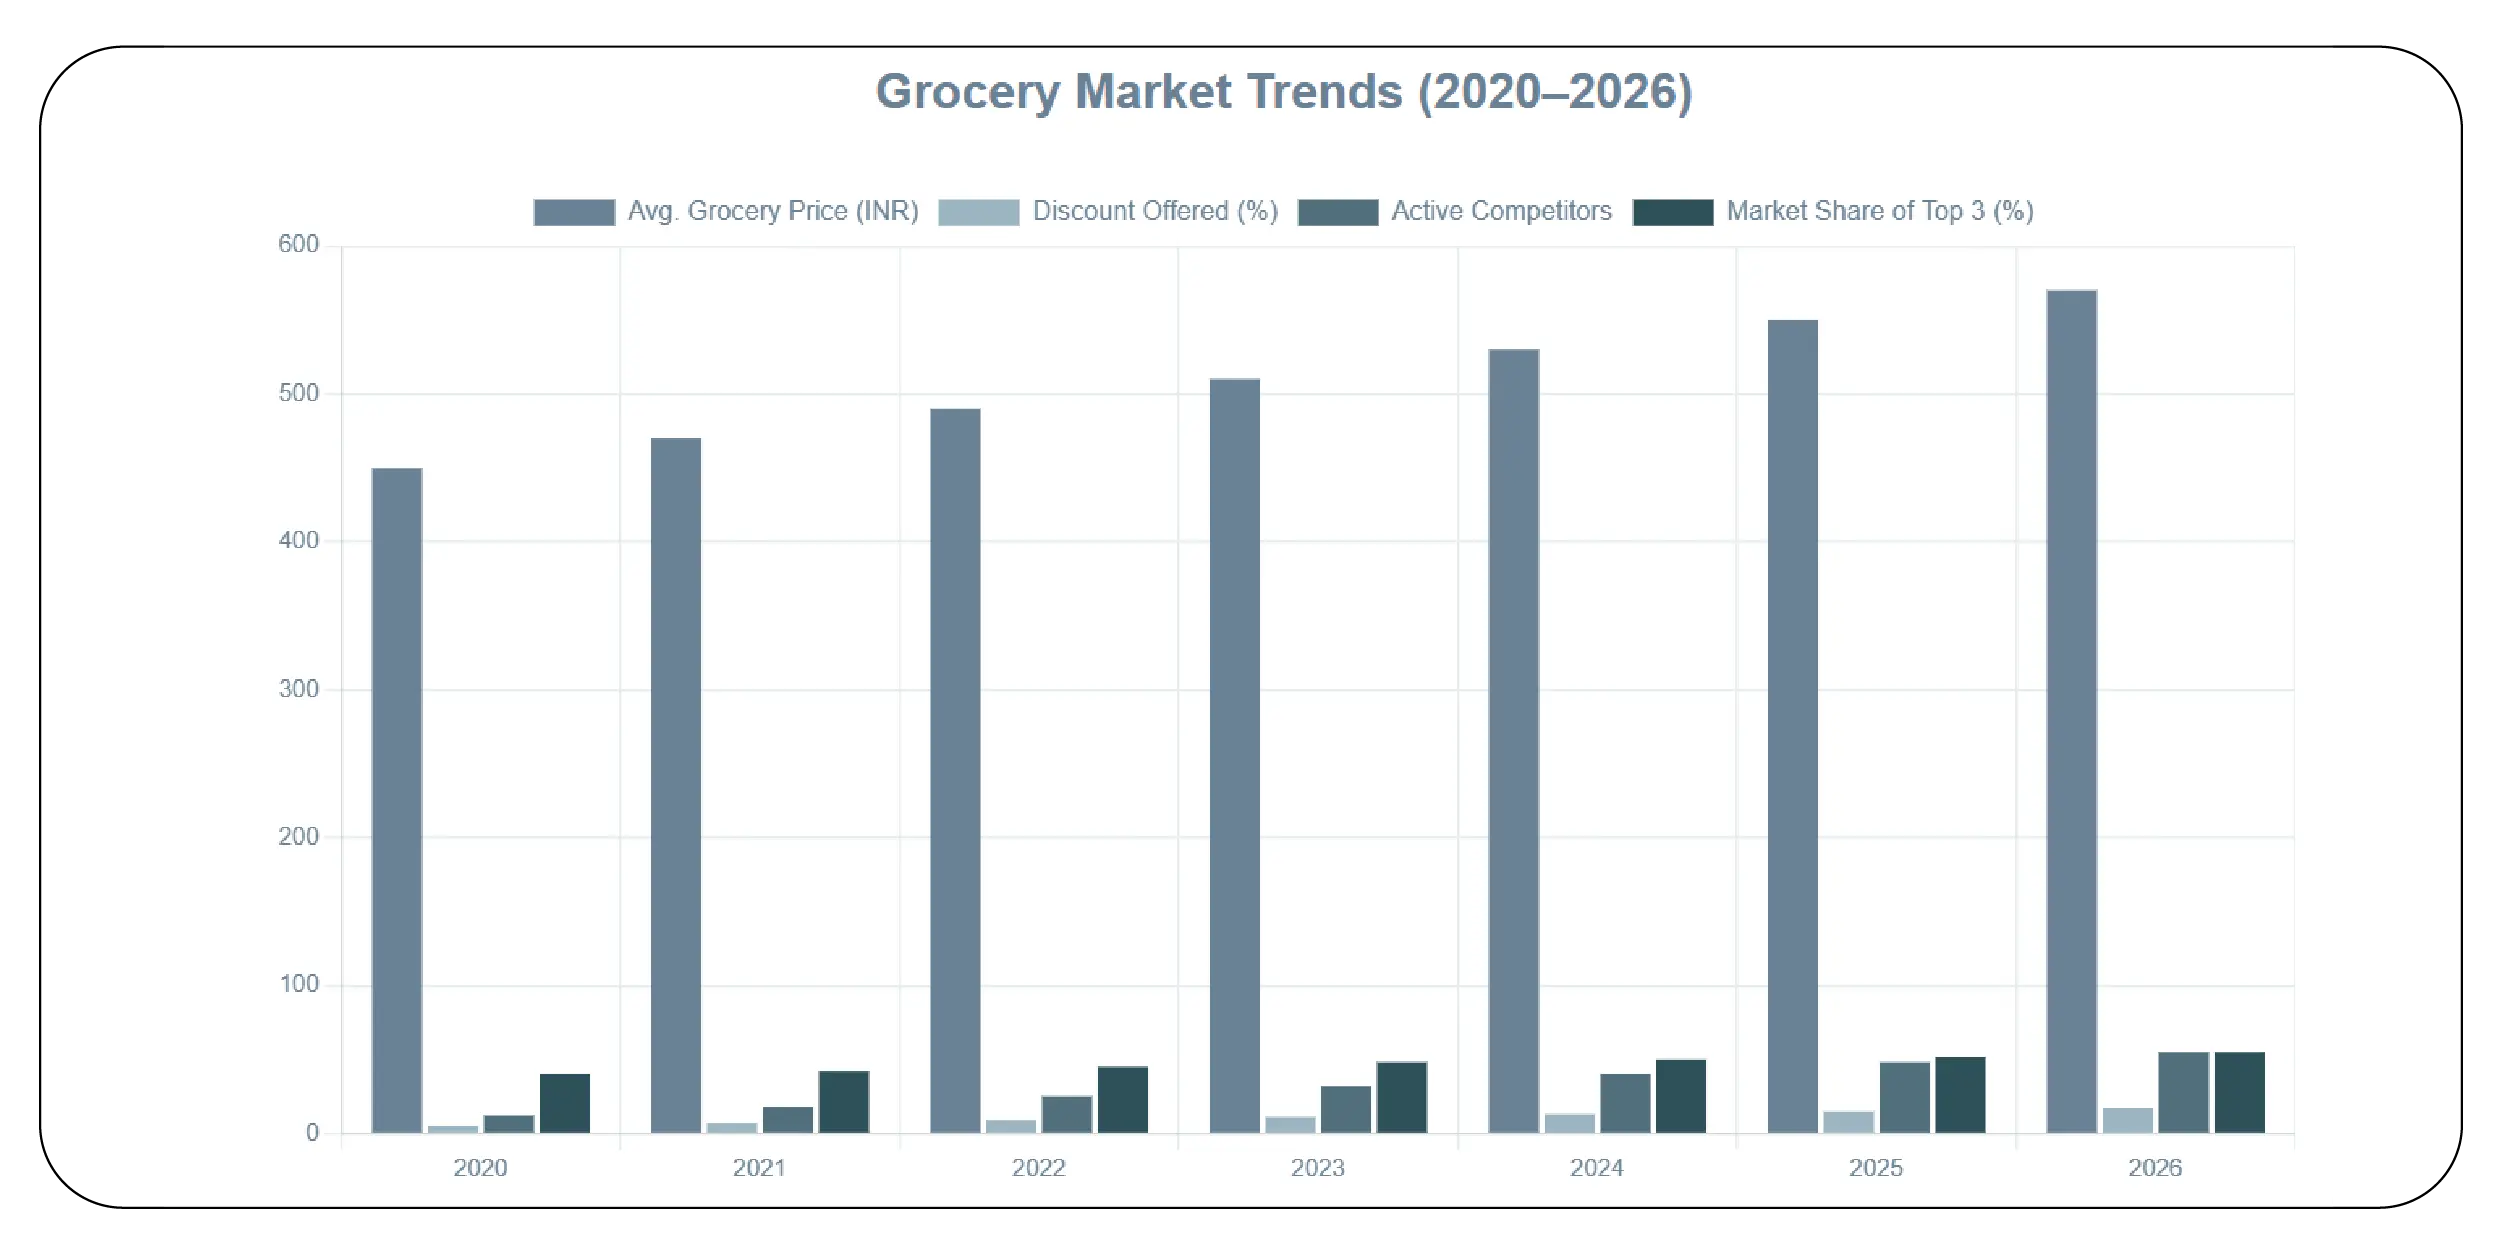
Understanding price trends over time allows businesses to anticipate competitor moves and identify emerging opportunities. Between 2020–2026, average grocery prices in major cities rose steadily, while discount intensity varied based on local demand elasticity.
| Year |
Avg. Grocery Price (INR) |
Discount Offered (%) |
Active Competitors |
Market Share of Top 3 (%) |
| 2020 |
450 |
5 |
12 |
40 |
| 2021 |
470 |
7 |
18 |
42 |
| 2022 |
490 |
9 |
25 |
45 |
| 2023 |
510 |
11 |
32 |
48 |
| 2024 |
530 |
13 |
40 |
50 |
| 2025 |
550 |
15 |
48 |
52 |
| 2026 |
570 |
17 |
55 |
55 |
Insights from Pincode-Level Pricing Trends & Competitive Insights indicate that hyperlocal monitoring allows companies to adjust pricing dynamically, optimize promotional spend, and capture underserved areas before competitors, ensuring sustained growth.
Role of Data Scraping in Market Analysis
Data scraping for grocery and FMCG products provides granular insights into competitor strategies, stock levels, and price fluctuations. By deploying Quick Commerce Grocery & FMCG Data Scraping, businesses can automate the collection of product pricing and promotional data, enabling actionable intelligence.
| Metric |
2020 |
2021 |
2022 |
2023 |
2024 |
2025 |
2026 |
| Products Monitored |
5,000 |
7,500 |
10,000 |
12,500 |
15,000 |
18,000 |
20,000 |
| Pincodes Covered |
50 |
70 |
90 |
110 |
130 |
150 |
175 |
| Price Updates Daily |
1 |
2 |
3 |
3 |
4 |
4 |
5 |
| Competitor Stores Monitored |
12 |
18 |
25 |
32 |
40 |
48 |
55 |
Using Quick Commerce Grocery & FMCG Data Scraping, brands can reduce manual research, detect market gaps, and strategically price products to outperform rivals.
Unlocking Hyperlocal Market Intelligence
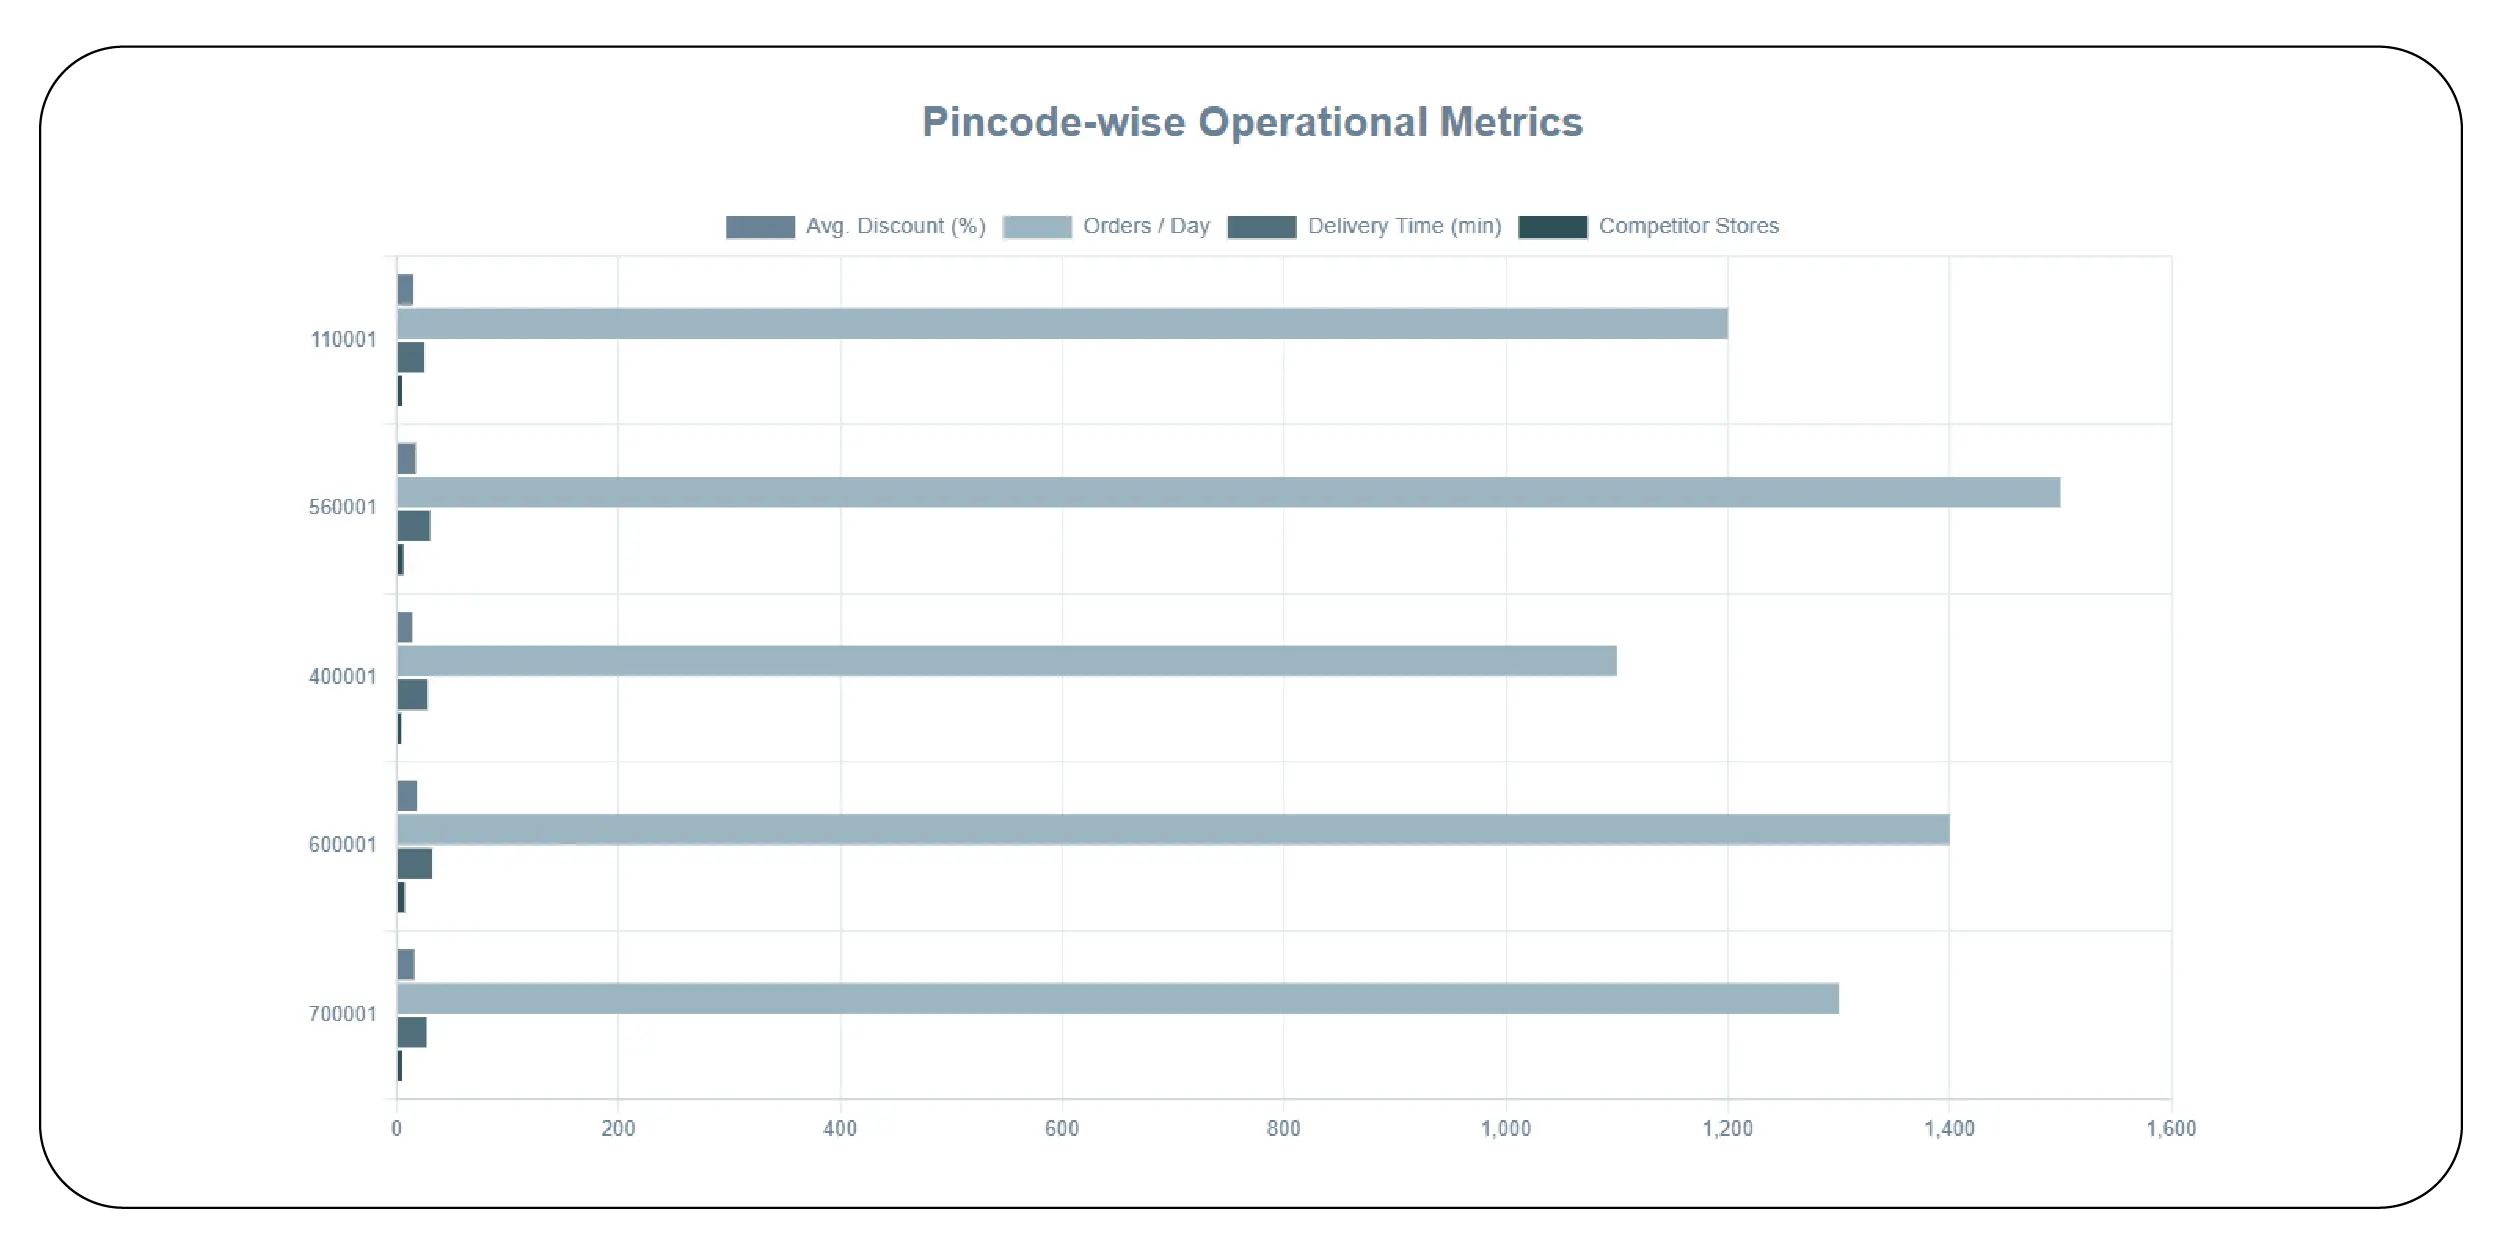
The combination of real-time product data and hyperlocal analytics offers actionable insights to improve delivery efficiency, pricing strategies, and customer retention. Hyperlocal Quick Commerce Grocery Data Scraping empowers businesses to understand trends, monitor competitors, and respond swiftly to market changes.
| Pincode |
Avg. Discount (%) |
Orders/Day |
Delivery Time (min) |
Competitor Stores |
| 110001 |
15 |
1,200 |
25 |
5 |
| 560001 |
17 |
1,500 |
30 |
6 |
| 400001 |
14 |
1,100 |
28 |
4 |
| 600001 |
18 |
1,400 |
32 |
7 |
| 700001 |
16 |
1,300 |
27 |
5 |
By adopting Hyperlocal Quick Commerce Grocery Data Scraping, brands gain a precise understanding of market dynamics at the neighborhood level, enabling optimized pricing, promotions, and inventory deployment.
Investing in Hyperlocal Quick Commerce Grocery Data Scraping is essential for brands looking to maintain a competitive edge. Businesses leveraging product data scrape techniques can track real-time competitor pricing, optimize promotional strategies, and increase ROI.
Additionally, understanding Pincode-Wise Price Wars in Indian Quick Commerce helps companies make data-driven decisions for stock allocation, pricing, and marketing campaigns. By embracing these tools, brands can efficiently penetrate micro-markets and build long-term customer loyalty.
Conclusion
In the rapidly evolving quick commerce ecosystem, leveraging technology like product data scraping and hyperlocal intelligence is no longer optional—it’s critical. Tools like Top Grocery Price Monitoring APIs empower businesses to monitor competitor prices, predict market trends, and make actionable decisions to win Pincode-Wise Price Wars in Indian Quick Commerce.
Stay ahead in hyperlocal markets—integrate advanced data scraping tools today and optimize pricing at the pincode level to maximize growth and profitability.


.webp)


