Introduction
The hospitality landscape in the United States is dynamic, especially when it comes to alcohol
offerings across different states. Consumer demand for localized spirits, beer, and wine
influences how restaurants curate their menus. This report delves into the Scrape Alcohol Menus
from Florida vs. Texas Restaurants, providing a comparative analysis of alcohol offerings,
pricing trends, and promotional strategies. Through advanced scraping methods, businesses can
now derive deep menu insights to tailor their pricing, stocking, and marketing strategies across
these two diverse states.
In this research, we utilize our proprietary Alcohol Menu Scraping Services to examine alcohol
categories, price variations, and discount patterns. The findings offer valuable intelligence
for alcohol brands, restaurant chains, distributors, and market analysts looking to understand
and influence regional consumer behavior.
Web Scraping and Data Extraction Approach
We employed structured Web scraping using Python to extract menu data from over 1,000
restaurants in Florida and Texas. Each menu was parsed for alcoholic categories such as beer,
wine, spirits, and cocktails. Specific attributes captured include:
- Alcohol type
- Brand/variant
- Size/quantity
- Price per serving
- Promotions or happy hour deals
- Food pairings (where available)
Key technologies used:
- BeautifulSoup & Selenium for dynamic content rendering
- Pandas for data cleaning and aggregation
- Python scripts for scheduling and logging
- Proxy rotation to bypass geo-blocks
The project aligns with our service line on Alcohol Menu Data Extraction from
Restaurants, allowing clients to monitor competitor menus at scale.
Market Landscape Overview
Florida and Texas are two of the largest alcohol markets in the U.S., each with
distinct regulatory environments and consumer preferences. While Texas leans heavily on craft
beer and bourbon, Florida exhibits high consumption of tropical cocktails and premium wines.
Table 1: Alcohol Market Overview (2024–2025)
| Metric |
Florida |
Texas |
| Avg. Alcohol Menu Size |
32 items |
36 items |
| Avg. Beer Price (per pint) |
$6.10 |
$6.35 |
| Avg. Wine Price (per glass) |
$9.20 |
$8.70 |
| Cocktail Price Range |
$10 – $17 |
$9 – $16 |
| Happy Hour Participation Rate |
78% |
64% |
| Most Common Alcohol Type |
Wine & Cocktails |
Beer & Whiskey |
Outcome
The Florida vs Texas Alcohol Menu Comparison Dataset reveals that while Texas
menus are slightly more extensive, Florida menus offer higher pricing for wine and cocktails,
indicating a more premium pricing strategy.
Menu Insights and Pricing Trends
Beer and Wine Comparison
The Compare Wine and Beer Menus in Texas vs. Florida section of the study
highlights notable trends:
- Texas shows a 60% higher presence of regional craft beers than Florida.
- Florida menus favor imported wines and tropical blends in cocktails.
- Texas restaurants frequently include beer flights and whiskey samplers.
Table 2: Wine and Beer Presence by Region
| Category |
Florida (% of menus) |
Texas (% of menus) |
| Domestic Beer |
85% |
92% |
| Craft Beer |
45% |
72% |
| Red Wine |
63% |
57% |
| White Wine |
68% |
54% |
| Beer Flights |
25% |
49% |
Outcome
Texas restaurants use diverse beer offerings as a pricing and branding tool,
while Florida emphasizes imported wines to maintain a luxury appeal.
Promotions and Discount Strategy
Using our capabilities to Extract Alcohol Discounts and Promotions Data, we
found that:
- Florida has more "Buy 1 Get 1" cocktail promotions tied to beach/resort
tourism.
- Texas runs more seasonal promotions for beers during sports events and
holidays.
- Texas menus list discounts on whiskey-based drinks 34% more frequently than
Florida.
Table 3: Discount Strategy Trends
| Discount Type |
Florida Usage Rate |
Texas Usage Rate |
| Happy Hour Pricing |
70% |
63% |
| Combo (Food + Drink) Offers |
42% |
38% |
| Seasonal Promotions |
29% |
54% |
| Loyalty Member Drink Discounts |
12% |
19% |
Outcome
The ability to Extract Restaurant Menus Serving Alcohol with embedded discounts
gives F&B operators a competitive edge in customizing location-specific offers.
Alcohol Category Deep Dive
From scraping alcohol menu categories, the dataset uncovered the following
breakdown:
Table 4: Alcohol Type Presence in Menus
| Alcohol Type |
Florida (% of menus) |
Texas (% of menus) |
| Beer |
92% |
97% |
| Wine |
85% |
81% |
| Whiskey |
43% |
67% |
| Vodka |
64% |
55% |
| Rum |
58% |
48% |
| Tequila |
52% |
61% |
Outcome
The trend shows Texas is heavier on brown spirits (whiskey, tequila), while
Florida leans toward clear spirits and fruity combinations.
This breakdown supports regional stocking strategies and informs product
placement decisions.
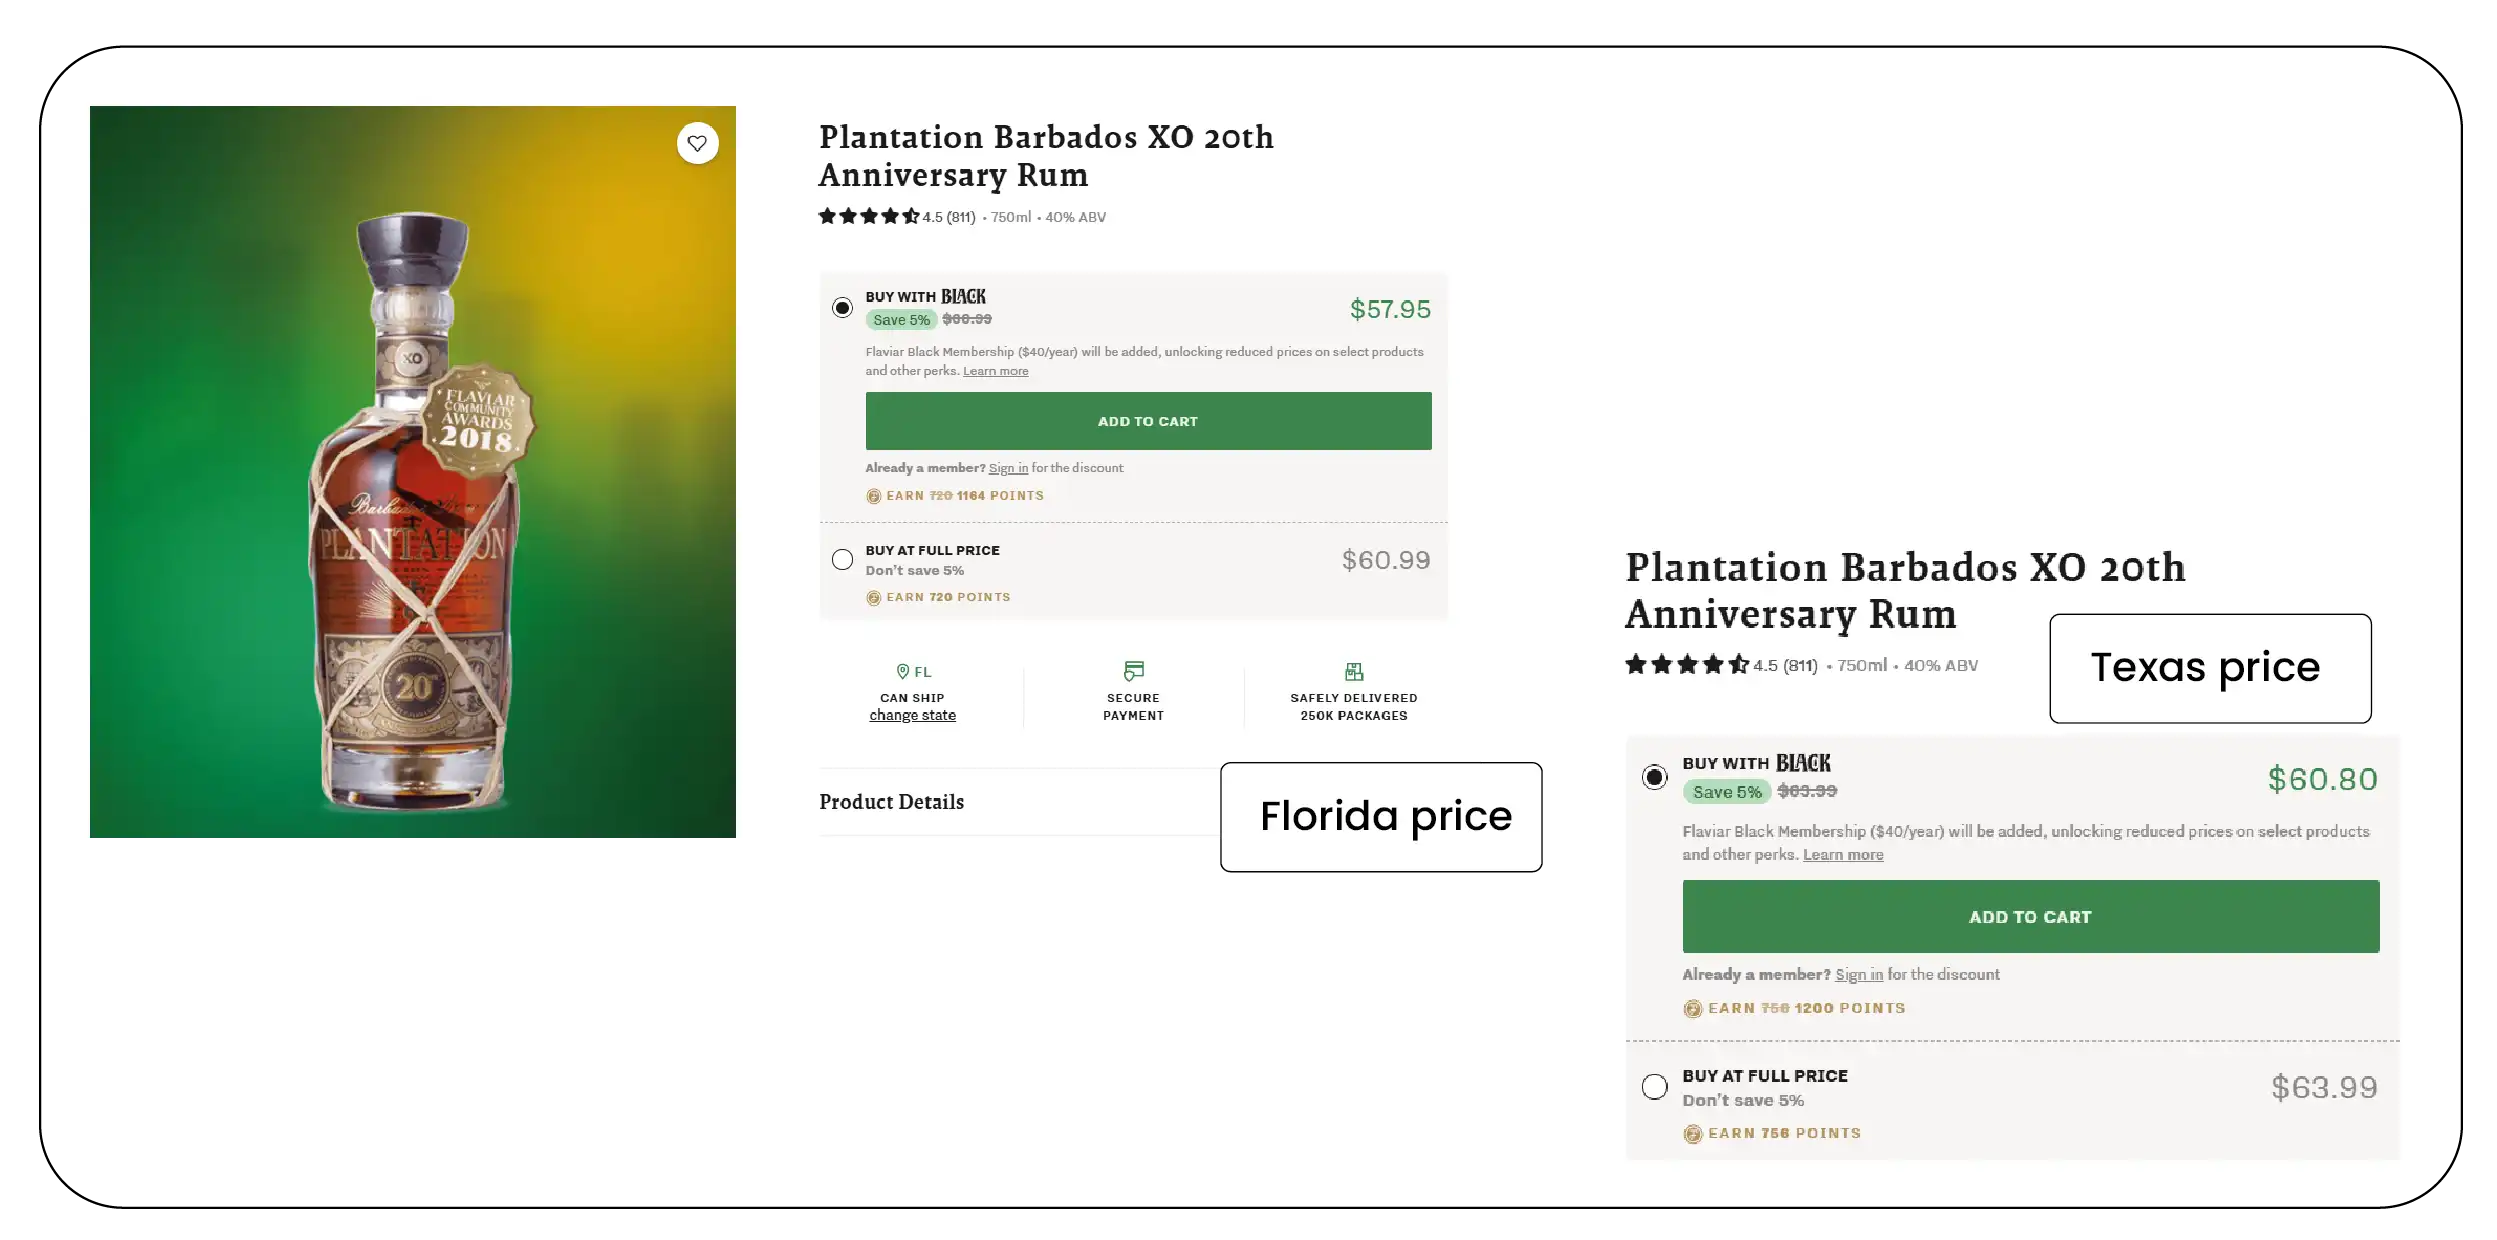
Pricing Analytics & Monitoring
With Alcohol Price Monitoring with Web Scraping , we analyzed per-item price
variation across both states. Our tools allow clients to automate real-time alerts on price
changes.
| Alcohol Type |
Florida (% of menus) |
Texas (% of menus) |
| Beer |
92% |
97% |
| Wine |
85% |
81% |
| Whiskey |
43% |
67% |
| Vodka |
64% |
55% |
| Rum |
58% |
48% |
| Tequila |
52% |
61% |
Outcome
The trend shows Texas is heavier on brown spirits (whiskey, tequila), while
Florida leans toward clear spirits and fruity combinations.
This breakdown supports regional stocking strategies and informs product
placement decisions.
Pricing Analytics & Monitoring
With Alcohol Price Monitoring with Web Scraping, we analyzed per-item price
variation across both states. Our tools allow clients to automate real-time alerts on price
changes.
Table 5: Average Price Comparison by Alcohol Type (USD)
| Alcohol Type |
Florida (avg. price) |
Texas (avg. price) |
| Beer |
$6.10 |
$6.35 |
| Wine |
$9.20 |
$8.70 |
| Cocktails |
$13.50 |
$12.80 |
| Whiskey |
$11.20 |
$10.90 |
| Rum Drinks |
$10.50 |
$9.95 |
Outcome
While Texas menus offer more competitive pricing, Florida’s higher pricing
aligns with tourism-driven premium positioning.
This insight reinforces the value of Alcohol and Liquor Price Data Scraping to
help alcohol brands optimize pricing by region.
Web Scraping Liquor Menus by U.S. State
For brands entering new markets or expanding regionally, Web Scraping Liquor
Menus by U.S. State enables the extraction of SKU-level alcohol data segmented by city, region,
or establishment type. In this project, we also identified menu trends across:
- Miami, Tampa, Orlando vs. Dallas, Austin, Houston
- Urban vs. suburban menu variation
- Chain vs. independent restaurant menu depth
This multi-city data supports state-level rollout strategies for alcohol
brands, distributors, and franchise operators.
Key Takeaways
- Scrape Alcohol Menus from Florida vs. Texas Restaurants enables precise
menu intelligence that aids pricing, promotions, and product mix planning.
- Alcohol serving restaurants in Florida vs Texas menu insights demonstrate
how regional demand and pricing strategies vary greatly across the two states.
- Businesses leveraging Alcohol Menu Scraping Services can track competitor
offerings and optimize inventory in real-time.
- Alcohol menu trends are highly influenced by regional culture, tourism,
and local sports/events.
- Texas dominates in craft beer and whiskey promotions, while Florida leads
in premium wine and cocktail pricing.
Conclusion
Understanding the alcohol menu landscape in Florida and Texas through advanced scraping methodologies equips stakeholders with actionable insights. Whether it's refining pricing models, launching localized alcohol products, or tailoring discounts, this research underscores the power of granular alcohol menu data.
By leveraging our robust solutions for Scrape Alcohol Menus from Florida vs. Texas Restaurants, you gain competitive advantages in one of the most lucrative sectors of U.S. hospitality.
Ready to get real-time alcohol menu data across U.S. states? Contact Product Data Scrape today to unlock alcohol pricing insights, discount tracking, and menu analytics at scale.