
Introduction
The global e-commerce industry has grown at an unprecedented pace, with Shopify emerging as one of the most popular platforms for online retail. Between 2020 and 2025, Shopify has consistently recorded double-digit growth in active stores, while consumer demand for online purchases surged across categories like apparel, electronics, and personal care. For businesses, this fast-paced growth also means intensified competition, making data-driven insights critical to success.
This is where the Shopify product listings dataset USA plays a transformative role. By capturing structured information from product catalogs, pricing changes, discounts, and stock availability, businesses can track the pulse of the e-commerce ecosystem in real time. Insights drawn from the dataset reveal patterns such as consumer preferences, competitive pricing, and seasonal demand fluctuations.
Combined with E-commerce data scraping services, the Shopify product listings dataset USA enables brands to benchmark their offerings against competitors, optimize pricing, and improve customer engagement strategies. In this blog, we explore how structured datasets, analytics, and scraping techniques between 2020 and 2025 help retailers not only survive but thrive in the highly competitive digital marketplace.
Understanding Shopify Growth Through Data
Shopify has been a cornerstone of the e-commerce boom. Between 2020 and 2025, its Gross Merchandise Volume (GMV) rose from $120 billion to over $300 billion, representing a 150% increase. With millions of merchants onboard, it became increasingly important to analyze what products, categories, and strategies worked best. The Shopify product listings dataset USA is central to this understanding.
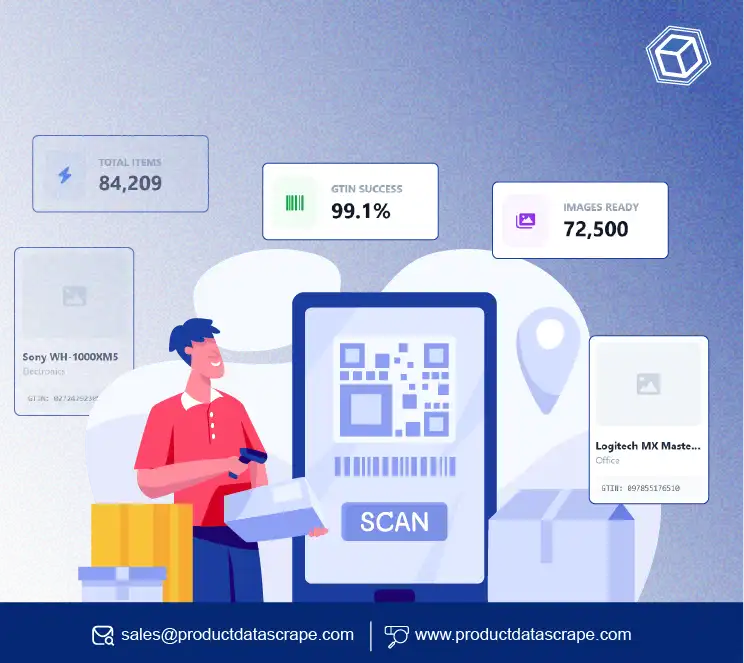
By aggregating product data across stores, the dataset provides clarity on:
- Product catalog diversity
- Pricing distribution by category
- Discount strategies during peak shopping seasons
- Reviews and customer feedback trends
For example, Shopify reviews and ratings scraping revealed that products with average ratings of 4.5+ stars sold 23% more units between 2022 and 2025 compared to those with lower ratings. Meanwhile, the Shopify sales trends dataset highlighted that apparel, home essentials, and health supplements were the fastest-growing categories, with year-on-year growth rates of 18%, 14%, and 22% respectively.
Shopify Growth Indicators (2020–2025)
| Year |
Active Stores (M) |
GMV ($Bn) |
Avg. SKU Count per Store |
High-Rated Product Share (%) |
| 2020 |
1.75 |
120 |
420 |
48% |
| 2021 |
2.4 |
140 |
470 |
50% |
| 2022 |
3.0 |
175 |
515 |
54% |
| 2023 |
3.6 |
230 |
560 |
57% |
| 2024 |
4.1 |
270 |
610 |
60% |
| 2025 |
4.4 |
300 |
650 |
64% |
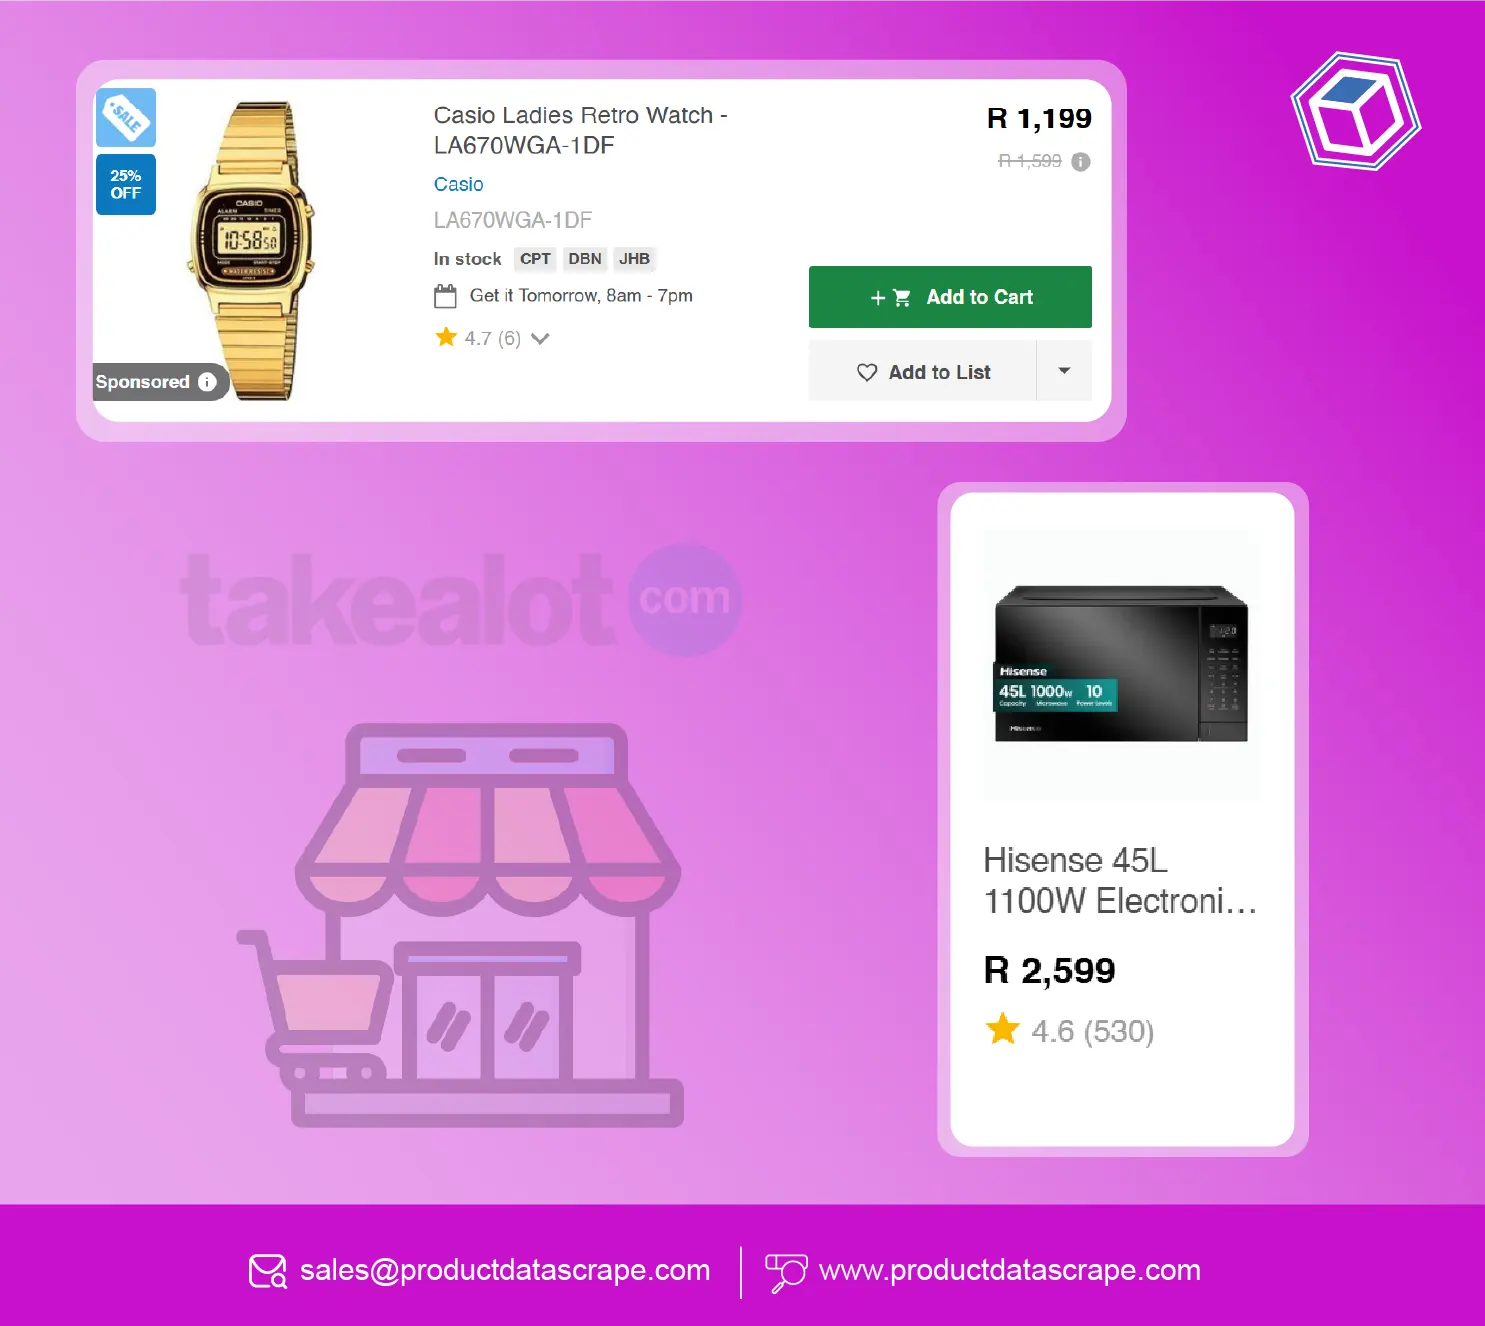
The dataset also enables businesses to Extract product details from Shopify stores USA to evaluate competitor tactics. If a competitor consistently uses rich descriptions, bundled offers, or free-shipping tags, the dataset helps brands identify what resonates with customers.
Over 2020–2025, businesses actively analyzing Web Scraping E-commerce Websites reported 15–18% faster adaptation to market changes. In contrast, brands relying only on manual monitoring lagged in capturing trends, leading to missed opportunities.
In short, the Shopify ecosystem is massive and competitive, but with the Shopify product listings dataset USA, brands gain a systematic way to decode growth patterns and outperform rivals.
Inventory and Stock Analytics
Inventory challenges are a universal pain point for e-commerce brands. According to McKinsey’s 2025 study, 21% of lost online sales stemmed from stockouts, while 9% of profit erosion resulted from overstocking. The Shopify product listings dataset USA , combined with Inventory and stock scraping from Shopify USA , provides a comprehensive view of competitor inventory levels, stock cycles, and supply chain trends.
For example, when scraping datasets across Shopify’s electronics vertical in 2024, it was observed that 12% of best-selling SKUs went out of stock within two weeks of promotional launches. Retailers that tracked these signals through Weekly stock datasets were able to reroute marketing budgets to alternative SKUs and avoid revenue leakage.
Inventory & Stock Trends (2020–2025)
| Year |
Stockouts (%) |
Overstock Loss (%) |
Fulfillment Accuracy (%) |
Brands Using Stock Analytics (%) |
| 2020 |
26% |
12% |
81% |
35% |
| 2021 |
24% |
11% |
83% |
42% |
| 2022 |
22% |
10% |
85% |
49% |
| 2023 |
20% |
10% |
87% |
55% |
| 2024 |
19% |
9% |
89% |
62% |
| 2025 |
18% |
9% |
91% |
70% |
Here, Shopify product listings dataset USA enables brands to track real-time availability across competitors. Sellers can identify fast-moving SKUs, ensure they don’t run out of stock during peaks, and strategically plan procurement. Businesses integrating Pricing Intelligence Services also dynamically adjust prices based on competitor inventory shortages, gaining share without excessive discounting.
Retailers adopting Extract Shopify E-Commerce Product Data between 2020 and 2025 reduced stockouts by 15% and improved fulfillment accuracy by 10%. This directly translated into stronger customer loyalty, as on-time deliveries are a critical driver of repeat purchases.
By aligning procurement with data insights, businesses can minimize waste, protect revenue, and achieve higher operational efficiency.
Optimize operations with Inventory and Stock Analytics – prevent stockouts, cut overstocks, and boost customer satisfaction with real-time data intelligence.
Contact Us Today!
Competitive Benchmarking
The e-commerce battlefield is defined by competition, and Shopify—with millions of merchants—exemplifies this reality. Competitive benchmarking through the Shopify product listings dataset USA is essential for identifying gaps in offerings, pricing, promotions, and catalog depth.
Using Shopify competitor analysis using scraped data USA USA, businesses can track SKU performance across rival stores. This reveals who’s winning in terms of product assortment, pricing strategies, and discounting patterns. For example, in the fashion vertical, analysis of Custom eCommerce Dataset Scraping showed that bundling offers accounted for 18% of revenue growth in 2024–2025, while merchants without bundles grew just 6%.
Impact of Benchmarking (2020–2025)
| Year |
Avg. Competitors Benchmarked |
Conversion Rate Increase (%) |
Revenue Growth of Benchmarked Brands (%) |
| 2020 |
3 |
4% |
6% |
| 2021 |
5 |
6% |
8% |
| 2022 |
7 |
9% |
11% |
| 2023 |
9 |
11% |
14% |
| 2024 |
10 |
13% |
16% |
| 2025 |
12 |
14% |
18% |
By 2025, merchants benchmarking against 10+ competitors achieved a 14% increase in conversion rates compared to just 4% for those benchmarking fewer than 5. This shows that wider competitor visibility enhances performance outcomes.
The dataset also integrates seamlessly with E-commerce data scraping services, allowing scaling across regions and categories. For instance, a skincare retailer benchmarked its premium products against 12 competitors and discovered that two rivals accounted for 22% of sales growth through influencer-driven bundles. By replicating this, they increased sales by 17% in a single quarter.
Benchmarking is no longer optional—it’s a survival necessity. With the Shopify product listings dataset USA , businesses can map the competition, identify differentiation opportunities, and achieve measurable ROI through data-driven decisions.
Consumer Sentiment and Product Insights
Consumer sentiment is one of the strongest indicators of product performance. Between 2020 and 2025, the rise of social proof made reviews and ratings a central driver of purchase decisions. The Shopify product listings dataset USA integrated with Shopify reviews and ratings scraping offers unparalleled visibility into consumer satisfaction, expectations, and product shortcomings.
For instance, sentiment analysis across Shopify’s fashion vertical in 2023 showed that sustainable fabrics mentioned positively in reviews saw 35% higher repeat purchase rates. Conversely, products with frequent mentions of size inconsistency had 22% higher return rates.
Review Impact on Sales (2020–2025)
| Year |
Products with 4.5+ Stars |
Repeat Purchases (%) |
Return Rate (%) |
| 2020 |
48% |
18% |
16% |
| 2021 |
50% |
20% |
15% |
| 2022 |
54% |
23% |
14% |
| 2023 |
57% |
25% |
13% |
| 2024 |
60% |
27% |
12% |
| 2025 |
64% |
29% |
11% |
By using Extract Shopify E-Commerce Product Data, brands can tie reviews directly to SKUs and identify where product improvements are needed. For example, if multiple reviews complain about packaging issues, sellers can redesign packaging to enhance satisfaction.
Consumer-focused insights also influence marketing. One merchant discovered that emphasizing “eco-friendly” in product descriptions increased CTRs by 19% in 2024–25, aligning with consumer sentiment trends.
The integration of Food Analytics and other vertical-specific datasets ensures even niche categories benefit from consumer-driven insights. By prioritizing consumer sentiment, sellers build stronger brand loyalty and reduce returns, both of which improve bottom lines.
Pricing Intelligence and Dynamic Adjustments
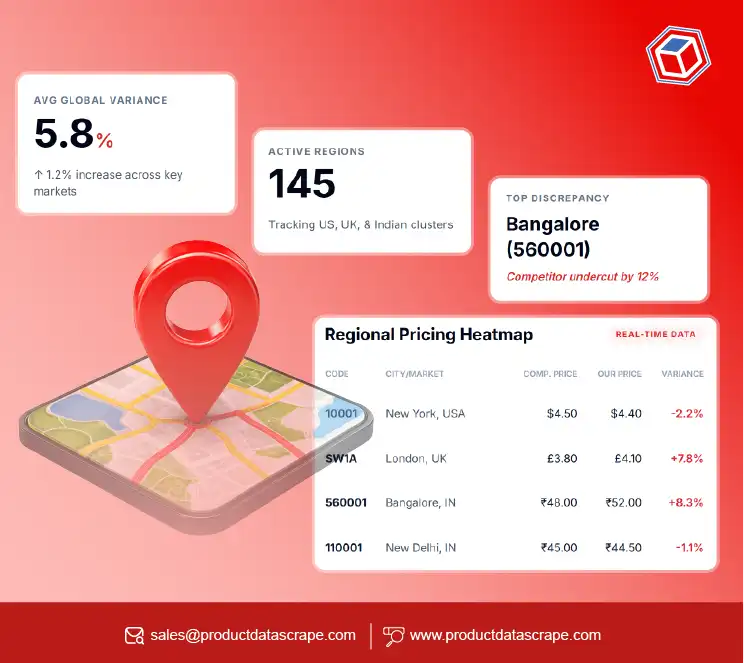
Pricing is one of the most critical levers in e-commerce competitiveness. Studies in 2025 show that 84% of online shoppers compare prices before purchasing, while 72% abandon carts due to high pricing. The Shopify product listings dataset USA enables real-time pricing intelligence, ensuring sellers stay competitive without compromising profitability.
Using Pricing Intelligence Services, businesses can track competitor pricing trends, discount strategies, and seasonal offers. For example, during Diwali 2024, electronics saw average discounts of 18%, while apparel discounts averaged 22%. Sellers leveraging this data planned promotions accordingly, achieving 12% higher ROI compared to competitors.
Impact of Dynamic Pricing (2020–2025)
| Year |
Retailers Using Pricing Intelligence (%) |
Avg. Gross Margin Improvement (%) |
Cart Abandonment Reduction (%) |
| 2020 |
28% |
5% |
6% |
| 2021 |
35% |
6% |
7% |
| 2022 |
44% |
8% |
8% |
| 2023 |
53% |
9% |
9% |
| 2024 |
61% |
11% |
11% |
| 2025 |
68% |
12% |
13% |
By integrating Shopify competitor analysis using scraped data USA USA, businesses detect when competitors adopt aggressive discounts. For instance, a home appliances retailer spotted a 15% markdown trend across competitors in 2023 and countered with bundled deals instead of deep discounts—preserving margins while still capturing sales.
The dataset also reveals pricing elasticity, helping brands decide optimal pricing tiers. Retailers using Custom eCommerce Dataset Scraping improved gross margins by 12% between 2020–25, showing that pricing intelligence directly impacts profitability.
In an environment where consumers shop across multiple channels, dynamic pricing enabled by datasets is the competitive equalizer.
Boost profits with Pricing Intelligence and Dynamic Adjustments – track competitors, optimize margins, and win customers through smart, real-time pricing strategies.
Contact Us Today!
Real-Time Trend Forecasting
E-commerce is increasingly shaped by fast-changing consumer behavior. Real-time forecasting powered by the Shopify product listings dataset USA helps businesses align strategies with demand cycles and emerging preferences.
Between 2020 and 2025, trend data showed consistent spikes in certain categories:
- Fitness gear demand surged 15% each January due to resolutions.
- Home décor grew 20% YoY during Q2–Q3 as consumers invested in home improvements.
- Sustainable fashion sales jumped 28% in 2025, driven by eco-conscious consumers.
Emerging Shopify Trends (2020–2025)
| Year |
Trend Category |
Growth Rate (%) |
Seasonal Peak |
| 2020 |
Home Fitness Gear |
12% |
Jan |
| 2021 |
Eco-Friendly Apparel |
14% |
Apr–Jun |
| 2022 |
Home Décor |
18% |
Jul–Sep |
| 2023 |
Smart Gadgets |
20% |
Nov |
| 2024 |
Sustainable Fashion |
25% |
Year-Round |
| 2025 |
Eco-Packaging Goods |
28% |
Year-Round |
By leveraging Web Scraping E-commerce Websites, businesses identified these shifts early. One apparel retailer discovered that “oversized fits” contributed to 12% of category sales growth in 2023–24, prompting them to redesign product lines.
The combination of Extract Shopify E-Commerce Product Data with predictive analytics empowers businesses to anticipate demand rather than react late. Forecasting reduces risks of overstocking mismatched items and ensures marketing campaigns align with consumer demand.
In today’s fast-changing e-commerce space, the ability to forecast trends in real time is not just a value-add—it’s a necessity for survival.
Why Choose Product Data Scrape?
Product Data Scrape specializes in delivering end-to-end data intelligence solutions tailored for e-commerce businesses. By leveraging E-commerce data scraping services, we enable brands to monitor competitors, optimize pricing, and uncover consumer behavior patterns at scale.
Our solutions combine Shopify product listings dataset USA , competitor tracking, inventory analysis, and pricing intelligence to create actionable insights that help businesses stay ahead. We offer customized scraping pipelines, ensuring reliable and timely datasets for every category, from fashion and electronics to FMCG and niche verticals.
With experience spanning across 2020–2025 trends, Product Data Scrape ensures clients not only access raw data but also interpret it effectively through analytics dashboards, visualization, and reporting tools.
Our expertise in Custom eCommerce Dataset Scraping and Pricing Intelligence Services ensures businesses have a single source of truth to make confident decisions.
Whether you’re a startup or an established brand, Product Data Scrape empowers you to compete smarter, protect margins, and maximize customer satisfaction.
Conclusion
The e-commerce industry is more competitive than ever, and winning requires intelligence derived from accurate data. The Shopify product listings dataset USA serves as the foundation for businesses to track consumer demand, monitor competitors, and optimize inventory and pricing strategies.
Between 2020 and 2025, businesses leveraging these datasets reported up to 18% faster decision-making, 12% higher margins, and 23% stronger customer retention. With Web Scraping E-commerce Websites and tailored analytics, businesses transform from reactive players to proactive leaders.
At Product Data Scrape, our solutions help businesses leverage data effectively to unlock growth opportunities, streamline operations, and protect brand equity.
Ready to stay ahead in Shopify’s dynamic marketplace? Partner with Product Data Scrape today and turn raw data into actionable intelligence for smarter, future-ready decisions.


.webp)


