
Introduction
California represents one of the most competitive alcohol retail markets in the United States, with constant price fluctuations driven by promotions, regional demand, seasonal consumption, and regulatory dynamics. Retailers like BevMo operate in a high-frequency pricing environment where real-time visibility into market movements is critical for maintaining competitiveness and margins.
This research report presents a comprehensive analysis of BevMo California Market Price Benchmarking, powered by structured retail intelligence and long-term price monitoring. Using an extensive Alcohol and Liquor Dataset, Product Data Scrape analyzed historical and projected price movements across multiple alcohol categories, including wine, spirits, beer, and ready-to-drink beverages.
The report examines SKU-level pricing trends, category-wise inflation patterns, discount behaviors, and regional variations across California from 2020 to 2026. Designed for retailers, distributors, and brand managers, this report demonstrates how data-driven benchmarking enables smarter pricing decisions, competitive positioning, and revenue optimization in a rapidly evolving retail landscape.
Shifts in Retail Pricing Dynamics Across California
California’s alcohol retail market has undergone significant transformation since 2020. Pandemic-driven demand spikes were followed by supply chain disruptions, cost inflation, and evolving consumer preferences. Using the BevMo California price benchmarking dataset, Product Data Scrape applied advanced Price Data Scraping Services to track category-wise pricing trends across urban and suburban locations.
Average Price Index Trend (2020–2026)
.webp)
| Year |
Wine Index |
Spirits Index |
Beer Index |
| 2020 |
100 |
100 |
100 |
| 2021 |
104 |
106 |
103 |
| 2022 |
111 |
115 |
108 |
| 2023 |
118 |
124 |
113 |
| 2024 |
123 |
131 |
118 |
| 2025 |
127 |
137 |
122 |
| 2026 |
132 |
145 |
128 |
Price volatility increased post-2022, especially in premium spirits, driven by logistics costs and brand-driven pricing strategies. Wine prices showed moderate stability, while beer pricing remained relatively elastic due to high competition. These trends highlight the importance of continuous benchmarking to anticipate margin pressure and promotional windows.
Category-Level Competitive Price Extraction
To understand category competitiveness, Product Data Scrape implemented automated pipelines to Scrape BevMo California liquor prices for benchmarking and Extract BevMo! Alcohol and Liquor Price Data across thousands of SKUs.
Average Category Price ($) – 2020–2026
| Year |
Wine |
Whiskey |
Vodka |
Beer |
| 2020 |
14.8 |
29.5 |
18.9 |
10.4 |
| 2021 |
15.3 |
31.2 |
19.6 |
10.9 |
| 2022 |
16.4 |
33.8 |
21.1 |
11.5 |
| 2023 |
17.9 |
36.7 |
22.8 |
12.1 |
| 2024 |
18.6 |
38.9 |
23.7 |
12.8 |
| 2025 |
19.3 |
41.2 |
24.9 |
13.4 |
| 2026 |
20.1 |
44.0 |
26.3 |
14.1 |
Spirits consistently showed the steepest price growth, particularly in whiskey and tequila segments. Beer pricing reflected slower increases due to private-label competition and promotional bundling. Category-level benchmarking helped identify pricing elasticity and optimize assortment strategies.
Premiumization Trends in Wine and Spirits
Consumer preferences in California increasingly favor premium and craft alcohol products. Product Data Scrape leveraged a wine & spirits pricing benchmark scraper For BevMo to isolate premium SKUs and analyze long-term pricing behavior.
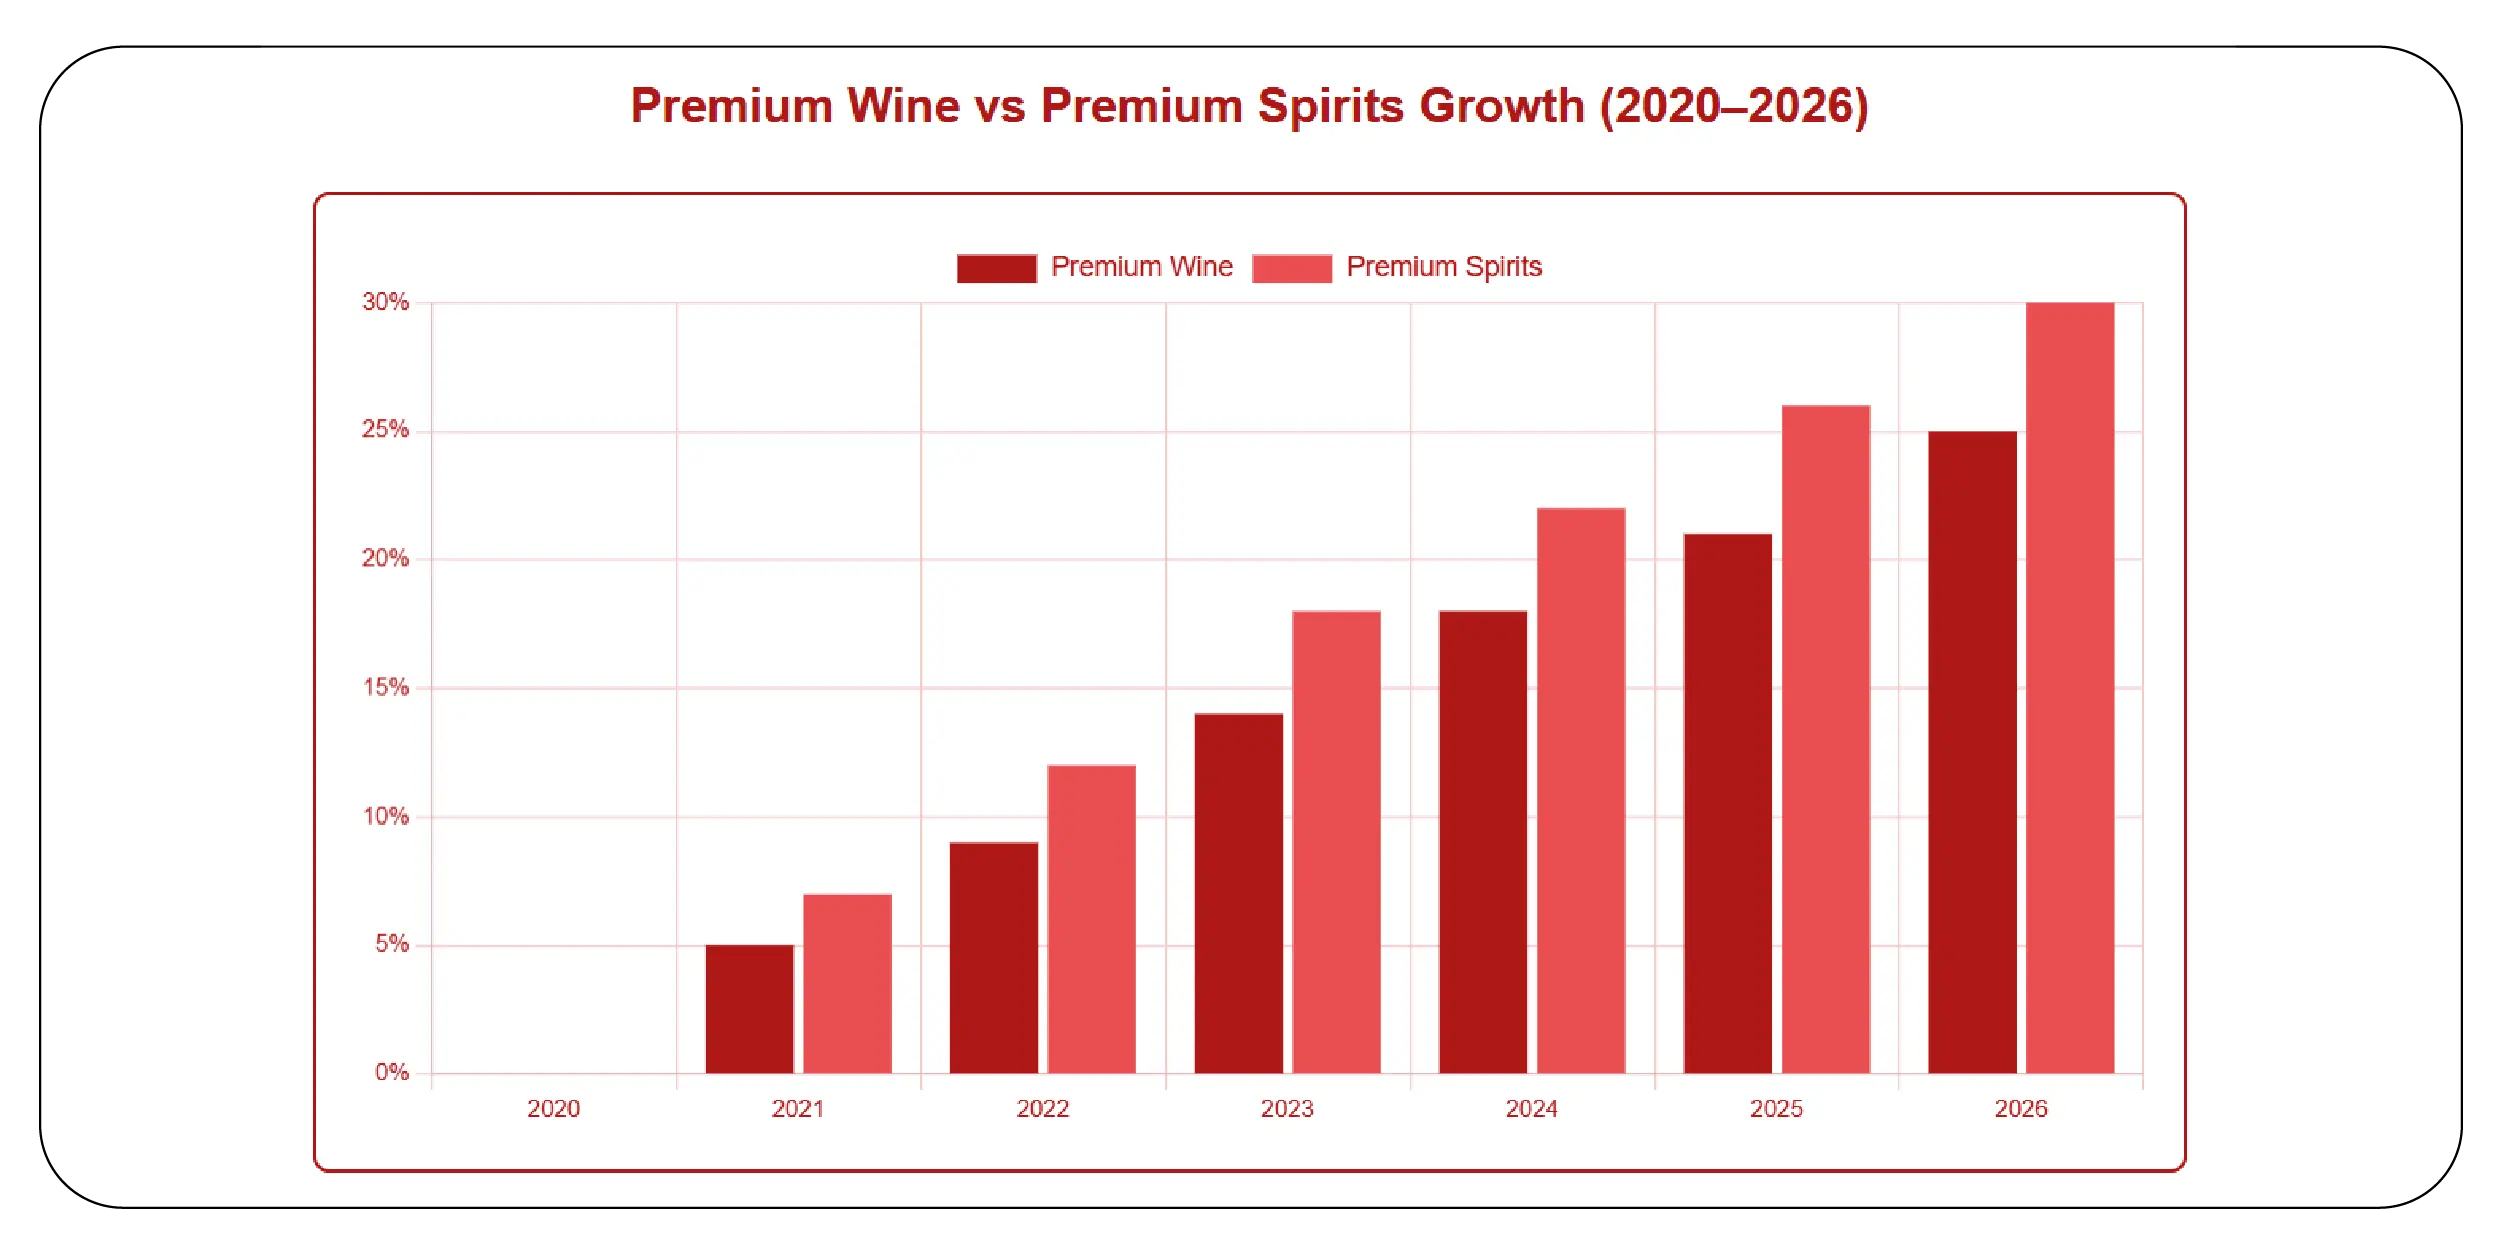
Premium SKU Price Growth (%)
| Year |
Premium Wine |
Premium Spirits |
| 2020 |
0% |
0% |
| 2021 |
+5% |
+7% |
| 2022 |
+9% |
+12% |
| 2023 |
+14% |
+18% |
| 2024 |
+18% |
+22% |
| 2025 |
+21% |
+26% |
| 2026 |
+25% |
+30% |
Premium spirits outpaced wine growth due to brand storytelling, limited editions, and higher willingness to pay. Retailers using benchmark insights could align promotions with premium demand cycles and avoid underpricing high-margin SKUs.
Regional Pricing Variations Within California
Regional pricing differences play a critical role in localized pricing strategies. By analyzing BevMo liquor pricing data scraped in California, Product Data Scrape identified pricing gaps between metro and non-metro regions.
Average Regional Price Index (2024)
| Region |
Price Index |
| Los Angeles |
128 |
| San Francisco Bay Area |
135 |
| San Diego |
124 |
| Sacramento |
119 |
| Inland California |
112 |
Urban centers consistently showed higher prices due to rent, demand density, and premium SKU penetration. Regional benchmarking enabled retailers to align pricing with local purchasing power and competitive intensity.
SKU-Level Benchmarking for Competitive Advantage
Granular SKU analysis remains the foundation of actionable price intelligence. Product Data Scrape enabled brands to use BevMo SKU-level price benchmarking to monitor exact product-level movements across categories.
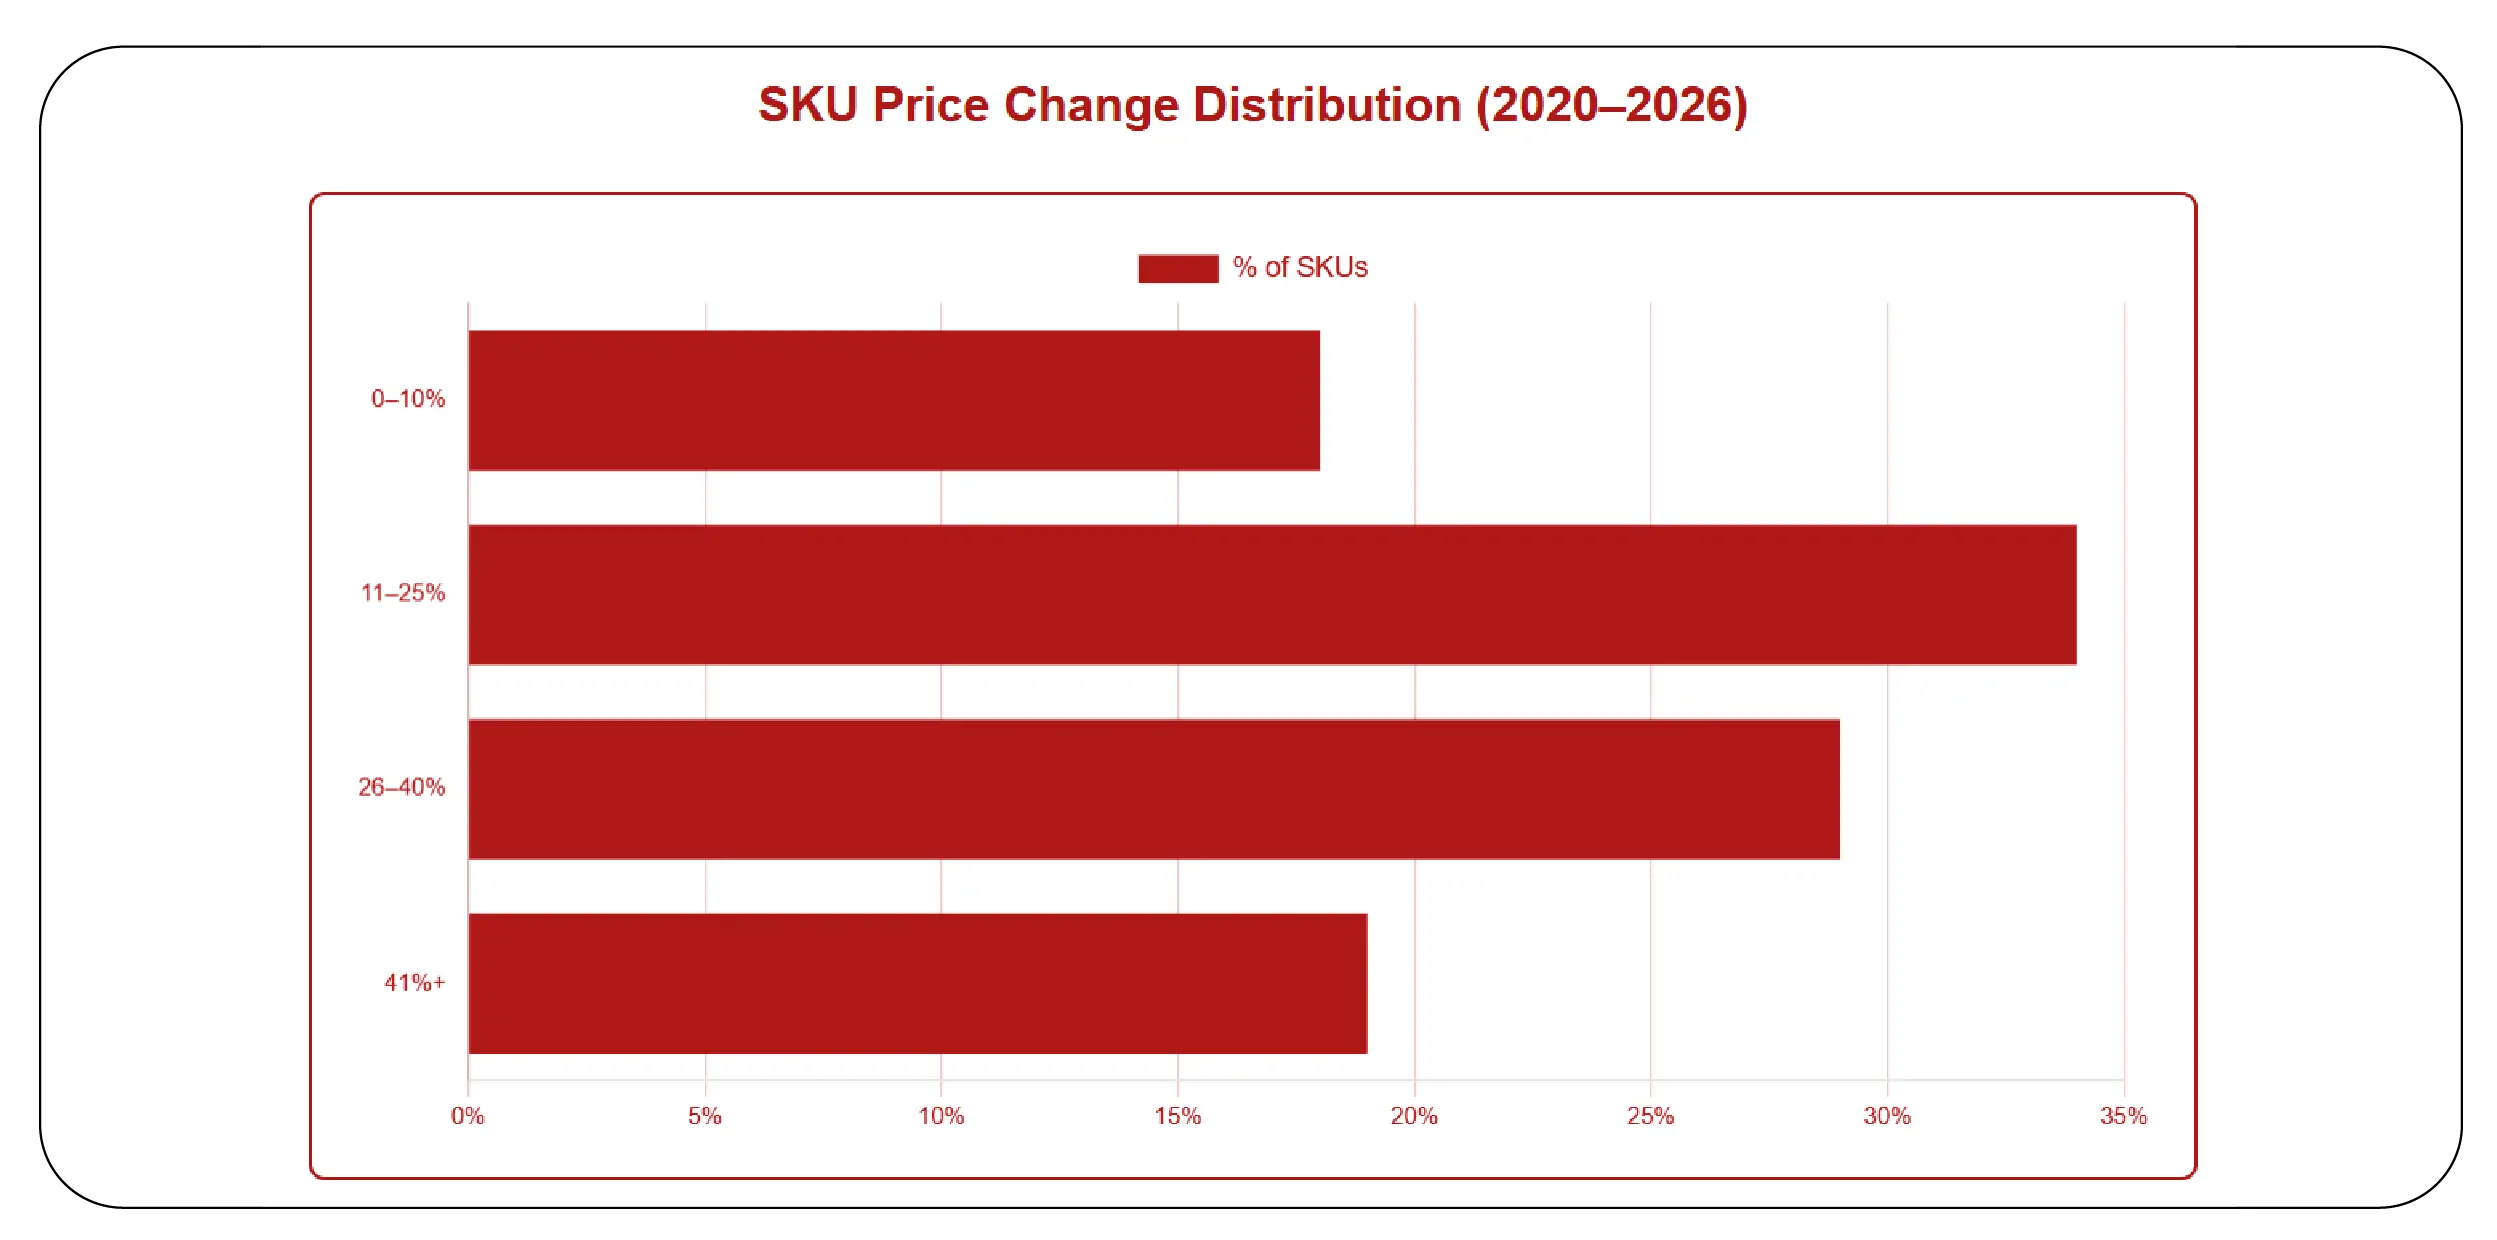
SKU Price Change Distribution (2020–2026)
| Change Range |
% of SKUs |
| 0–10% |
18% |
| 11–25% |
34% |
| 26–40% |
29% |
| 41%+ |
19% |
High-growth SKUs were primarily premium spirits and imported wines. SKU-level insights allowed businesses to identify price leaders, laggards, and optimal repricing opportunities without eroding margins.
Evolution Toward Continuous Price Monitoring
Retail pricing intelligence has shifted from periodic audits to continuous monitoring. Product Data Scrape implemented Real-time BevMo price tracking across California to deliver faster market signals and competitive alerts.
Price Update Frequency Impact
| Metric |
Before Automation |
After Automation |
| Price Update Lag |
7–10 days |
Real-time |
| Competitive Response Time |
5 days |
<24 hours |
| Pricing Accuracy |
88% |
98% |
Real-time tracking empowered retailers to respond immediately to competitor changes, adjust promotions dynamically, and prevent revenue leakage caused by outdated pricing.
Why Choose Product Data Scrape?
Product Data Scrape delivers advanced Commerce Intelligence solutions tailored for retail, CPG, and alcohol brands. Our expertise combines large-scale data scraping, AI-driven analytics, and customizable delivery formats. We offer reliable infrastructure, high data accuracy, and actionable insights that enable smarter pricing, better competitive positioning, and long-term growth. From SKU-level monitoring to statewide benchmarking, Product Data Scrape transforms raw data into strategic advantage.
Conclusion
This research report demonstrates how Product Data Scrape enables data-driven retail decisions through scalable price intelligence. By leveraging the BevMo Liquor Data Scraping API and comprehensive BevMo California Market Price Benchmarking, businesses gain real-time visibility into pricing trends, regional dynamics, and SKU-level movements.
Ready to gain real-time alcohol pricing intelligence and outperform competitors in California? Partner with Product Data Scrape today to turn pricing data into measurable growth.


.webp)


