
Introduction
The fashion industry is undergoing a transformative shift, with digital commerce, fast-changing consumer tastes, and global market volatility shaping brand performance. As brands compete for visibility and loyalty, Clothing sales intelligence For 2025 has become essential for understanding retail disruptions and identifying high-growth opportunities. Between 2020 and 2025, apparel sales patterns reveal unexpected winners, emerging categories, and rapid adoption of omnichannel shopping. Real-time datasets, automated scraping, and marketplace analytics now enable brands to track competitor pricing, product availability, and consumer sentiment more effectively than ever.
From high-end labels to mass-market retailers, data-driven insights are reshaping inventory planning, marketing, and trend forecasting. As fashion moves into a highly competitive digital era, real-time intelligence empowers brands to adapt faster, optimize assortments, and capture 25%+ growth segments across global markets.
Evolving Dynamics of Global Fashion Sales
In 2025, fashion brands are increasingly dependent on data-backed decision-making, with advanced Clothing sales datasets for top fashion brands 2025 offering visibility into category-level performance, pricing fluctuations, and SKU-level demand. The period between 2020 and 2025 showcases major changes driven by e-commerce expansion and a post-pandemic shift toward digital retail.
Global Apparel Sales Trends (2020–2025)
.webp)
| Year |
Global Apparel Sales (USD Trillion) |
Avg. YoY Growth (%) |
| 2020 |
1.45 |
-7.2% |
| 2021 |
1.62 |
11.7% |
| 2022 |
1.78 |
9.8% |
| 2023 |
1.94 |
9.0% |
| 2024 |
2.12 |
9.3% |
| 2025 |
2.34 |
10.4% |
Digital-first fashion brands outperformed traditional brands, growing nearly 25% faster in 2025 due to agile supply chains and faster response to micro-trends. Consumer spending increased in activewear, gender-neutral fashion, and premium basics. Meanwhile, sustainability-driven brands captured younger audiences by offering transparency in materials and production.
Product availability, promotional cycles, and influencer-driven demand added volatility to pricing, making structured datasets critical for forecasting. This section highlights how comprehensive datasets empower brands to anticipate trends, mitigate demand shocks, and drive profitable decisions in an increasingly complex global market.
Competitive Performance Insights Across Labels
Fashion competitiveness now heavily relies on insights derived from 2025 fashion brand rankings using scraped sales data, which reveal which brands are scaling, stagnating, or experiencing market share erosion. From 2020 to 2025, the top 20 apparel brands witnessed significant shifts due to digital disruption and evolving consumer identities.
Top 5 Global Fashion Brand Market Shares (2020–2025)
| Year |
Brand A |
Brand B |
Brand C |
Brand D |
Brand E |
| 2020 |
7.0% |
5.8% |
4.9% |
4.0% |
3.3% |
| 2021 |
7.5% |
6.1% |
5.2% |
4.4% |
3.6% |
| 2022 |
8.0% |
6.6% |
5.6% |
4.7% |
3.9% |
| 2023 |
8.6% |
7.0% |
5.9% |
5.1% |
4.1% |
| 2024 |
9.1% |
7.3% |
6.3% |
5.5% |
4.4% |
| 2025 |
9.8% |
7.8% |
6.7% |
6.0% |
4.7% |
These rankings indicate that the fashion market is becoming more consolidated, with technology-forward brands gaining advantage through rapid product drops, dynamic pricing, and AI-driven personalization. Emerging digital-native brands are entering top rankings faster than expected, fueled by viral content and niche communities.
Such rankings, powered by data scraping and structured intelligence, help businesses benchmark performance, identify threats early, and reposition assortments for competitive edge.
Role of Web-Driven Intelligence in Fashion Sales
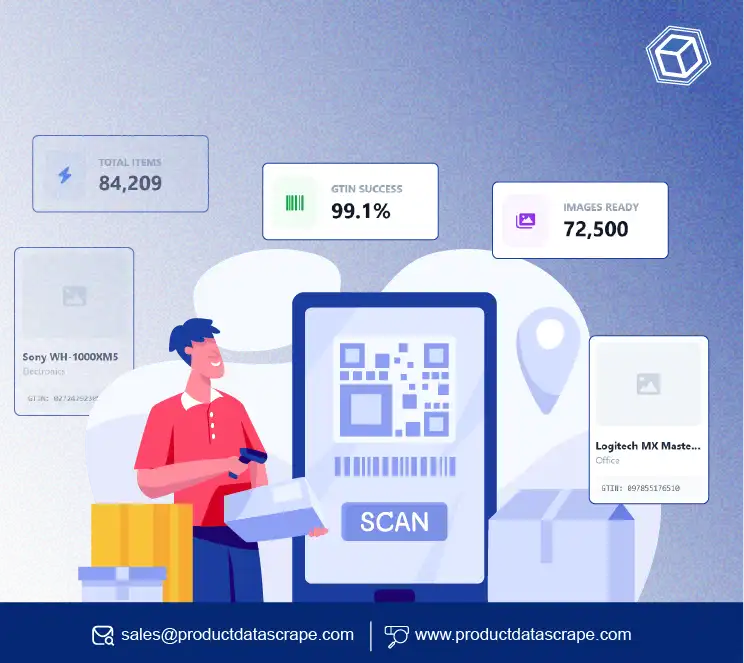
The availability of Web-scraped fashion sales data has transformed how brands track competitors, identify high-performing categories, and adjust pricing strategies. Using structured scraping, brands can extract product counts, stock levels, discount patterns, and best-selling SKUs from marketplaces and brand-owned stores.
Marketplace Listing Trends (2020–2025)
.webp)
| Year |
Avg. SKUs per Brand |
Avg. Discount Rate (%) |
OOS Frequency (%) |
| 2020 |
1,800 |
18 |
9.4 |
| 2021 |
2,050 |
20 |
8.7 |
| 2022 |
2,300 |
22 |
7.9 |
| 2023 |
2,650 |
23 |
7.2 |
| 2024 |
2,900 |
25 |
6.8 |
| 2025 |
3,200 |
27 |
6.1 |
With more SKUs listed digitally, brands gain wider global reach but also face heightened competition and faster product turnover. Real-time scraped data helps retailers optimize product mix and promotional timing.
Growth of Online Apparel Marketplaces
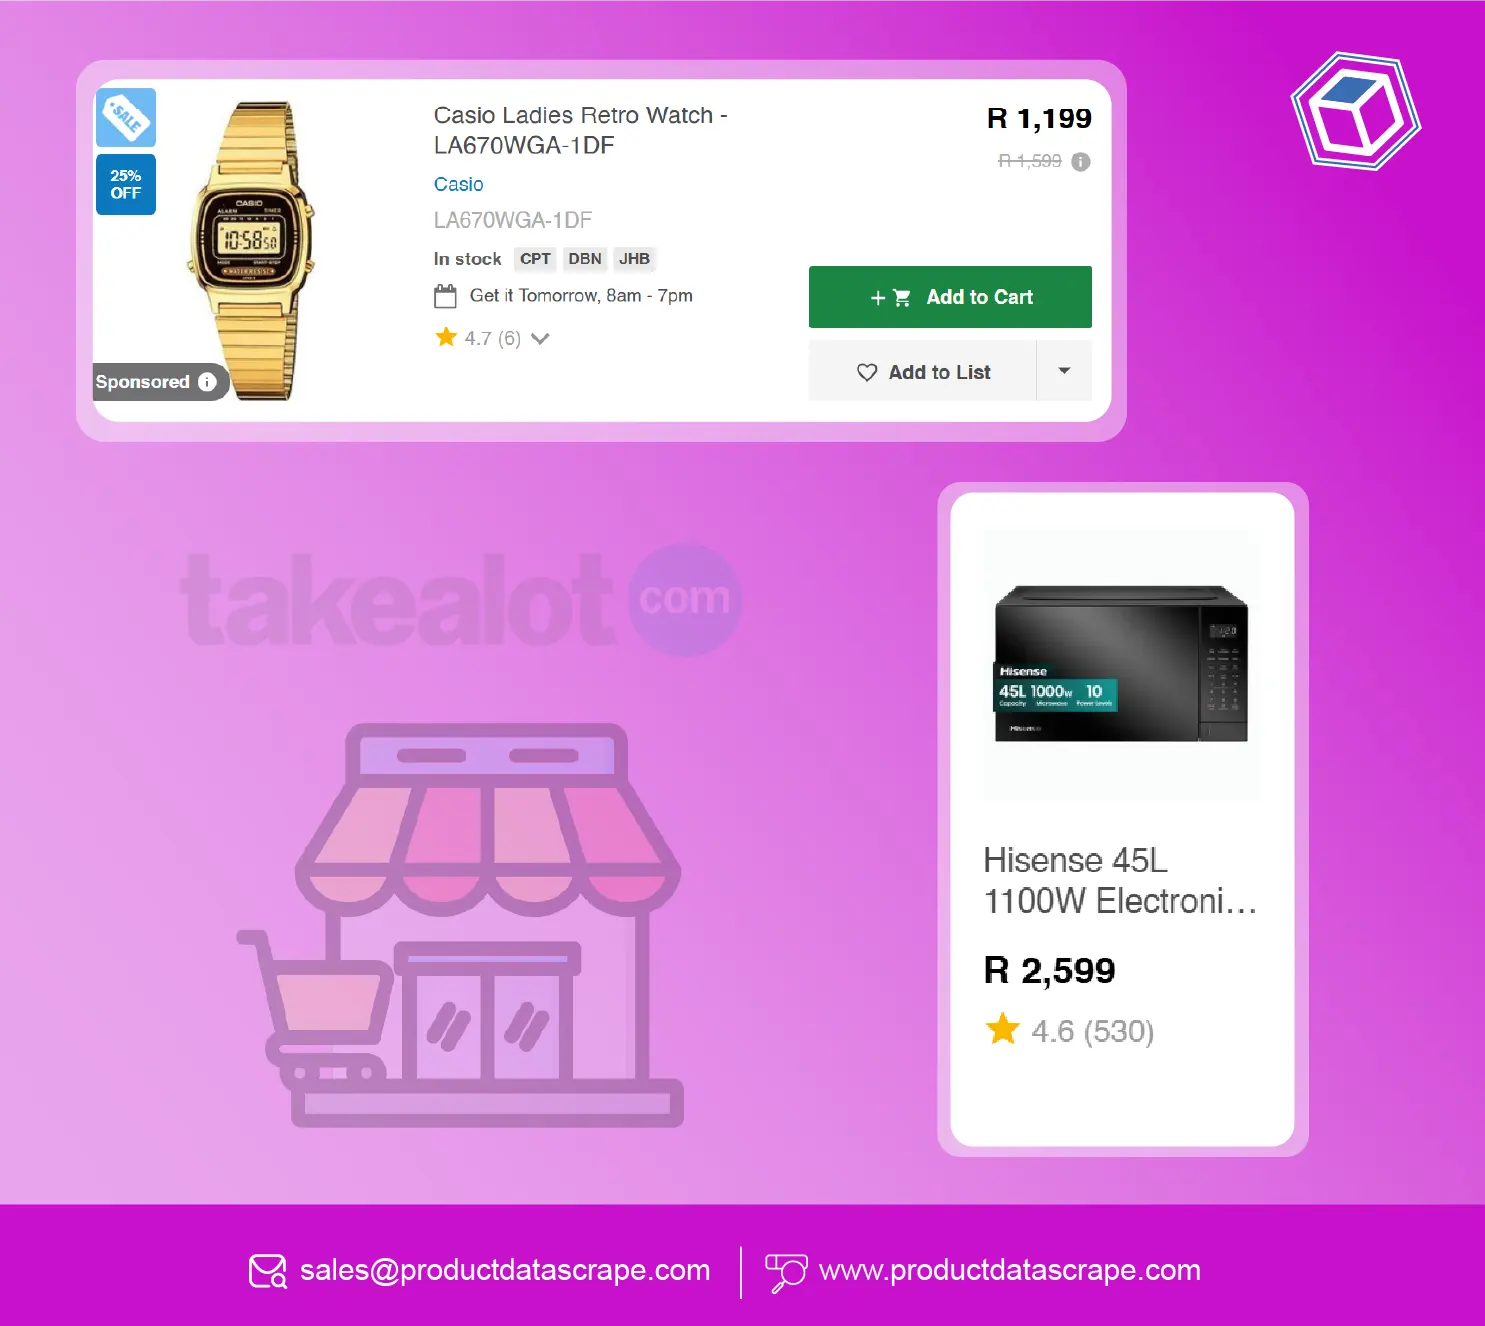
Consumer migration to digital retail accelerated massively, making E-commerce clothing sales scraping essential for understanding demand patterns and evaluating customer preferences. Between 2020 and 2025, online apparel revenue expanded significantly due to mobile-first shopping and omnichannel innovations.
E-Commerce Fashion Growth (2020–2025)
| Year |
Online Fashion Revenue (USD Billion) |
YoY Growth (%) |
Mobile Shopping Share (%) |
| 2020 |
430 |
12 |
58 |
| 2021 |
510 |
19 |
63 |
| 2022 |
590 |
16 |
68 |
| 2023 |
680 |
15 |
71 |
| 2024 |
770 |
13 |
73 |
| 2025 |
865 |
14 |
76 |
Scraped data reveals rising demand for budget-friendly basics, premium athleisure, and microtrend-driven collections launched by influencer brands. E-commerce intelligence empowers retailers to refine pricing, detect emerging styles, and optimize global distribution efficiently.
Value of Granular SKU Insights
Granular product-level intelligence is vital for fast-moving categories, making SKU-level clothing sales Datasets a powerful tool for retail strategy. Tracking variations in sizes, colors, fits, and materials gives brands visibility into item-level performance and predicts replenishment needs accurately.
SKU Performance Patterns (2020–2025)
.webp)
| Year |
Avg. SKUs/Brand |
Best-Seller Ratio (%) |
Stockout Rate (%) |
| 2020 |
1,200 |
14 |
10.5 |
| 2021 |
1,350 |
15.8 |
9.8 |
| 2022 |
1,500 |
17.4 |
8.9 |
| 2023 |
1,680 |
18.2 |
8.3 |
| 2024 |
1,840 |
19.5 |
7.7 |
| 2025 |
2,000 |
20.8 |
7.1 |
With SKU-level insights, brands reduce dead stock, improve profitability, and enhance forecasting accuracy. Retail leaders increasingly depend on product-level intelligence for dynamic decision-making.
Expanding Data Coverage Across Platforms
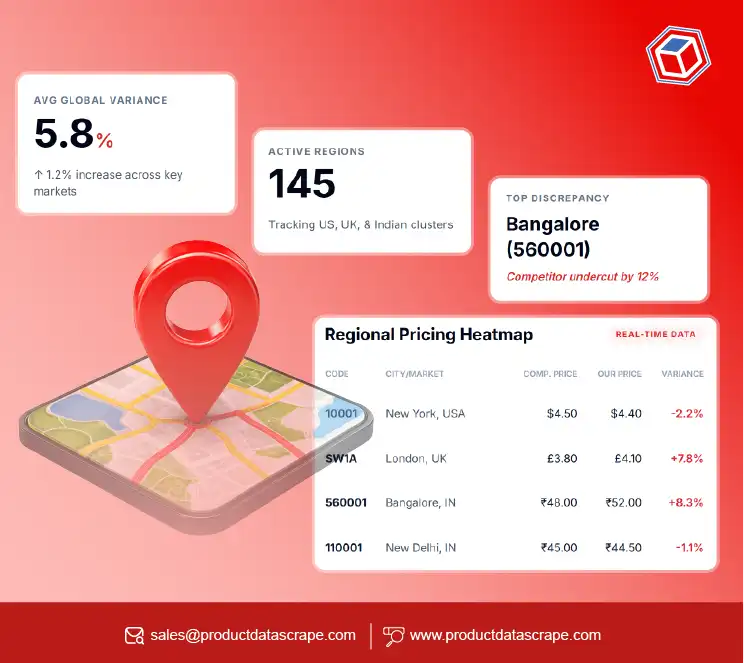
Brands aiming for global reach require broad data coverage, supported by the capability to Scrape Data From Any Ecommerce Websites. This ensures access to multi-channel datasets including marketplaces, brand stores, regional platforms, and mobile apps.
Multi-Platform Data Growth (2020–2025)
| Year |
Avg. Platforms Scraped/Brand |
Price Change Events |
Promo Events Captured |
| 2020 |
3 |
1,200 |
800 |
| 2021 |
4 |
1,560 |
1,050 |
| 2022 |
5 |
1,980 |
1,310 |
| 2023 |
6 |
2,250 |
1,450 |
| 2024 |
7 |
2,580 |
1,720 |
| 2025 |
8 |
2,940 |
1,950 |
Brands gain competitive advantage by tracking real-time pricing, category expansions, and customer-driven trends across global markets. Cross-platform intelligence highlights true market positioning and identifies growth territories faster.
Why Choose Product Data Scrape?
With industry-leading tools that enable brands to Extract Fashion & Apparel Data, Product Data Scrape delivers unmatched accuracy, speed, and customization. Leveraging advanced automation and deep intelligence, the platform supports global tracking, pricing analytics, SKU monitoring, and trend forecasting. Businesses benefit from precise dataset coverage tailored to their needs while strengthening competitiveness through Clothing sales intelligence For 2025 insights.
Conclusion
In a rapidly evolving retail ecosystem, data-driven insights are the foundation of success. Brands armed with Custom eCommerce Dataset solutions and real-time Clothing sales intelligence For 2025 can outperform competitors, optimize assortments, and capture the fast-growing 25% market surge shaping the fashion industry.
Transform your fashion analytics with Product Data Scrape — start leveraging real-time, market-ready datasets today!
FAQs
1. How does scraped fashion data improve brand strategies?
Scraped data reveals competitor pricing, best-selling SKUs, promotions, and market trends, enabling brands to optimize assortments, forecast demand accurately, and strengthen overall retail strategy.
2. What types of fashion data can be scraped?
Brands can extract pricing, inventory, SKU details, product attributes, discounts, ratings, reviews, and marketplace listings across global platforms to gain highly actionable insights.
3. How often is clothing sales data updated?
Depending on business needs, data can be refreshed hourly, daily, or weekly, ensuring real-time visibility into fast-changing fashion trends and pricing movements.
4. Can scraping track global fashion brands?
Yes, data scraping covers international marketplaces and regional sites, allowing brands to track global competitors and analyze cross-market performance trends.
5. Why is SKU-level data valuable in fashion?
SKU-level intelligence reveals item-specific demand, reducing stockouts, improving replenishment decisions, and enhancing forecasting accuracy for rapidly changing apparel categories.


.webp)


