
Introduction
The rapid digitalization of India’s retail ecosystem has transformed grocery shopping into a data-driven experience. With millions of SKUs updated daily across categories such as staples, beverages, snacks, and personal care, Flipkart has become a critical source of real-time retail intelligence. Businesses today rely on structured datasets like the Flipkart grocery dataset for Power BI to convert unstructured product information into actionable dashboards that support pricing strategy, inventory planning, and demand forecasting.
At the same time, large-scale retail analysts are increasingly leveraging the Flipkart Grocery Store Dataset to study long-term patterns in consumer behavior, seasonal demand shifts, and category-level growth. By integrating scraped product data into Power BI dashboards, decision-makers gain the ability to monitor market changes from 2020 to 2026—spanning pre-pandemic, pandemic, and post-pandemic retail cycles.
This research report explores how product data scraping enables businesses to visualize trends, uncover opportunities, and build competitive advantage through advanced analytics and intelligent reporting.
Understanding the Evolution of Grocery Pricing Dynamics

Between 2020 and 2026, Flipkart’s grocery marketplace has undergone a fundamental shift in pricing architecture. What began as a discount-driven platform has matured into a balanced ecosystem where premium SKUs and private labels play a growing role. The Flipkart grocery price trend analysis 2026 highlights a steady upward movement in average price indices, driven by inflation, improved supply chains, and rising consumer preference for branded and organic products.
Power BI dashboards built on scraped pricing data reveal that while discounts remain frequent, their strategic deployment has evolved. Instead of flat price cuts, retailers now focus on bundle offers, loyalty pricing, and limited-time flash deals. This shift has enabled brands to protect margins while maintaining competitiveness.
Moreover, long-term pricing visualization helps grocery suppliers anticipate cost fluctuations and adjust procurement strategies. From edible oils to packaged snacks, categories show distinct pricing curves that reflect changing consumer demand patterns. These insights enable grocery brands to plan launches, optimize promotions, and identify the right time to introduce premium variants.
Building Smarter Dashboards Through Automated Data Pipelines
Market Statistics (2020–2026)
| Year |
Active SKUs Scraped |
Avg Data Refresh Rate |
BI Adoption (%) |
| 2020 |
25,000 |
Weekly |
35 |
| 2021 |
40,000 |
Bi-weekly |
42 |
| 2022 |
65,000 |
Daily |
50 |
| 2023 |
90,000 |
Daily |
58 |
| 2024 |
120,000 |
Near real-time |
65 |
| 2025 |
150,000 |
Real-time |
72 |
| 2026 |
180,000 |
Real-time |
80 |
Modern retail analytics depends heavily on automation. Businesses that scrape Flipkart grocery data for Power BI gain a competitive advantage by ensuring dashboards always reflect current market conditions. From price changes and stock availability to ratings and seller performance, every data point contributes to more accurate forecasting models.
Between 2020 and 2026, organizations shifted from manual reporting to fully automated pipelines that push scraped data directly into Power BI. This evolution has reduced reporting cycles from weeks to minutes, enabling faster reaction to market shifts such as sudden demand spikes during festivals or supply disruptions.
Furthermore, automated scraping enhances consistency across large datasets. Instead of relying on fragmented data sources, analysts can work with a single source of truth that unifies product attributes, pricing tiers, and promotional campaigns. This unified view supports category managers, procurement teams, and marketing leaders in aligning their strategies around real-time insights.
Tracking High-Impact Products in Quick-Commerce Channels
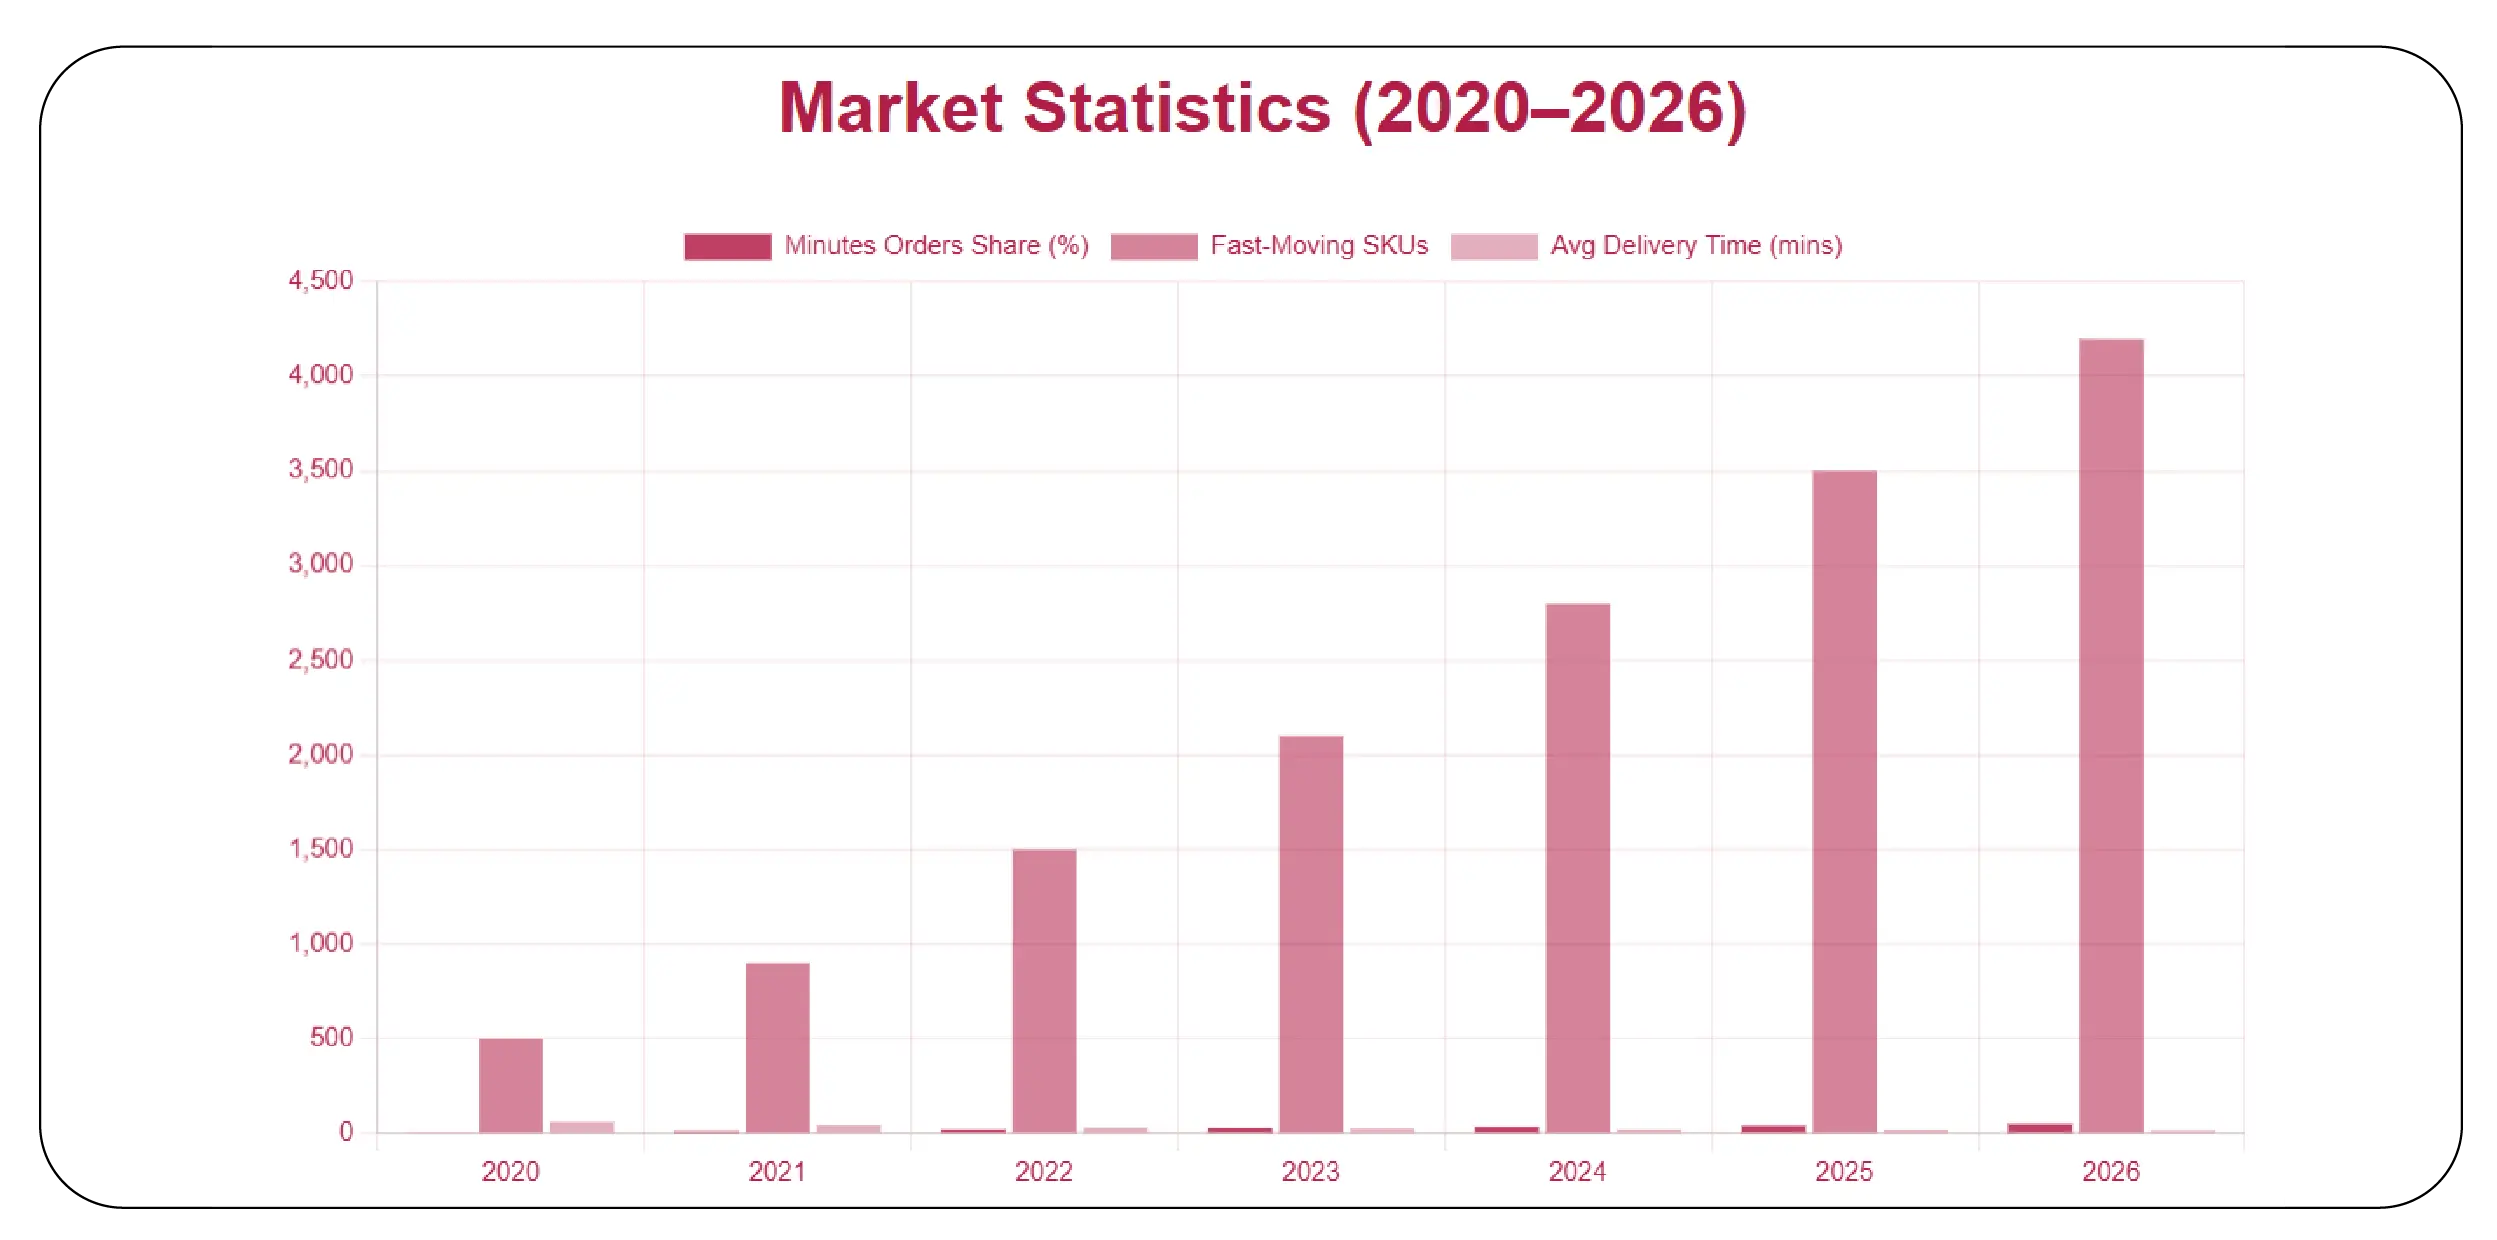
Quick-commerce has redefined grocery shopping, and the ability to Scrape Top Grocery SKUs from Flipkart Minutes allows brands to understand which products dominate hyperlocal demand. From milk and bread to instant noodles and snacks, these SKUs form the backbone of fast-delivery business models.
Dashboards built on this data reveal that convenience-driven categories now account for half of total grocery transactions by 2026. This transformation has forced brands to rethink packaging sizes, shelf life, and pricing structures to align with impulse-driven buying behavior.
Retailers benefit from SKU-level tracking by identifying which items perform best in specific urban clusters. Such insights enable precise inventory allocation, reducing wastage while improving service levels. Over time, this data-driven approach has turned quick-commerce into one of the most profitable channels within the grocery ecosystem.
Structuring Large-Scale Product Information for Strategic Decisions
Market Statistics (2020–2026)
| Year |
Dataset Size (GB) |
Avg Price Fields |
Category Coverage |
| 2020 |
5 |
6 |
60% |
| 2021 |
9 |
8 |
70% |
| 2022 |
14 |
10 |
80% |
| 2023 |
20 |
12 |
90% |
| 2024 |
28 |
14 |
95% |
| 2025 |
35 |
16 |
98% |
| 2026 |
42 |
18 |
100% |
The Flipkart grocery product price dataset 2026 reflects how data depth has expanded dramatically over time. Today’s datasets go far beyond basic price points, capturing historical prices, promotional flags, seller comparisons, and stock indicators.
This evolution enables organizations to conduct advanced price elasticity studies and competitor benchmarking. Power BI dashboards built on such datasets help visualize not just what prices are, but why they change—linking fluctuations to festivals, inflation, and regional demand trends.
As datasets grow richer, they also support predictive analytics. Retailers can now forecast which products are likely to see demand surges in coming months and prepare supply chains accordingly. This level of foresight was nearly impossible in 2020 but has become standard practice by 2026 thanks to systematic data scraping and visualization.
Enabling Intelligent Analytics Through Visual Storytelling
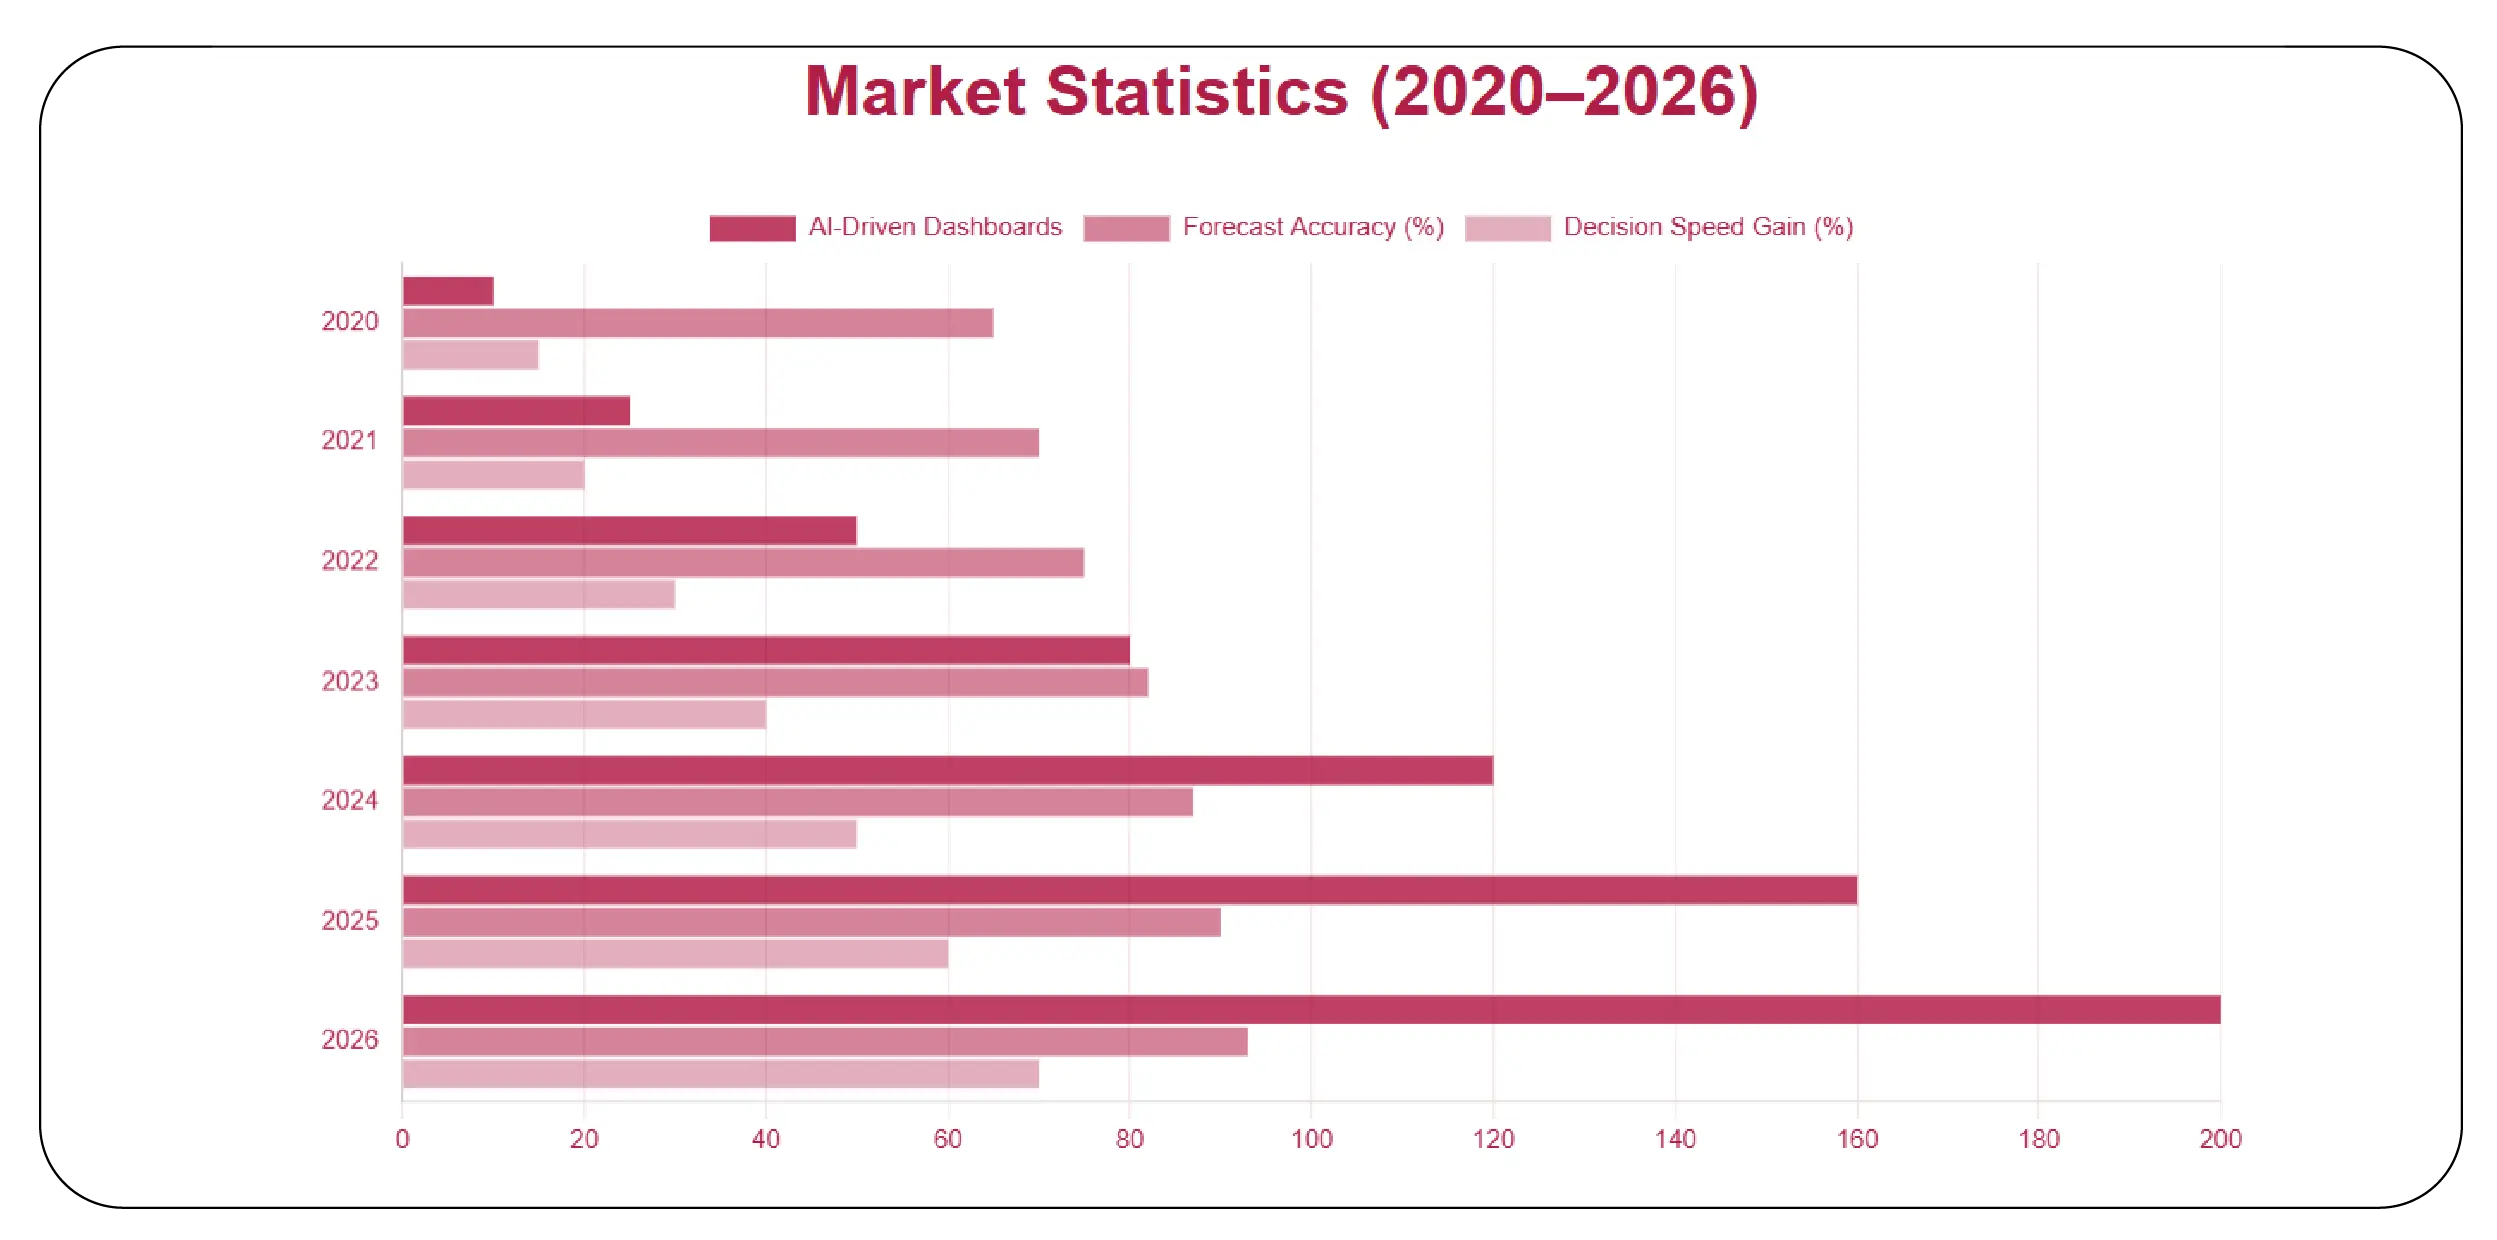
Advanced dashboards are no longer static reports—they are intelligent systems. Through Flipkart grocery data visualization for AI, organizations combine machine learning models with interactive Power BI dashboards to unlock predictive and prescriptive insights.
These visualizations help business users understand complex analytics without technical expertise. Category managers can see which SKUs are likely to underperform, while marketers identify which promotions will deliver maximum ROI. Over time, this democratization of analytics has accelerated decision-making across retail enterprises.
AI-powered visualization also enhances scenario planning. By simulating price changes or supply disruptions, leaders can evaluate potential outcomes before implementing strategies. This capability has become essential in an environment marked by volatile consumer demand and intense competition.
Creating Unified Market Intelligence Across Digital Retail
Market Statistics (2020–2026)
| Year |
Products Tracked |
Data Fields |
Cross-Category Analysis |
| 2020 |
80,000 |
12 |
Limited |
| 2021 |
120,000 |
15 |
Moderate |
| 2022 |
180,000 |
18 |
High |
| 2023 |
240,000 |
22 |
Advanced |
| 2024 |
300,000 |
26 |
Extensive |
| 2025 |
360,000 |
30 |
Enterprise-grade |
| 2026 |
420,000 |
35 |
Fully integrated |
The Flipkart E-commerce Product Dataset extends beyond groceries, enabling cross-category comparisons between food, personal care, and household essentials. This integrated view allows brands to study basket composition, identify complementary products, and design smarter cross-sell strategies.
By visualizing multi-category data in Power BI, organizations gain insights into how consumers shift spending between categories during economic cycles. For example, during inflationary periods, shoppers may trade down on premium snacks but maintain spending on essentials. These patterns are critical for long-term portfolio planning.
Unified datasets also empower platform-level strategy, helping marketplaces optimize category placements, search algorithms, and recommendation engines based on real consumer behavior.
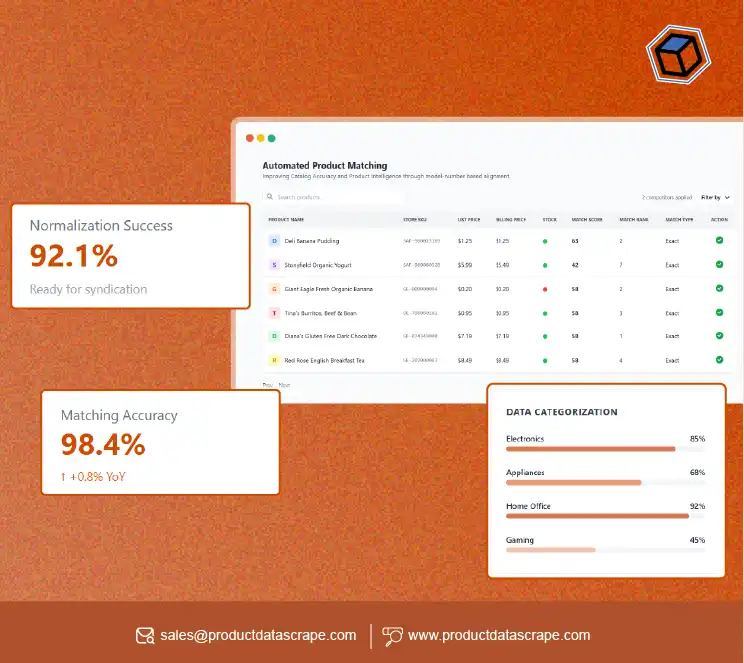
Why Choose Product Data Scrape?
Product Data Scrape delivers enterprise-grade solutions designed to help businesses transform raw e-commerce data into strategic intelligence. With capabilities to scrape Flipkart grocery prices daily for Power BI, organizations ensure their dashboards always reflect the most current market reality—enabling agile pricing strategies and real-time performance tracking.
By offering structured, scalable, and compliant data extraction services, Product Data Scrape simplifies the process of building analytics ecosystems around the Flipkart grocery dataset for Power BI. Clients benefit from automated workflows, customizable dashboards, and expert support that ensures data accuracy and consistency.
From startups to large enterprises, Product Data Scrape empowers teams to move beyond intuition and base every decision on evidence-driven insights.
Conclusion
The evolution of Flipkart’s grocery ecosystem from 2020 to 2026 demonstrates the transformative power of data. Organizations that extract Flipkart grocery product data gain a strategic edge by converting market complexity into clarity through advanced Power BI dashboards.
As competition intensifies and consumer expectations rise, leveraging the Flipkart grocery dataset for Power BI is no longer optional—it is essential for sustainable growth.
Start transforming your retail strategy today with Product Data Scrape—turn raw grocery data into powerful insights that drive smarter decisions and faster growth!


.webp)


