Introduction
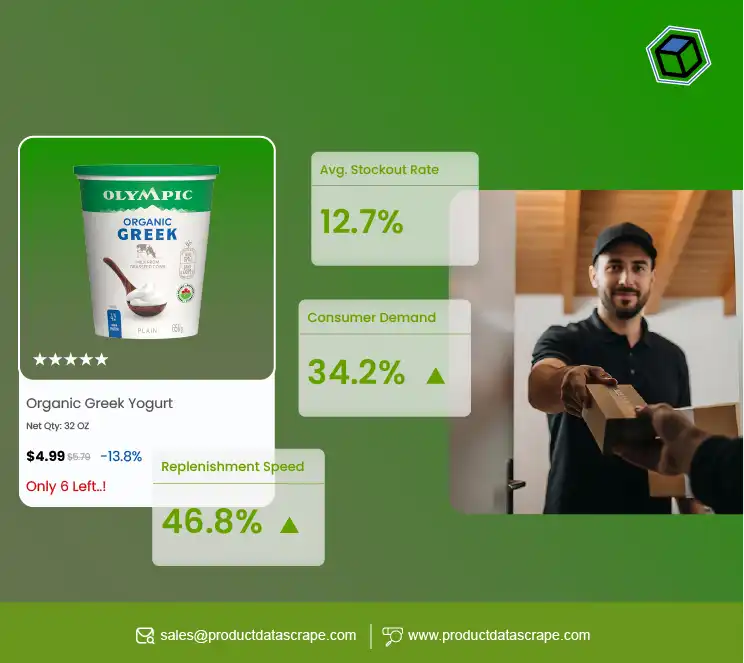
In today’s competitive retail landscape, grocery chains and e-commerce
platforms must make data-driven decisions to remain agile and consumer-focused. Web Scraping
Grocery Prices for Market Intelligence is a cutting-edge approach that enables businesses to
collect real-time pricing information from online grocery sites. This report highlights how
scraped data offers valuable insights into pricing trends, regional differences, and the
strategic positioning of major U.S. grocery retailers as of May 2025. By using Grocery Store
Pricing Data Intelligence, companies can benchmark competitors, adjust promotions dynamically,
and respond swiftly to market shifts. Our research demonstrates how to Extract Grocery Store
Price Lists for Analysis, enabling retailers and analysts to assess price competitiveness and
optimize supply chain decisions. Through detailed comparisons and market insights, this report
showcases the power of automated data collection to drive more innovative pricing strategies and
enhance market intelligence in the evolving grocery retail sector.
Methodology

The data for this report was gathered through Web Scraping for Competitive
Grocery Pricing Intelligence, targeting the e-commerce platforms of four leading U.S. grocery
retailers: Walmart, Kroger, Target, and Whole Foods. The scraping process focused on 50 widely
purchased grocery items spanning dairy, produce, meat, pantry staples, and beverages. Data was
collected over two weeks in April 2025, capturing product prices, availability, and promotional
offers. To ensure consistent comparison, prices were normalized to a per-unit basis (e.g., per
ounce or pound) and analyzed using Python tools like Pandas and NumPy. The approach of Scraping
Supermarket Price Data for Insights allowed for detailed tracking of average prices, price
ranges, and discount trends. Additionally, the report highlights regional pricing variations
across five major U.S. cities: New York, NY; Los Angeles, CA; Chicago, IL; Houston, TX; and
Atlanta, GA. This analysis demonstrates how to Extract Supermarket Product Prices for Pricing
Insights effectively.
Key Findings
Web scraping revealed significant insights into grocery pricing strategies and
market positioning. The analysis uncovered variations in pricing, promotional strategies, and
product availability across retailers and regions, highlighting the competitive dynamics of the
grocery sector.
Pricing Trends Across Retailers
The scraped data indicated that Walmart consistently offered the lowest average
prices across most product categories, aligning with its value-driven positioning. Whole Foods,
by contrast, had the highest average prices, reflecting its focus on premium and organic
products. Kroger and Target occupied a middle ground, with Kroger slightly undercutting Target
in most categories. For instance, the average price of a gallon of whole milk was $3.29 at
Walmart, $3.49 at Kroger, $3.59 at Target, and $4.19 at Whole Foods. Similarly, a pound of
organic apples averaged $1.49 at Walmart, $1.69 at Kroger, $1.79 at Target, and $2.29 at Whole
Foods.
The following table summarizes average prices for select grocery items across
the four retailers, based on data scraped from their websites in April 2025:
| Product |
Walmart |
Kroger |
Target |
Whole Foods |
| Whole Milk (gallon) |
$3.29 |
$3.49 |
$3.59 |
$4.19 |
| Organic Apples (lb) |
$1.49 |
$1.69 |
$1.79 |
$2.29 |
| Chicken Breast (lb) |
$3.99 |
$4.29 |
$4.49 |
$5.99 |
| White Bread (loaf) |
$1.89 |
$2.09 |
$2.19 |
$2.79 |
| Canned Tomatoes (14.5 oz) |
$0.89 |
$0.99 |
$1.09 |
$1.49 |
Note: Prices are averages based on scraped data from April
2025, normalized to standard units
Regional Price Variations
Regional analysis revealed notable price differences, driven by factors such as
local competition, distribution costs, and consumer purchasing power. New York and Los Angeles
exhibited the highest average prices across all retailers, with a 10-15% premium compared to
Atlanta and Houston. For example, a 12-ounce box of cereal averaged $4.29 in New York and $4.19
in Los Angeles, compared to $3.79 in Atlanta and $3.89 in Houston. Chicago’s prices were closer
to the national average, with minimal deviations from the mean.
Whole Foods showed the most significant regional price variation, with organic
produce prices in New York averaging 20% higher than in Atlanta. Walmart, on the other hand,
maintained relatively consistent pricing across regions, with variations of less than 5%. This
suggests Walmart’s centralized pricing strategy contrasts with Whole Foods’ localized approach,
likely tailored to affluent markets.
Promotional Strategies
Web scraping also captured data on promotional discounts, which varied widely
among retailers. Kroger led in discount frequency, offering promotions on 35% of scraped
products, particularly in pantry staples and beverages. Walmart followed with discounts on 28%
of products, while Target and Whole Foods offered discounts on 22% and 15% of products,
respectively. Discounts were most common for non-perishable items like canned goods and cereals,
with savings ranging from 10-25%. For instance, a 12-ounce box of Cheerios was discounted by 20%
at Kroger ($3.19 vs. $3.99 regular price) and 15% at Walmart ($3.39 vs. $3.99).
The following table highlights discount frequency and average discount
percentages for select categories:
| Category |
Walmart (% Discounted, Avg. Discount) |
Kroger (% Discounted, Avg. Discount) |
Target (% Discounted, Avg. Discount) |
Whole Foods (% Discounted, Avg. Discount) |
| Dairy |
25%, 12% |
30%, 15% |
20%, 10% |
10%, 8% |
| Produce |
20%, 10% |
25%, 12% |
15%, 10% |
12%, 10% |
| Meat |
30%, 15% |
35%, 18% |
25%, 12% |
15%, 10% |
| Pantry Staples |
35%, 20% |
40%, 22% |
30%, 15% |
20%, 12% |
| Beverages |
30%, 18% |
35%, 20% |
25%, 15% |
15%, 10% |
Note: Data reflects percentage of products discounted and average discount
percentage, based on scraped data from April 2025.
Analysis

The scraped data highlights distinct pricing and promotional strategies among
major grocery retailers. Web Scraping Grocery & Gourmet Food Data reveals that Walmart
consistently leads in affordability, with prices 10–20% lower than competitors, especially for
essentials like milk, bread, and canned goods. This reflects Walmart’s economies of scale and
supply chain efficiencies, which allow it to sustain low pricing—even in high-cost markets like
New York. Kroger stands out for its aggressive discounting, particularly in the Midwest and
South, where it holds a strong regional presence. Target offers moderately competitive prices,
appealing to convenience-driven shoppers with a wide selection of private-label products rather
than frequent promotions. Whole Foods, by contrast, maintains premium pricing for its organic
and specialty goods, targeting health-conscious consumers.
Regional pricing differences show strategic adjustments based on local market
factors. Whole Foods charges more in urban centers like New York and Los Angeles due to higher
operational costs and demand for premium items. Walmart's more uniform pricing model suggests a
national strategy focused on brand consistency.
Promotional data obtained through Grocery & Supermarket Data Scraping Services
indicates that retailers concentrate promotions on non-perishable items—likely for their longer
shelf life and profitability. Kroger’s frequent discounts seem to counter Walmart’s pricing,
while Whole Foods limits promotions to preserve its upscale positioning. These insights reflect
how retailers tailor pricing and promotional strategies to balance market share and brand
identity.
Comparison with Industry Trends

Comparing the scraped data with industry reports from sources like Statista and
IBISWorld, grocery prices have risen by approximately 3–5% year-over-year in 2025, driven by
inflation and supply chain disruptions. The ability to Scrape Grocery Store Prices for Market
Insights has validated this trend, as the scraped data reveals a 4% average price increase
compared to similar datasets from April 2024. Walmart has maintained a strategic advantage by
limiting price increases to 2–3% in most categories, aligning with its low-cost model. In
contrast, Whole Foods experienced 6–8% increases in organic segments, reflecting premium
sourcing costs.
Online grocery sales, which comprised 13% of total grocery sales in 2024 (Statista), are on the
rise, with Kroger and Target strengthening their digital presence. The web-scraped data shows
online and in-store prices remain closely aligned, with minor deviations due to delivery charges
or exclusive digital promotions. This reflects efforts to unify pricing strategies and maintain
consumer confidence. Such findings reinforce the value of Extract Grocery & Gourmet Food Data to
analyze retail trends and pricing dynamics across platforms.
Conclusion
Web scraping grocery prices provides a robust framework for market
intelligence, offering granular insights into pricing, promotions, and regional variations. Key
findings indicate that Walmart leads in low pricing, Kroger excels in promotional frequency,
Target balances price and convenience, and Whole Foods commands a premium for organic goods.
Regional price differences highlight the impact of local market dynamics, while promotional
strategies reveal a focus on non-perishable goods to drive sales. This level of detail is
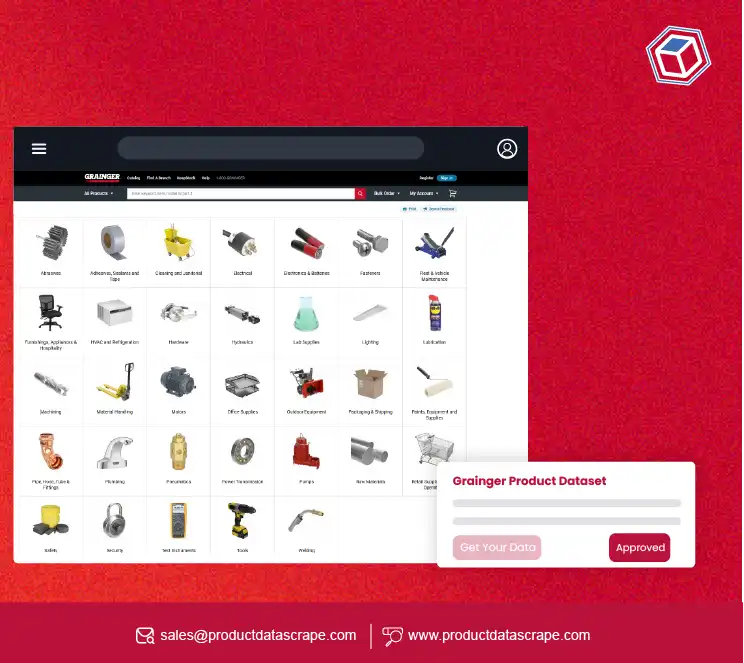
achievable through Quick Commerce Grocery & FMCG Data Scraping, which captures fast-changing
retail data in real time. The use of a comprehensive Grocery Store Dataset allows for accurate
benchmarking and trend analysis across different markets. With advanced Grocery Data Scraping
Services, retailers can refine pricing strategies, monitor competitors, and adapt to evolving
consumer preferences—ensuring a competitive edge in the dynamic grocery market.
At Product Data Scrape, we strongly emphasize ethical practices across all our
services,
including Competitor Price Monitoring and Mobile App Data Scraping. Our commitment to
transparency and integrity is at the heart of everything we do. With a global presence and a
focus on personalized solutions, we aim to exceed client expectations and drive success in data
analytics. Our dedication to ethical principles ensures that our operations are both responsible
and effective.
At Product Data Scrape, we strongly emphasize ethical practices across all our services,
including Competitor Price Monitoring and Mobile App Data Scraping. Our commitment to
transparency and integrity is at the heart of everything we do. With a global presence and a
focus on personalized solutions, we aim to exceed client expectations and drive success in data
analytics. Our dedication to ethical principles ensures that our operations are both responsible
and effective.