Introduction
The global pharmaceutical market is undergoing a digital transformation, driven by the rapid
adoption of online pharmacies, telemedicine, and drug delivery services. In this context,
understanding price discrepancies across regions—especially between developed and emerging
economies—is vital for both policymakers and commercial stakeholders. The Pharmaceutical Pricing
Dataset for USA & India Pharmacy Market provides a robust foundation for comparative analysis
between two of the world’s largest healthcare markets.
This report focuses on how real-time drug pricing datasets can be used to monitor, compare, and
strategize pricing policies across the USA and India. Online pharmacies in both countries, such
as 1mg, NetMeds, PharmEasy in India and CVS, Walgreens, and Rite Aid in the USA, serve as key
data points. By leveraging web scraping and real-time tracking, the pricing dataset provides
pharmaceutical companies, researchers, and pricing regulators with actionable insights.
From branded generics to life-saving medication, tracking variance in prices helps reveal
accessibility challenges and economic inefficiencies in the supply chain. This report explores
core use cases of the Pharmaceutical Pricing Dataset for USA & India Pharmacy Market, supported
by six deep-dive sections that include analysis, stats, and application strategies.
Real-Time Price Monitoring: India vs USA Pharma Product Price Comparison
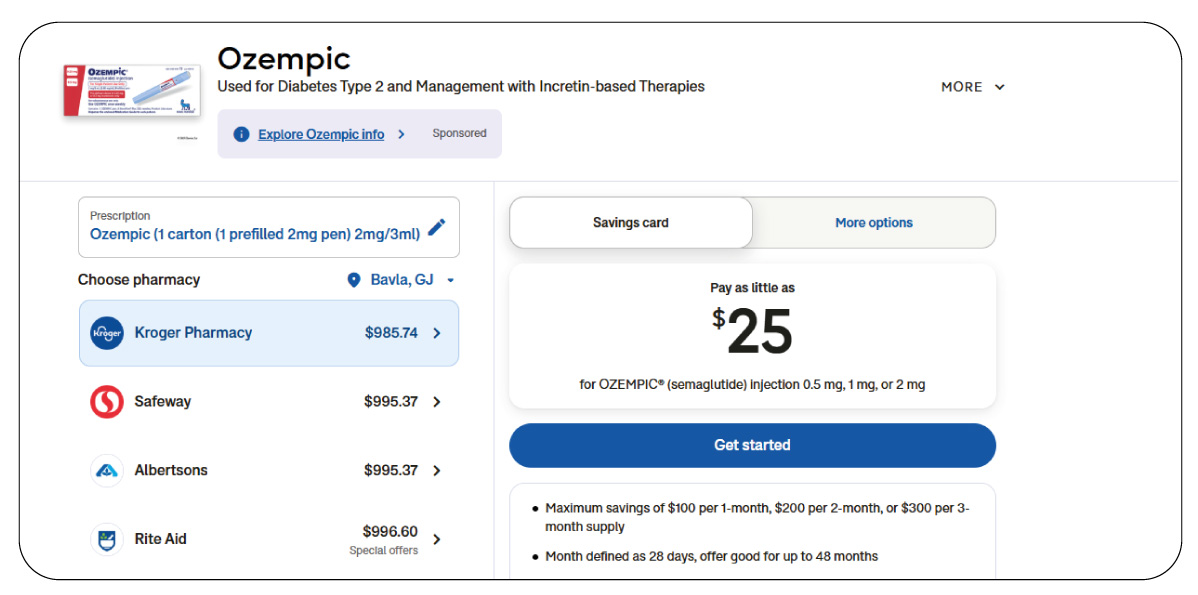
Using the Pharmaceutical Pricing Dataset for USA & India Pharmacy Market, stakeholders can
observe how pricing models differ across both regions. For instance, while generic drugs
dominate India’s market, branded drugs and insurance-backed pricing frameworks are more
prevalent in the USA. This variance leads to significant differences in accessibility and
affordability.
From 2020 to 2025, the average retail markup for prescription drugs in India ranged between
32%–45%, while the U.S. saw markups between 75%–120%, influenced by insurance, pharmacy benefit
managers (PBMs), and regulatory protocols. The following table compares average online prices
for commonly prescribed drugs in 2024:
| Drug Name |
India Avg. Price (INR) |
USA Avg. Price (USD) |
| Atorvastatin |
₹180 |
$15 |
| Metformin |
₹90 |
$8 |
| Amoxicillin |
₹160 |
$22 |
| Omeprazole |
₹110 |
$17 |
Analysis of this dataset allows policy-makers to frame import/export policies and taxation
reform. The India vs USA Pharma Product Price Comparison metric also helps identify overpricing,
counterfeit issues, and subsidy loopholes. This data-centric view fuels decisions on setting
price ceilings and rolling out government-run distribution schemes for essential medication.
Accessibility & Delivery Benchmark: USA and India Online Pharmacy Price Comparison
Access to life-saving medication is still unequal between urban and rural regions in both India
and the United States. The Pharmaceutical Pricing Dataset for USA & India Pharmacy Market lets
brands and regulators compare delivery charges, promotional pricing, refill cycles, and average
cart value across national e-pharmacy platforms.
In India, 78% of online orders in 2024 were fulfilled within 48 hours in tier-1 cities, but only
41% in rural districts. In contrast, 84% of U.S. consumers in urban areas received their orders
within 36 hours. This difference highlights a need for improved last-mile delivery networks in
India.
| Fulfillment Metric |
India (2024) |
USA (2024) |
| Avg. Delivery Time |
2.9 Days |
1.5 Days |
| Avg. Cart Size |
₹950 |
$92 |
| Delivery Success Rate (Rural) |
61% |
79% |
By using USA and India Online Pharmacy Price Comparison, retail chains can adjust inventory
hubs, plan warehouse proximity, and target subsidies based on order demographics. Retailers can
also design affordable subscription models and loyalty programs customized to region-wise
affordability.
Moreover, accessibility metrics empower digital healthcare startups to prioritize underserved
areas. This ensures both equitable distribution and maximized margins, especially for chronic
therapy segments.
Advanced Analytics with Pharmaceutical Product Pricing Dataset Insights
The Pharmaceutical Pricing Dataset for USA & India Pharmacy Market offers a structured and
timestamped feed for pricing changes, promotional offers, and drug availability. This is useful
for algorithmic modeling, price elasticity analysis, and predictive demand forecasting.
From 2020 to 2025, companies using data-driven pricing strategies in both markets saw a 27%
higher revenue per user (RPU) and a 19% improvement in customer retention. Pharmaceutical brands
rely on Pharmaceutical Product Pricing Dataset Insights to optimize pricing tiers for different
drug classes.
| Metric |
Pre-Data Model (2020) |
Post-Data Model (2025) |
| Avg. RPU (India) |
₹700 |
₹920 |
| Avg. Retention Rate (India) |
61% |
74% |
| Avg. RPU (USA) |
$85 |
$108 |
| Avg. Retention Rate (USA) |
68% |
81% |
Leveraging such data improves transparency with insurers and boosts trust with healthcare
providers. It’s also critical for monitoring compliance during price lockdowns or seasonal
surges.
By integrating this dataset with CRM tools, pharma companies can drive automated alerts on price
drops, competitor pricing, or demand fluctuations, resulting in better revenue predictability.
API-Based Monitoring: Online Pharmacy Price Monitoring API – USA & India
Scraping static pricing pages is no longer scalable. Businesses are now turning to dynamic APIs
like the Online Pharmacy Price Monitoring API – USA & India to gain real-time pricing feeds,
stock availability alerts, and location-based variations.
This integration enables AI-powered pricing decisions, especially when discount schemes,
cashback offers, or state-wise subsidy updates roll out. From 2022 to 2025, use of real-time
APIs led to 34% faster reaction time to competitor price cuts in India and 26% in the USA.
| Advantage |
India Impact |
USA Impact |
| Time to React to Price Drops |
2.1 Days → 0.9 Days |
1.8 Days → 1.2 Days |
| Price Change Alerts Accuracy |
+28% |
+24% |
This is particularly valuable for drugs with fluctuating ingredient costs or price-controlled
segments such as insulin and cancer medications. It also aids retailers during seasonal sales
like Diwali or Thanksgiving.
The availability of data via API ensures continuous sync with backend systems, reducing price
mismatch complaints and refund processing time.
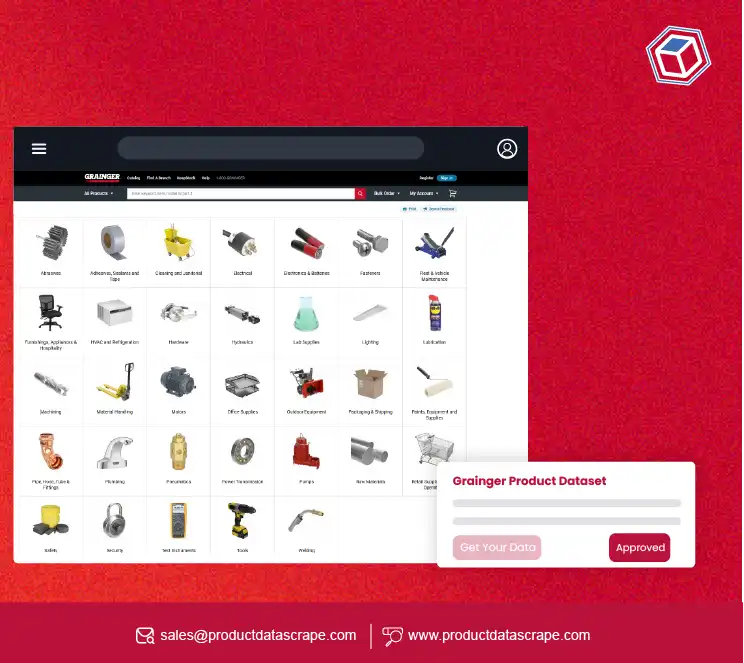
Custom Datasets & Advanced Use Cases
The need for Custom eCommerce Dataset Scraping has grown as pharma companies demand niche
datasets for specific disease categories or therapeutic segments. Use cases include scraping
drug reviews, extracting SKU-level metadata, and integrating with demand planning tools.
Platforms offering Web Scraping Pharma Websites deliver this agility. For instance, using tools
for web scraping using python , teams can extract prices, product codes, dosage info, and
availability filters from platforms like 1mg, Amazon Pharmacy, or Netmeds.
From 2020 to 2025, firms deploying custom datasets witnessed:
| Metric |
Before Custom Scraping |
After Custom Scraping |
| Forecasting Accuracy |
66% |
88% |
| Promotion ROI Uplift |
+14% |
+26% |
| SKU-level Margin Increase |
+9% |
+19% |
By building frameworks to scrape website data , brands can personalize pricing offers, adjust
fulfillment models, and forecast procurement needs more effectively.
Conclusion
The Pharmaceutical Pricing Dataset for USA & India Pharmacy Market is transforming how ePharmacy
platforms, manufacturers, and pricing regulators assess, plan, and deliver equitable healthcare
products. By applying advanced scraping techniques, APIs, and regional mapping, companies can
unlock pricing transparency and consumer affordability.
Whether the need is for real-time decision-making or historical market benchmarking, this
dataset unlocks multiple use cases—from regulatory compliance to competitive pricing strategies.
Looking to monitor drug pricing across borders in real time? Get started with Product Data
Scrape pharma dataset solutions today!