EXCLUSIVE DATA INTELLIGENCE REPORT · 1 MILLION LISTINGS · 30 DAYS · 42 CATEGORIES
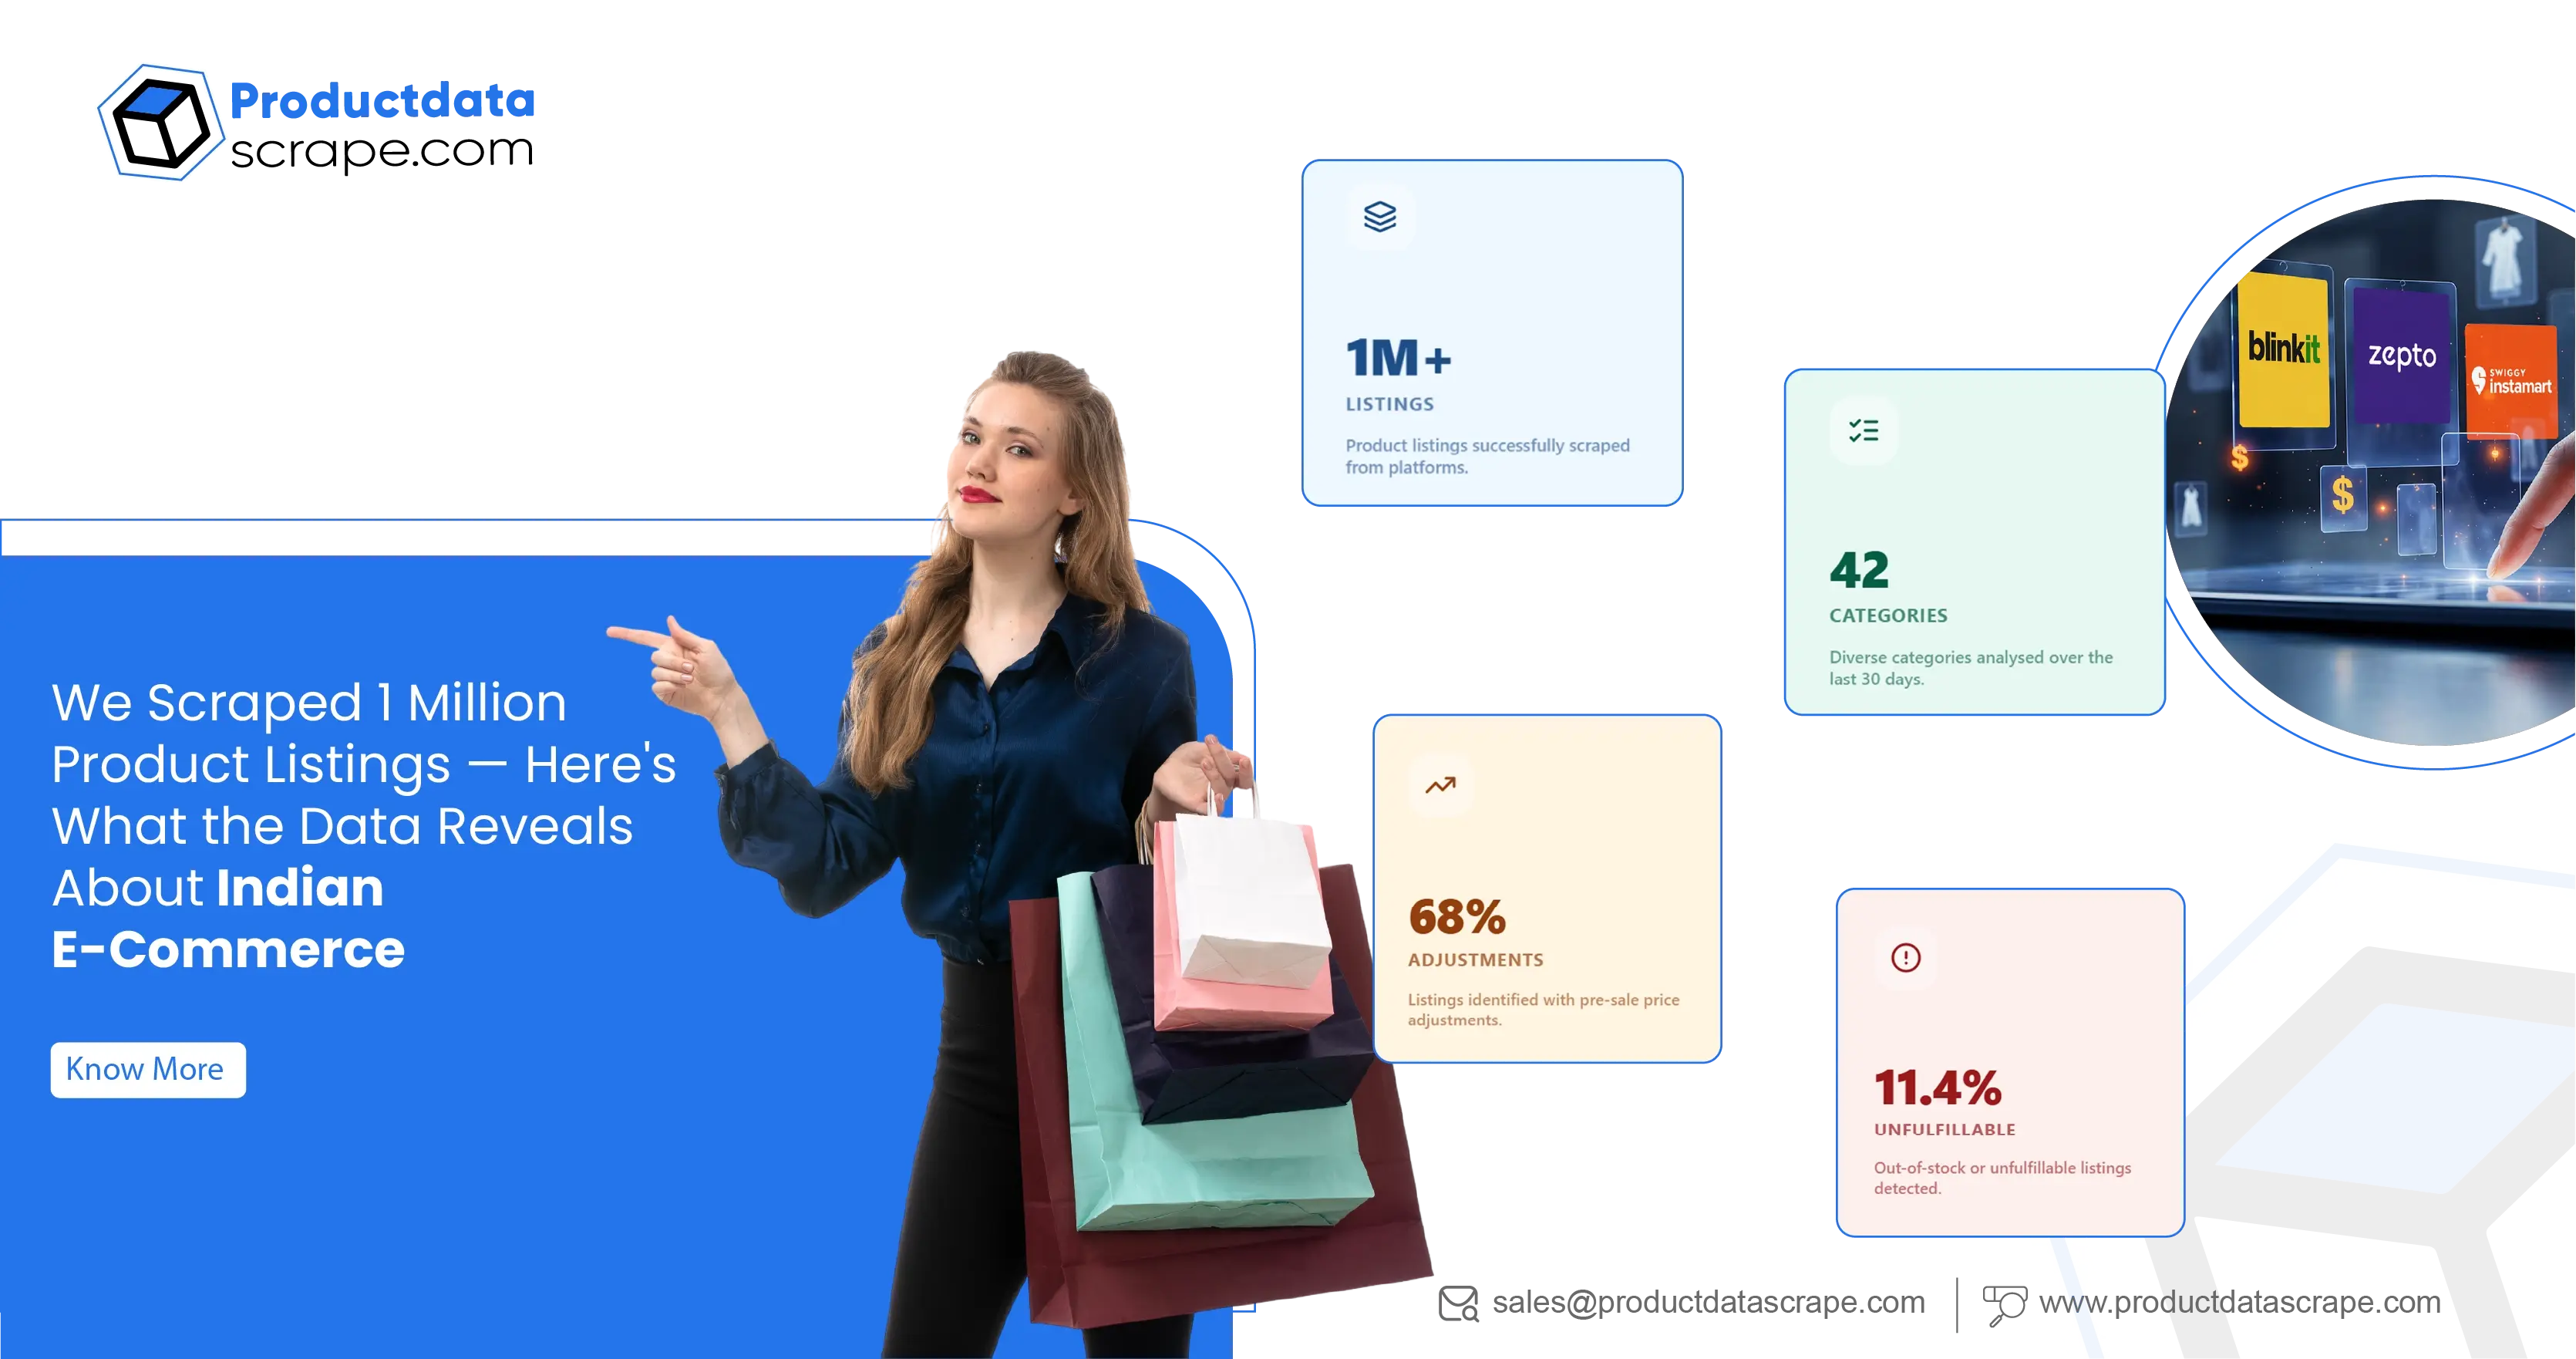
The most comprehensive Indian e-commerce listing intelligence report compiled from scraped data — revealing price inflation patterns, stock availability discrepancies, rating inconsistencies, and fee structures across Amazon, Flipkart, Myntra, Nykaa, Blinkit, Zepto & JioMart.
IMPORTANT DISCLAIMER: All findings and statistics presented in this report are based solely on publicly available product listing data collected from the platforms mentioned. This report does not allege intentional wrongdoing, fraud, or misconduct by any specific brand, seller, or platform. All patterns and observations are presented as data-derived findings for informational and market intelligence purposes only. Product Data Scrape makes no representations regarding the legal compliance or non-compliance of any brand's pricing practices. Readers should conduct independent verification before drawing any conclusions. This report should not be construed as legal advice.
1M+
Product listings scraped
42
Categories analysed over 30 days
68%
Listings with pre-sale price adjustments
11.4%
Unfulfillable stock listings detected
Product Data Scrape deployed its data scraping infrastructure across Amazon India, Flipkart, Myntra, Nykaa, Blinkit, Zepto, and JioMart for 30 consecutive days. One million product listings. Forty-two categories. Data captured from hundreds of brands — from emerging D2C companies to established FMCG names. This report presents what the scraped data shows, objectively and without attribution to any individual brand.
This is the most comprehensive Indian e-commerce listing intelligence analysis compiled from scraped publicly available data. Every statistic in this report is derived from our direct data collection infrastructure. Each listing capture included title, description, listed price, MRP, effective checkout price, rating, review count, stock availability status, seller identity, fulfilment type, and full listing history — providing a complete, timestamped dataset of marketplace listing behaviour across seven platforms over 30 days.
| Platform | Listings Scraped |
|---|---|
| Amazon India | 3,80,000+ |
| Flipkart | 2,60,000+ |
| Myntra | 1,40,000+ |
| Nykaa | 90,000+ |
| Blinkit | 60,000+ |
| Zepto | 40,000+ |
| JioMart | 30,000+ |
1. Pattern Detected: Pre-Sale Price Adjustments
Our scrapers tracked 1,20,000+ listings across Amazon and Flipkart for 30 days before and during major sale events. The data shows that 68% of products displaying significant sale discounts during Big Billion Day and Great Indian Festival periods had their listed reference prices adjusted upward by an average of Rs.340 in the 21 days preceding the sale window. This pattern was observed consistently across the electronics and fashion categories. Consumers and brands monitoring price history data may find this pattern useful when evaluating advertised discount depth.
Pattern observed in: Electronics & Fashion · Avg. reference price shift: Rs.340/SKU
2. Pattern Detected: Cross-Platform Price Variations on Identical SKUs
The same product — verified by matching barcode data, brand, model, and packaging specifications — was observed listed at prices varying by up to 34% across Amazon, Flipkart, Blinkit, and Nykaa on the same day. Our cross-platform price scraping identified 2,80,000 instances of identical SKUs carrying different prices across platforms simultaneously. This finding highlights the importance of cross-platform price comparison tools for both consumers and competing brands seeking accurate market pricing benchmarks.
Pattern observed in: FMCG & Personal Care · Max observed price variation: 34%
3. Pattern Detected: Rating Inconsistencies Across Near-Duplicate Listings
The data revealed 14,200 instances of near-duplicate listings — products with highly similar titles, images, and specifications listed under different listing IDs by the same brand — where review distribution varied significantly across the duplicates. In the personal care and electronics categories, primary listings showed average ratings 0.6 to 0.8 stars higher than the aggregate rating when all near-duplicate listing reviews were consolidated. This observation is presented as a data pattern and does not attribute intentional conduct to any brand.
Pattern observed in: Personal Care & Electronics · Rating variance: 0.6–0.8 stars
4. Pattern Detected: Stock Availability Signal Discrepancies
11.4% of all listings scraped across quick commerce and marketplace platforms displayed an in-stock availability status but could not be fulfilled when order placement was tested. These stock signal discrepancies were observed most frequently in quick commerce platforms. The data suggests a gap between displayed availability status and actual fulfilment readiness for a measurable portion of active listings — a signal relevant to brands monitoring competitor availability accuracy and search visibility patterns.
Pattern observed in: Quick Commerce platforms · Discrepancy rate: 11.4% of all listings
5. Pattern Detected: Effective Checkout Price Divergence from Listed Price
Platform fees, handling charges, convenience fees, and minimum order thresholds varied by up to Rs.89 per order across platforms for comparable basket values. These additional charges appear at checkout and are not reflected in listing-level price displays. Our end-to-end price scraping — which captures the effective checkout price rather than just the listed price — found that the lowest listed price corresponded to the lowest effective delivered price in only 61% of cases across the dataset.
Pattern observed in: All categories · Listed price = lowest delivered price: only 61% of cases<< /p>
| Data Pattern Observed | Measured Stat | Category Most Observed In |
|---|---|---|
| Pre-sale reference price adjustments | 68% of sale listings | Electronics & Fashion |
| Cross-platform same-SKU price variation | Up to 34% | FMCG & Personal Care |
| Stock availability signal discrepancies | 11.4% of listings | Quick Commerce |
| Rating inconsistencies — near-duplicate listings | 14,200 instances | Personal Care & Electronics |
| Listed price vs. effective checkout price gap | 39% of cases | All categories |
| Avg. pre-sale reference price adjustment observed | Rs.340 per SKU | Fashion & Home |
| Cross-platform same-SKU price instances detected | 2,80,000+ instances | FMCG Staples |
| MAP pricing discrepancies detected — D2C listings | 43% of D2C brands | D2C across all platforms |
The patterns identified in this dataset have practical implications for any brand operating across Indian e-commerce platforms. When reference price adjustments ahead of sale events are widespread across a category, consumer price anchoring shifts — affecting how your own pricing and discount depth is perceived, regardless of your brand's individual practices. When cross-platform price variation is common in your category, consumers who multi-platform shop may develop different price expectations that affect conversion rates on any single platform.
Similarly, when stock availability signal discrepancies are common in a category, platform search algorithms that factor in availability signals may rank listings inconsistently — creating search visibility outcomes that do not purely reflect genuine stock depth. Product Data Scrape's listing intelligence platform tracks all five of these data patterns in real time across every major Indian marketplace — enabling brands to monitor category-level trends, benchmark their own listing performance, and respond to market shifts backed by objective scraped data.
Understanding these marketplace-wide data patterns is not about attributing specific conduct to any competitor. It is about giving your brand the objective, data-verified intelligence needed to make pricing, inventory, and listing strategy decisions that are grounded in what the market actually shows — not what competitors choose to report.
PRE-SALE PRICE MONITORING
Track reference price changes 21 days early
Product Data Scrape's historical price tracking database captures daily listing price changes — giving brands visibility into reference price movement patterns in their category up to 21 days before sale events. Use this data to benchmark your own pricing decisions against observed market patterns.
CROSS-PLATFORM PRICE INTELLIGENCE
Monitor your SKUs across all platforms simultaneously
Our cross-platform SKU matching engine tracks every listing of your brand's products and competitor products across Amazon, Flipkart, Nykaa, Blinkit, Zepto, and JioMart simultaneously — identifying price variation patterns and MAP discrepancy instances in real time with structured data output.
STOCK AVAILABILITY MONITORING
Detect fulfilment discrepancy patterns
Product Data Scrape's availability monitoring goes beyond scraping the in-stock label. We track fulfilment signal consistency for monitored SKUs — flagging listings where availability status and actual order fulfilment diverge, providing brands with accurate competitor stock intelligence.
LISTING & RATING INTELLIGENCE
Track near-duplicate listings and review distribution
Our listing analysis engine identifies near-duplicate product listings across platforms — tracking review distribution patterns and rating consistency to give your brand an accurate competitive rating benchmark based on comprehensive listing data rather than primary listing data alone.
Over 30 days, Product Data Scrape's scraping infrastructure extracted publicly available listing data from Amazon India, Flipkart, Myntra, Nykaa, Blinkit, Zepto, and JioMart across 42 product categories. Each listing capture included title, description, price, MRP, effective checkout price, rating, review count, stock status, seller identity, fulfilment type, and listing history. Data was captured at 4-hour intervals during standard hours and at 1-hour intervals during identified sale event windows.
Our cross-platform SKU matching engine reconciled identical products across different platforms using a combination of barcode data, product title normalisation, image hash comparison, and brand-model string matching — achieving a 94.7% accurate cross-platform match rate across the full dataset. All data collected is publicly available listing data accessible to any user of these platforms. No proprietary, private, or confidential data was accessed in the preparation of this report.
All findings are presented as observed data patterns. This report does not attribute specific conduct to any named brand, seller, or platform. Product Data Scrape's listing intelligence datasets are available via structured API output for brands, market research firms, and analysts conducting marketplace benchmarking and competitive intelligence research.
WHY CHOOSE US?
Choose Product Data Scrape to access accurate data, enhance decision-making, and boost your online sales strategy effectively.

With our Retail Data scraping services, you gain reliable insights that empower you to make informed decisions based on accurate product data and market trends.

We help you extract Retail Data product data efficiently, streamlining your processes to ensure timely access to crucial market information and operational speed.

By leveraging our Retail Data scraping, you can quickly adapt to market changes, giving you a competitive edge with real-time analysis and responsive strategies.

Our Retail Data price monitoring tools enable you to stay competitive by adjusting prices dynamically, attracting customers while maximizing your profits effectively.

THIS IS YOUR KEY BENEFIT.
With our competitive price tracking, you can analyze market positioning
and adjust your strategies, responding effectively to competitor
actions and pricing in real-time.

Utilizing our Retail Data review scraping, you gain valuable customer insights that help you improve product offerings and enhance overall customer satisfaction.

Begin by selecting the e-commerce websites you want to scrape, focusing on those that provide the most valuable data for your needs.

Determine the specific data points to extract, such as product names, prices, descriptions, and reviews, to ensure comprehensive insights.

Utilize web scraping tools or libraries to automate the data extraction process, ensuring efficiency and accuracy in gathering the desired information.

After extraction, clean the data to remove duplicates and irrelevant information, ensuring that the dataset is organized and useful for analysis.

Once cleaned, analyze the extracted e-commerce data to gain insights, identify trends, and make informed decisions that enhance your strategy.


Discover how our clients achieved success with us.
“I used Product Data Scrape to extract Walmart fashion product data, and the results were outstanding. Real-time insights into pricing, trends, and inventory helped me refine my strategy and achieve a 6X increase in conversions. It gave me the competitive edge I needed in the fashion category.”


“Through Kroger sales data extraction with Product Data Scrape, we unlocked actionable pricing and promotion insights, achieving a 7X Sales Velocity Boost while maximizing conversions and driving sustainable growth.”


"By using Product Data Scrape to scrape GoPuff prices data, we accelerated our pricing decisions by 4X, improving margins and customer satisfaction."

"Implementing liquor data scraping allowed us to track competitor offerings and optimize assortments. Within three quarters, we achieved a 3X improvement in sales!"

The Resource Center offers up-to-date case studies, insightful blogs, detailed research reports, and engaging infographics to help you explore valuable insights and data-driven trends effectively.
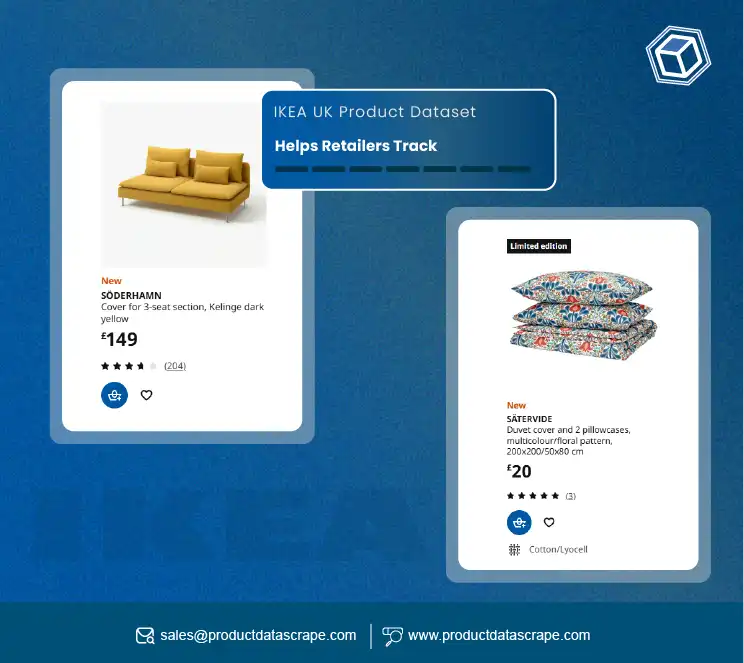
Access IKEA UK Product Dataset to analyze pricing, inventory, product catalogs, and retail trends for smarter business decisions.
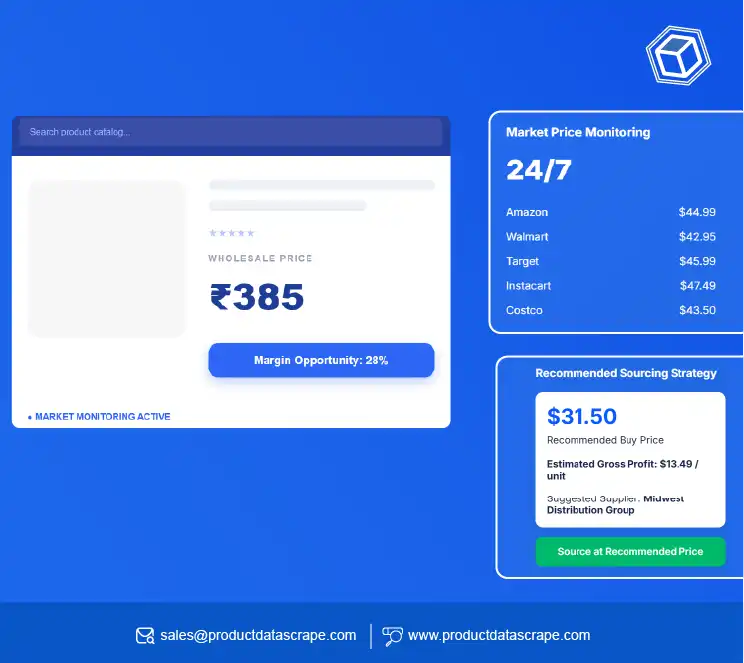
Discover how small retailers use quick-commerce pricing data to optimize pricing, track competitors, improve margins, and boost sales.
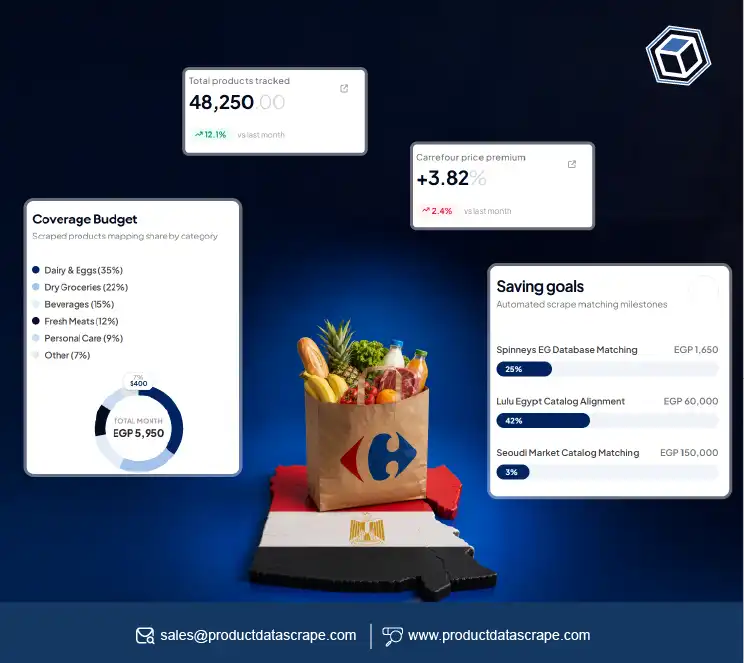
Scrape Carrefour Egypt Prices for Product-Substitution Features to track pricing, alternatives, stock availability, and retail insights.
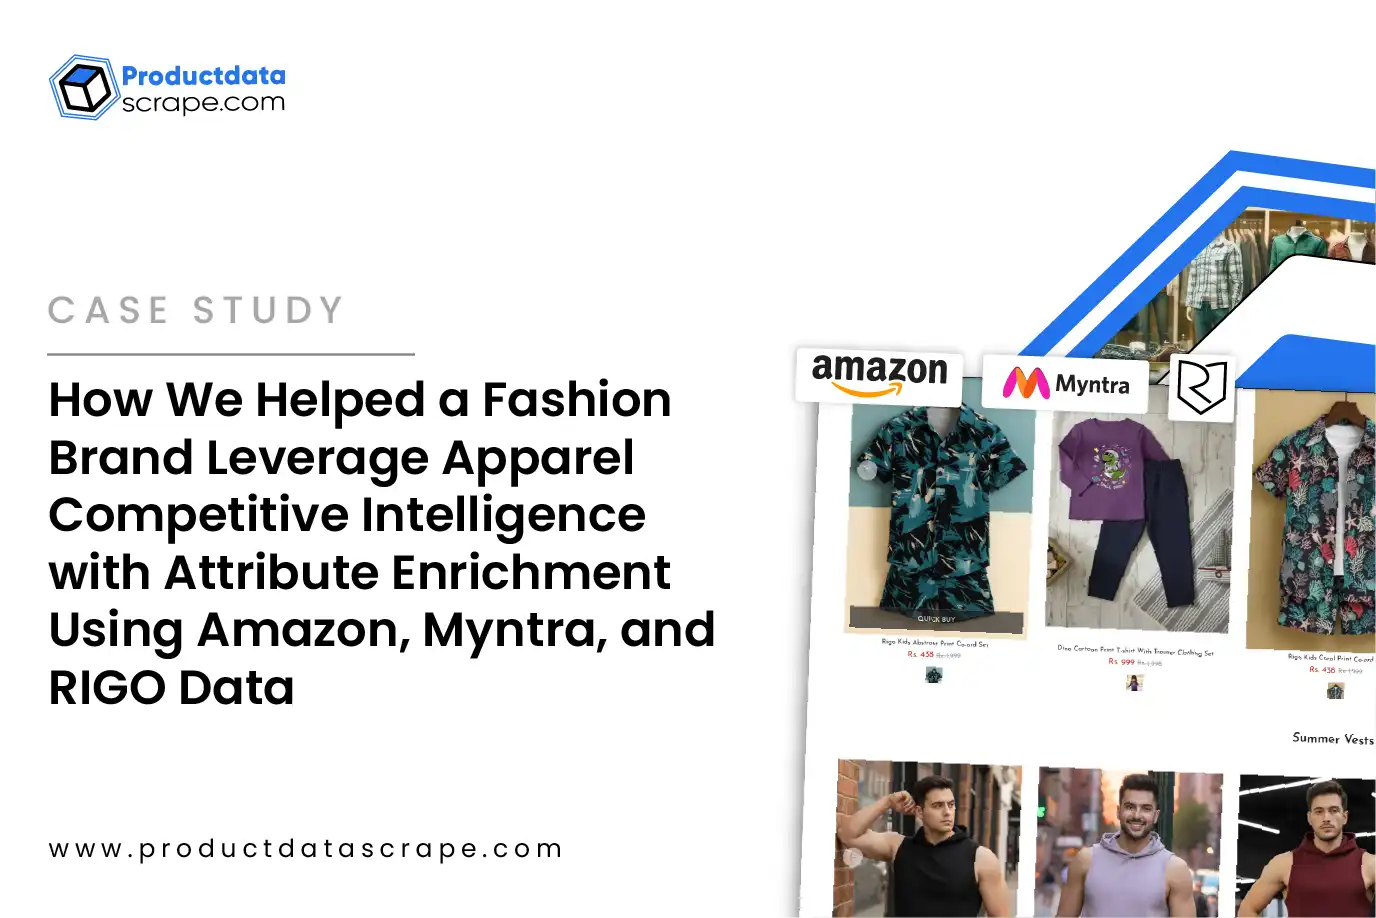
Gain Apparel Competitive Intelligence with Attribute Enrichment to track products, pricing, attributes, and trends across leading fashion marketplaces.
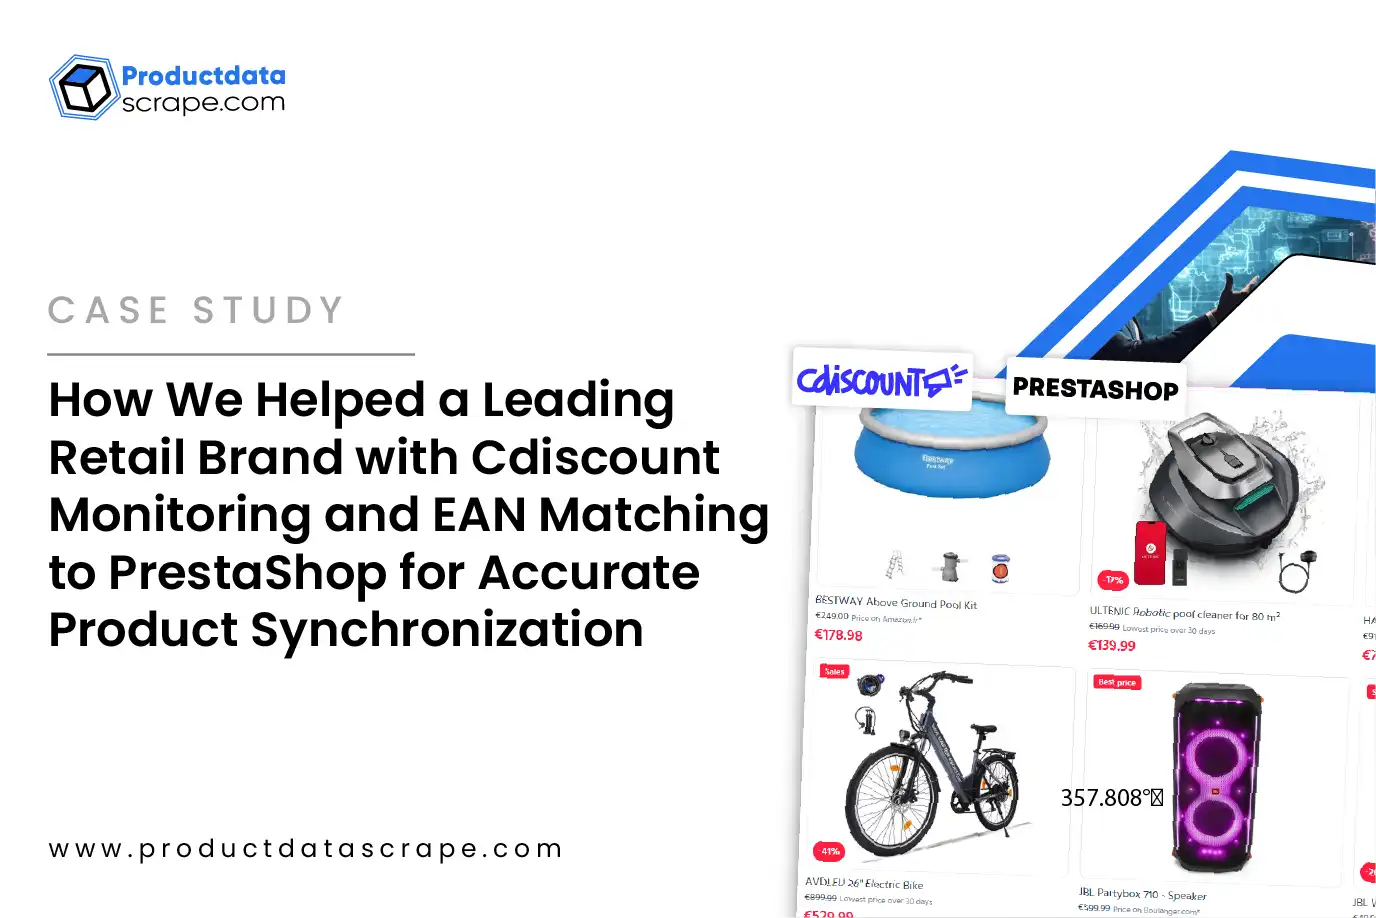
Optimize catalog accuracy with Cdiscount Monitoring and EAN Matching to PrestaShop for seamless product matching and real-time updates.
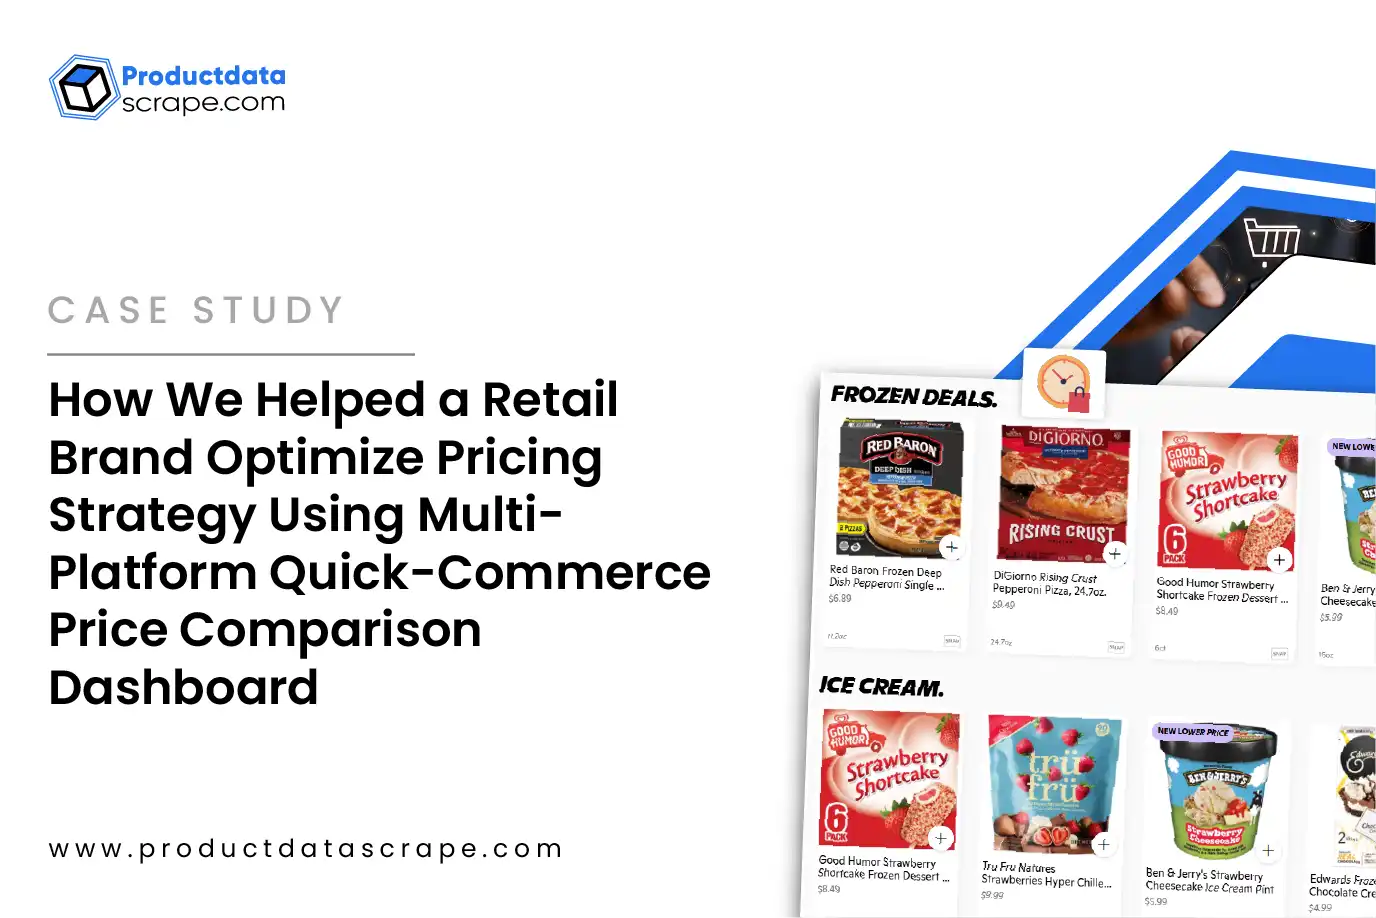
Optimize pricing decisions with a Multi-Platform Quick-Commerce Price-Comparison Dashboard for real-time insights, speed, and competitive advantage.
ASDA Grocery Data Scraping helps track grocery prices, promotions, inventory, and competitor trends across the UK retail market.
Costco Alcohol & Liquor Price Data scraping helps brands track pricing, promotions, inventory trends, and competitor insights.
B&M Stores Pet Supplies Data Scraping helps businesses collect pricing, stock, and product insights to optimize pet retail strategies.
Analyzed Myntra and AJIO customer review datasets to identify sizing issues, helping brands reduce garment return rates by 8% through data-driven insights.
Before vs After Web Scraping: See how e-commerce brands boost growth with real-time data, pricing insights, product tracking, and smarter digital decisions.
Easily scrape data from any eCommerce website to track prices, monitor competitors, and analyze product trends in real time with Real Data API.
Fresh Citrus Price Wars — Coles vs Aldi: data-driven comparison of prices, trends, and savings to see which retailer wins on value for shoppers.
Retail Inflation 2025 – Comparing Grocery Baskets in Dubai vs. Abu Dhabi (Noon) highlights price differences and real-world grocery costs across UAE cities.
Scrape Pinduoduo bestseller data to analyze top-selling products, pricing trends, sales performance, for smarter eCommerce and intelligence decisions.
Our E-commerce data scraping FAQs provide clear answers to common questions, helping you understand the process and its benefits effectively.
See the exact fields, accuracy and format — for your products, on your target sites — before you spend a rupee or a dollar.


.webp)


