
Introduction
The UAE retail ecosystem has transformed rapidly over the past five years, with pricing dynamics shifting at unprecedented speed across hypermarkets, grocery chains, and digital commerce platforms. As brands and retailers continue adjusting to fluctuating demand patterns, inflation cycles, and competitive disruptions, the need for structured retail intelligence has intensified. Businesses now depend on precise market-level insights to track product movements, benchmark competitors, and optimize revenue strategies. This research report explores how the practice of Scraping UAE Retail Prices supports data-driven decision-making, while emphasizing the role of structured collection pipelines such as Web Data Intelligence API in maintaining accuracy and scalability.
By analyzing pricing trends across physical and online channels, we uncover multi-dimensional patterns shaping consumer behavior and retailer actions between 2020 and 2025. The sections ahead highlight actionable insights on supermarkets, marketplaces, FMCG datasets, and real-time monitoring frameworks designed for manufacturers, distributors, analysts, and pricing teams.
Market Dynamics Through Instant Price Visibility
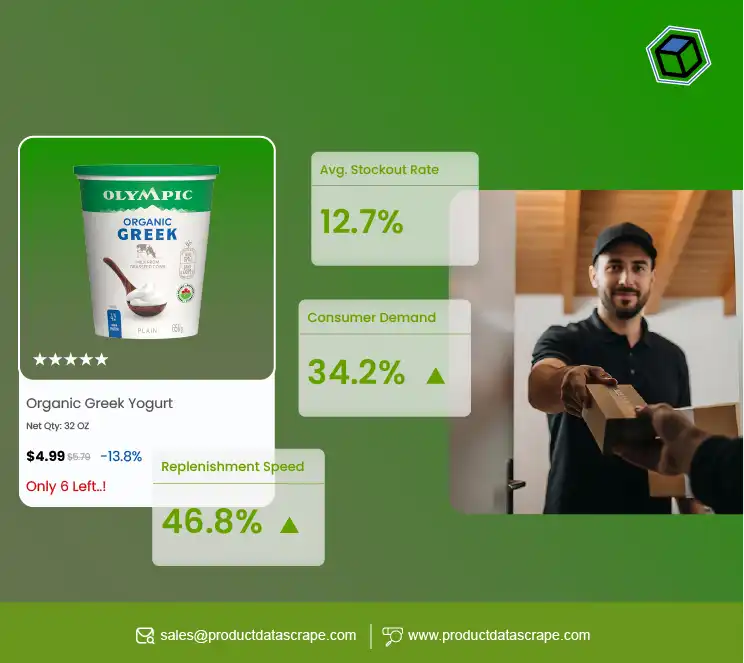
Gaining uninterrupted visibility into retail price changes has become essential for brands competing in categories like FMCG, personal care, beverages, and household essentials. With consumer spending patterns influenced by seasonal campaigns, local festivals, and supplier pricing adjustments, the value of Real-Time Data from Supermarkets & Online Marketplaces lies in instantly detecting shifts that affect revenue. Continuous data extraction helps quantify promotional cycles, SKU assortment variations, stock refresh timings, and competitive reactions.
UAE Retail Pricing Trends (2020–2025)
| Year |
Avg. Monthly Price Volatility (%) |
Online Channel Share (%) |
Supermarket Digitization Rate (%) |
| 2020 | 6.2 | 18 | 35 |
| 2021 | 7.4 | 26 | 48 |
| 2022 | 8.1 | 33 | 57 |
| 2023 | 9.3 | 38 | 69 |
| 2024 | 10.7 | 44 | 76 |
| 2025* | 11.2 | 49 | 82 |
These numbers illustrate how digitization is accelerating competitive intensity. As online share approaches 50%, brands rely heavily on live pricing analysis to prevent margin erosion. Supermarkets have increased API-driven listing automation, making continuous extraction essential for market tracking.
Tracking Structure and Pricing Across Major Retail Chains
Dubai’s retail landscape is dominated by organized supermarket chains, each following distinct pricing patterns and promotion calendars. Understanding how these chains behave—discount rhythms, category expansion, price sensitivity—helps brands forecast pricing elasticity and manage SKU availability. Projects that Extract Top 12 Supermarket Chains in Dubai reveal granular differences between premium, mid-range, and value-driven retailers.
Dubai Supermarket Comparison (2020–2025)
.webp)
| Year |
Avg. SKU Count per Store |
In-Store Promo Frequency (%) |
Private Label Share (%) |
| 2020 | 8,500 | 22 | 14 |
| 2021 | 9,200 | 27 | 16 |
| 2022 | 10,100 | 31 | 19 |
| 2023 | 11,000 | 35 | 22 |
| 2024 | 11,900 | 39 | 24 |
| 2025* | 12,300 | 42 | 25 |
Accurate extraction exposes how private labels expanded steadily post-2021, compressing prices in essential categories. The top chains also increased SKU depth, widening competition for multinational FMCG brands. Retailers now differentiate through exclusive imports and hyper-targeted promotions, all detectable through structured data scraping.
Continuous Tracking for Retail Decision-Making
Market volatility across the UAE has increased, resulting in higher demand for technologies that allow brands to track fluctuations in real time. A structured UAE price monitoring service enables enterprises to measure competitor activity, detect margin pressure, and predict promotional strategy outcomes. For pricing analysts, continuous visibility helps avoid underpricing, over-discounting, and misaligned channel strategies.
Price Monitoring Adoption (2020–2025)
| Year |
Brands Using Automated Tracking (%) |
Avg. Daily Scrape Volume (SKUs) |
Adoption Growth Rate (%) |
| 2020 | 12 | 50,000 | — |
| 2021 | 20 | 120,000 | 67 |
| 2022 | 34 | 240,000 | 58 |
| 2023 | 46 | 370,000 | 54 |
| 2024 | 59 | 510,000 | 46 |
| 2025* | 68 | 650,000 | 39 |
The UAE’s advanced retail technology environment ensures rapid adoption of automated price tracking solutions. Growth is driven by FMCG companies requiring competitive parity during peak shopping periods such as Ramadan, Dubai Shopping Festival, and end-of-year campaigns.
Understanding Digital Marketplace Pricing Behaviour
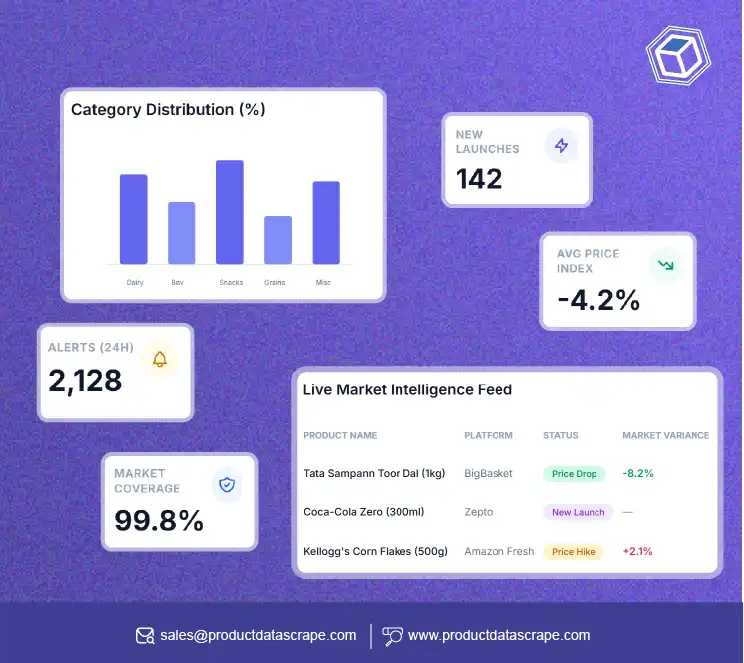
E-commerce platforms host millions of product listings that change dynamically based on competition, seller performance, shipping patterns, and promotional mechanics. Brands rely on Online marketplace pricing intelligence to evaluate seller density, discount clusters, algorithm-driven repricing, and stock velocity. These insights reveal which categories face the highest competition and where brands must adjust their listing strategy.
Marketplace Pricing Indicators (2020–2025)
.webp)
| Year |
Avg. Seller Count per Product |
Daily Price Revision Frequency |
Discounted Listings (%) |
| 2020 | 3.1 | 1.8 | 27 |
| 2021 | 4.4 | 2.6 | 32 |
| 2022 | 5.8 | 3.3 | 39 |
| 2023 | 7.0 | 4.2 | 45 |
| 2024 | 7.6 | 4.8 | 49 |
| 2025* | 8.2 | 5.1 | 52 |
The data shows an increasing number of sellers per product, intensifying price wars. Daily price revisions doubled from 2020 to 2025, forcing brands to adopt automated pricing strategies.
Mapping Growth of Quick Commerce Channels
Quick commerce has reshaped last-mile grocery delivery in the UAE by offering ultra-fast fulfilment and hyper-localized inventory models. Data projects that Extract FMCG Data from UAE Quick Commerce reveal SKU variations, surge pricing patterns, instant delivery charges, and localized demand pockets. These insights help brands understand real-time consumer preferences and micro-market behavior.
Quick Commerce Expansion (2020–2025)
| Year |
Avg. Delivery Time (Minutes) |
FMCG SKU Count per Dark Store |
Demand Growth (%) |
| 2020 | 55 | 2,200 | — |
| 2021 | 35 | 2,950 | 48 |
| 2022 | 25 | 3,700 | 39 |
| 2023 | 19 | 4,200 | 32 |
| 2024 | 16 | 4,700 | 27 |
| 2025* | 14 | 5,100 | 24 |
Consumers increasingly prefer convenience-first shopping, driving retailers to expand micro-fulfillment and predictive inventory systems. Quick commerce provides some of the fastest-moving data signals in the UAE retail environment.
Automating Retail Intelligence Through API Systems
Enterprises looking to scale their data operations depend on unified pipelines such as an E-commerce marketplace data scraping API UAE to collect price, stock, rating, delivery, and seller metadata. API-driven automation ensures faster ingestion of structured datasets for analytics workflows, helping teams reduce manual errors and improve forecasting accuracy.
API Data Extraction Metrics (2020–2025)
.webp)
| Year |
Avg. Automated Data Points/Day |
API Reliability (%) |
Integration Speed (Days) |
| 2020 | 0.8M | 93 | 14 |
| 2021 | 1.5M | 95 | 11 |
| 2022 | 2.8M | 97 | 9 |
| 2023 | 4.1M | 98 | 7 |
| 2024 | 5.6M | 99 | 5 |
| 2025* | 6.3M | 99.4 | 4 |
APIs allow near real-time synchronization across multiple retail endpoints. This reliability ensures enterprises maintain consistent datasets for pricing, competition mapping, and inventory forecasting.
Why Choose Product Data Scrape?
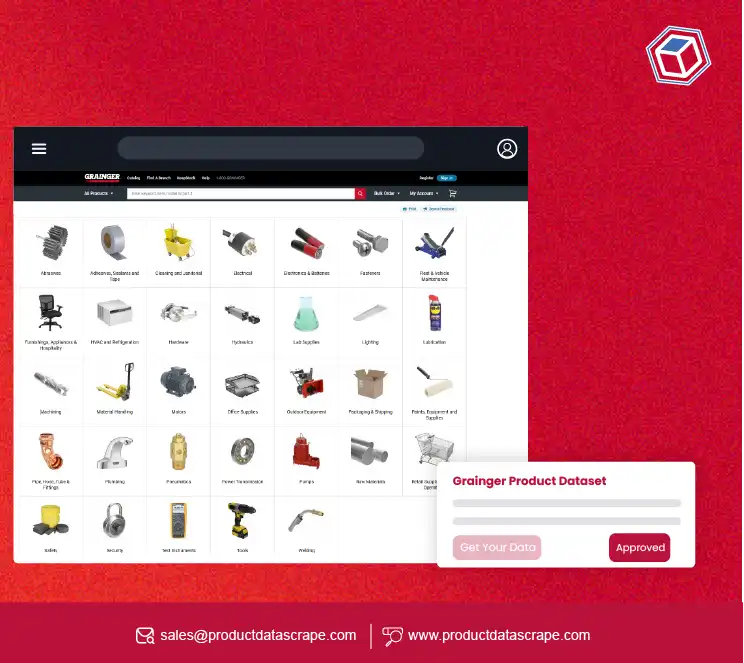
Product Data Scrape simplifies large-scale retail intelligence by delivering end-to-end solutions for pricing, assortment, stock, and competitor tracking. Whether analyzing brick-and-mortar supermarkets or high-velocity e-commerce channels, PDS ensures complete coverage and high-fidelity datasets. With capabilities that Extract Grocery & Gourmet Food Data, the platform becomes a single source of truth for analytics teams.
Its workflows include automated scraping, API delivery, dashboard visualizations, competitive benchmarking, historical trend mapping, and marketplace intelligence—empowering FMCG, retail, distribution, consulting, and revenue strategy teams to operate more efficiently across the UAE retail ecosystem.
Conclusion
The UAE’s evolving retail landscape demands structured market intelligence, particularly for brands competing across supermarkets, e-commerce platforms, and quick commerce networks. By integrating unified systems for Scraping UAE Retail Prices, businesses can maintain competitive pricing, understand consumer shifts, improve sales forecasting, and drive sustainable growth.
Get high-quality UAE retail datasets, custom APIs, and competitive intelligence dashboards—contact Product Data Scrape today to begin your data-driven transformation.


.webp)


