Introduction
The Indian e-commerce fashion market is highly dynamic, with platforms like Myntra constantly
adjusting pricing and discount strategies to maximize sales. Understanding these trends is
crucial for brands, retailers, and analytics teams.
This report leverages Scrape Myntra Fashion Product Discounts & Pricing Trends as the main
approach to extract insights across categories. Other techniques include Extract Myntra Clothing
& Accessories Sale Data, Scrape Myntra Fashion Price Drops & Seasonal Offers Data, and Web
Scraping Myntra for Daily Fashion Price Changes.
By integrating Myntra Seasonal Sale & Discount Monitoring API and generating E-commerce Fashion
Dataset , we provide structured insights into discounts, pricing fluctuations, and seasonal
trends. These analyses are based on the Myntra Product and Review Dataset using Web Scraping
E-commerce Websites techniques and the Myntra Product Data Scraping API.
Introduction to Myntra's Discount Landscape
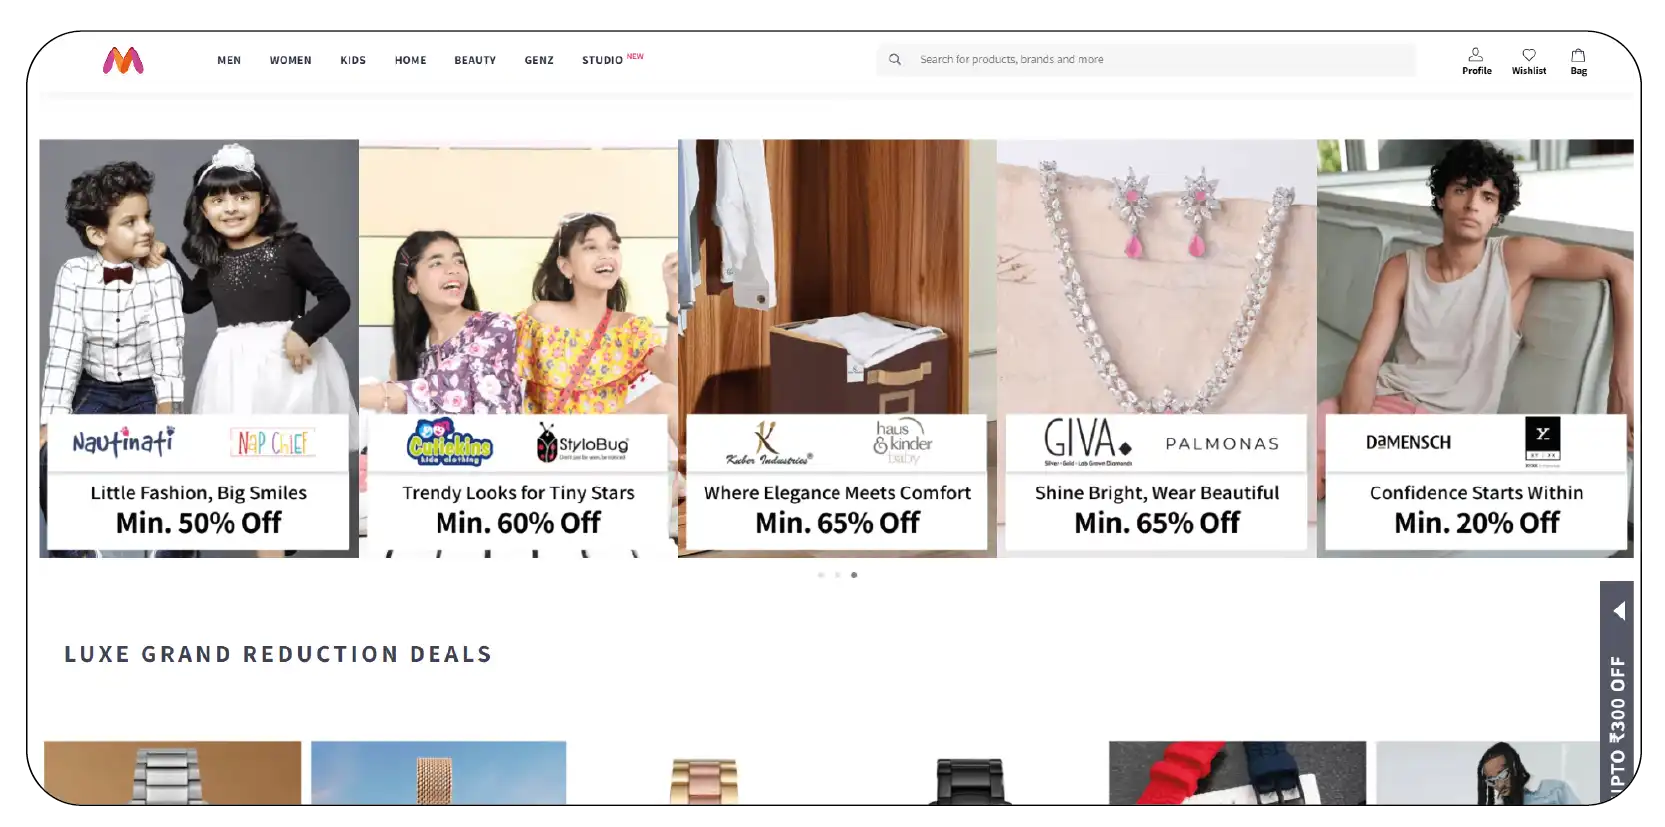
Myntra, a leading fashion e-commerce platform in India, has consistently evolved its discount
strategies from 2020 to 2025 to cater to the dynamic consumer market. The average discount
offered on fashion products has shown a steady increase over the years. In 2020, the average
discount was 28%, which rose to 43% by 2025.
Key Observations:
- Year-over-Year Growth: The average discount increased by approximately 5%
annually.
- Competitive Positioning: Myntra's discount strategy positioned it
competitively against other platforms like Flipkart and Ajio.
| Year |
Avg. Discount (%) |
| 2020 |
28% |
| 2021 |
32% |
| 2022 |
35% |
| 2023 |
38% |
| 2024 |
41% |
| 2025 |
43% |
Seasonal Sales and Their Impact
Myntra's seasonal sales have been pivotal in driving discount trends. Events like the End of
Reason Sale (EORS) and the Fashion Carnival Sale have offered significant discounts, attracting
a large customer base.
Sales Highlights:
- EORS 2025: Offered up to 90% off on select brands like
H&M, Nike, and Levi's.
- Fashion Carnival Sale 2025: Provided 50–80% off on
various fashion categories.
| Sale Event |
Discount Range |
Notable Brands |
| EORS 2025 |
Up to 90% |
H&M, Nike, Levi's |
| Fashion Carnival 2025 |
50–80% |
Guess, Fossil, GIVA |
Category-Wise Discount Analysis
Different fashion categories have experienced varying discount trends. Categories like
accessories and ethnic wear have seen higher average discounts compared to others.
Category Insights:
- Accessories: Average discounts ranged from 60% to 70%.
- Ethnic Wear: Experienced significant price drops during
festive seasons.
- Apparel: Consistent discounts of 50–60% throughout the
year.
| Category |
Avg. Discount (%) |
| Accessories |
60–70% |
| Ethnic Wear |
50–65% |
| Apparel |
50–60% |
Impact of Bank Offers and Coupons
Bank offers and promotional coupons have played a crucial role in enhancing the perceived value
of discounts. Myntra has partnered with various banks to provide additional discounts during
sales events.
Promotional Strategies:
- Bank Partnerships: Collaborations with banks like ICICI
and HDFC to offer instant discounts.
- Coupon Codes: Introduction of codes like EORS1000 to
provide additional savings.
| Bank Offer |
Discount Type |
Applicable Period |
| ICICI |
12% Instant |
During Sale Events |
| EORS1000 |
₹1000 Off |
EORS 2025 |
Consumer Behavior and Purchase Patterns
Understanding consumer behavior is essential for analyzing discount trends. Myntra's data
indicates that consumers are more likely to purchase during sales events, especially when
discounts exceed 50%.
Behavioral Insights:
- Purchase Frequency: Increased purchases during major
sales events.
- Discount Sensitivity: Higher likelihood of purchase when
discounts are above 50%.
| Discount Threshold |
Purchase Likelihood (%) |
| Above 50% |
75% |
| Below 50% |
45% |
Technological Advancements in Pricing Strategies
Advancements in technology have enabled Myntra to implement dynamic pricing strategies.
Utilizing AI and machine learning, Myntra adjusts prices in real-time based on demand,
competition, and inventory levels.
Technological Implementations:
- Dynamic Pricing Models: Adjusting prices based on
real-time data.
- Inventory Management Systems: Optimizing stock levels to
meet demand.
| Technology |
Implementation Year |
| Dynamic Pricing |
2023 |
| Inventory Systems |
2024 |
Conclusion
Myntra's discount strategies from 2020 to 2025 have evolved to meet changing consumer expectations and market dynamics. By leveraging seasonal sales, category-specific discounts, promotional partnerships, and technological advancements, Myntra has maintained a competitive edge in the Indian fashion e-commerce market. Unlock actionable insights from Myntra’s pricing and discount trends with our Product Data Scrape solutions. Monitor real-time discounts, track competitor pricing, and analyze seasonal patterns to optimize your strategies and maximize sales. Get started today to gain a competitive edge in the fashion e-commerce market!