Quick Overview
This case study highlights how Product Data Scrape enabled Real-Time Shrinkflation Tracking Using Grocery SKU Data for a U.S.-based consumer intelligence firm operating in retail analytics and Product Marketplace Selling Services. Over a 7 month engagement, our team delivered automated SKU-level tracking across Walmart, Target, Kroger, Costco, Publix, and Safeway. By monitoring pack-size changes alongside price-per-unit movements, the solution uncovered hidden margin erosion. The project delivered measurable impact, including the detection of 312 pack-size reductions, a 45% improvement in data refresh speed, and significantly higher pricing confidence for downstream brand and retailer decisions.
The Client
The client is a U.S. consumer and market intelligence provider supporting FMCG brands, private-label manufacturers, retail consultancies, and pricing strategy teams. Their customers rely heavily on accurate, SKU-level data to understand how pricing, packaging, and assortment decisions affect profitability and consumer perception across national grocery chains.
In recent years, inflation-driven cost pressures pushed brands and retailers to adopt shrinkflation—reducing pack sizes while holding or increasing shelf prices. This trend quickly became a major topic in mainstream media, regulatory discussions, and consumer advocacy reports. Public scrutiny increased, and brands faced reputational risk if shrinkflation strategies were not carefully managed or transparently justified.
Before partnering with Product Data Scrape, the client relied on a mix of retailer-provided feeds, periodic audits, and manual spot checks to identify changes in product size and pricing. These processes were slow, inconsistent, and limited in scale. Analysts could only review a small subset of SKUs, often weeks after changes had already impacted the market.
Without a unified Shrinkflation Tracking Data Scraping API, it was difficult to correlate pack-size reductions with price-per-unit changes across retailers. The lack of automation also made it nearly impossible to track trends across Walmart, Target, Kroger, Costco, Publix, and Safeway simultaneously.
Transformation became essential as rapid promotions, private-label expansion, and quick commerce accelerated SKU churn. To remain competitive, the client needed continuous visibility powered by Quick Commerce Grocery & FMCG Data Scraping, enabling proactive insights instead of reactive reporting.
Goals & Objectives
The business goal was to establish a scalable, real-time shrinkflation monitoring framework across major U.S. grocery chains. The client needed fast, accurate detection of pack-size reductions and price-per-unit changes to support brand strategy and regulatory analysis.
On the technical side, the objective was to fully automate data extraction, normalization, and comparison across retailers. This included Grocery Shrinkflation Detection Using Web Scraping and structured monitoring of SKU attributes across chains identified in Extract Top 10 Largest Grocery Chains in USA 2025.
Detect pack-size changes within 24 hours
Improve SKU coverage across national retailers
Reduce manual validation effort by over 60%
Increase accuracy of unit-price comparisons
The Core Challenge

The client faced multiple operational bottlenecks. Retailers frequently changed product descriptions, units of measure, and packaging formats, making manual comparison unreliable. Existing systems could track prices but failed to consistently capture pack-size changes at scale.
Performance issues also surfaced as SKU volumes increased into the tens of thousands. Delayed updates meant shrinkflation events were often identified weeks after they occurred. This directly affected the quality of insights delivered to brands and policy analysts.
Another challenge was differentiating true inflation from shrinkflation. Without a reliable Inflation vs Shrinkflation Analytics Data Scraper, price increases were often misclassified. The lack of a centralized Web Data Intelligence API slowed analysis and reduced confidence in reported findings.
Our Solution

Product Data Scrape designed a phased, automation-driven solution purpose-built for large-scale shrinkflation analysis across U.S. supermarkets.
Phase 1: Retailer & SKU Mapping
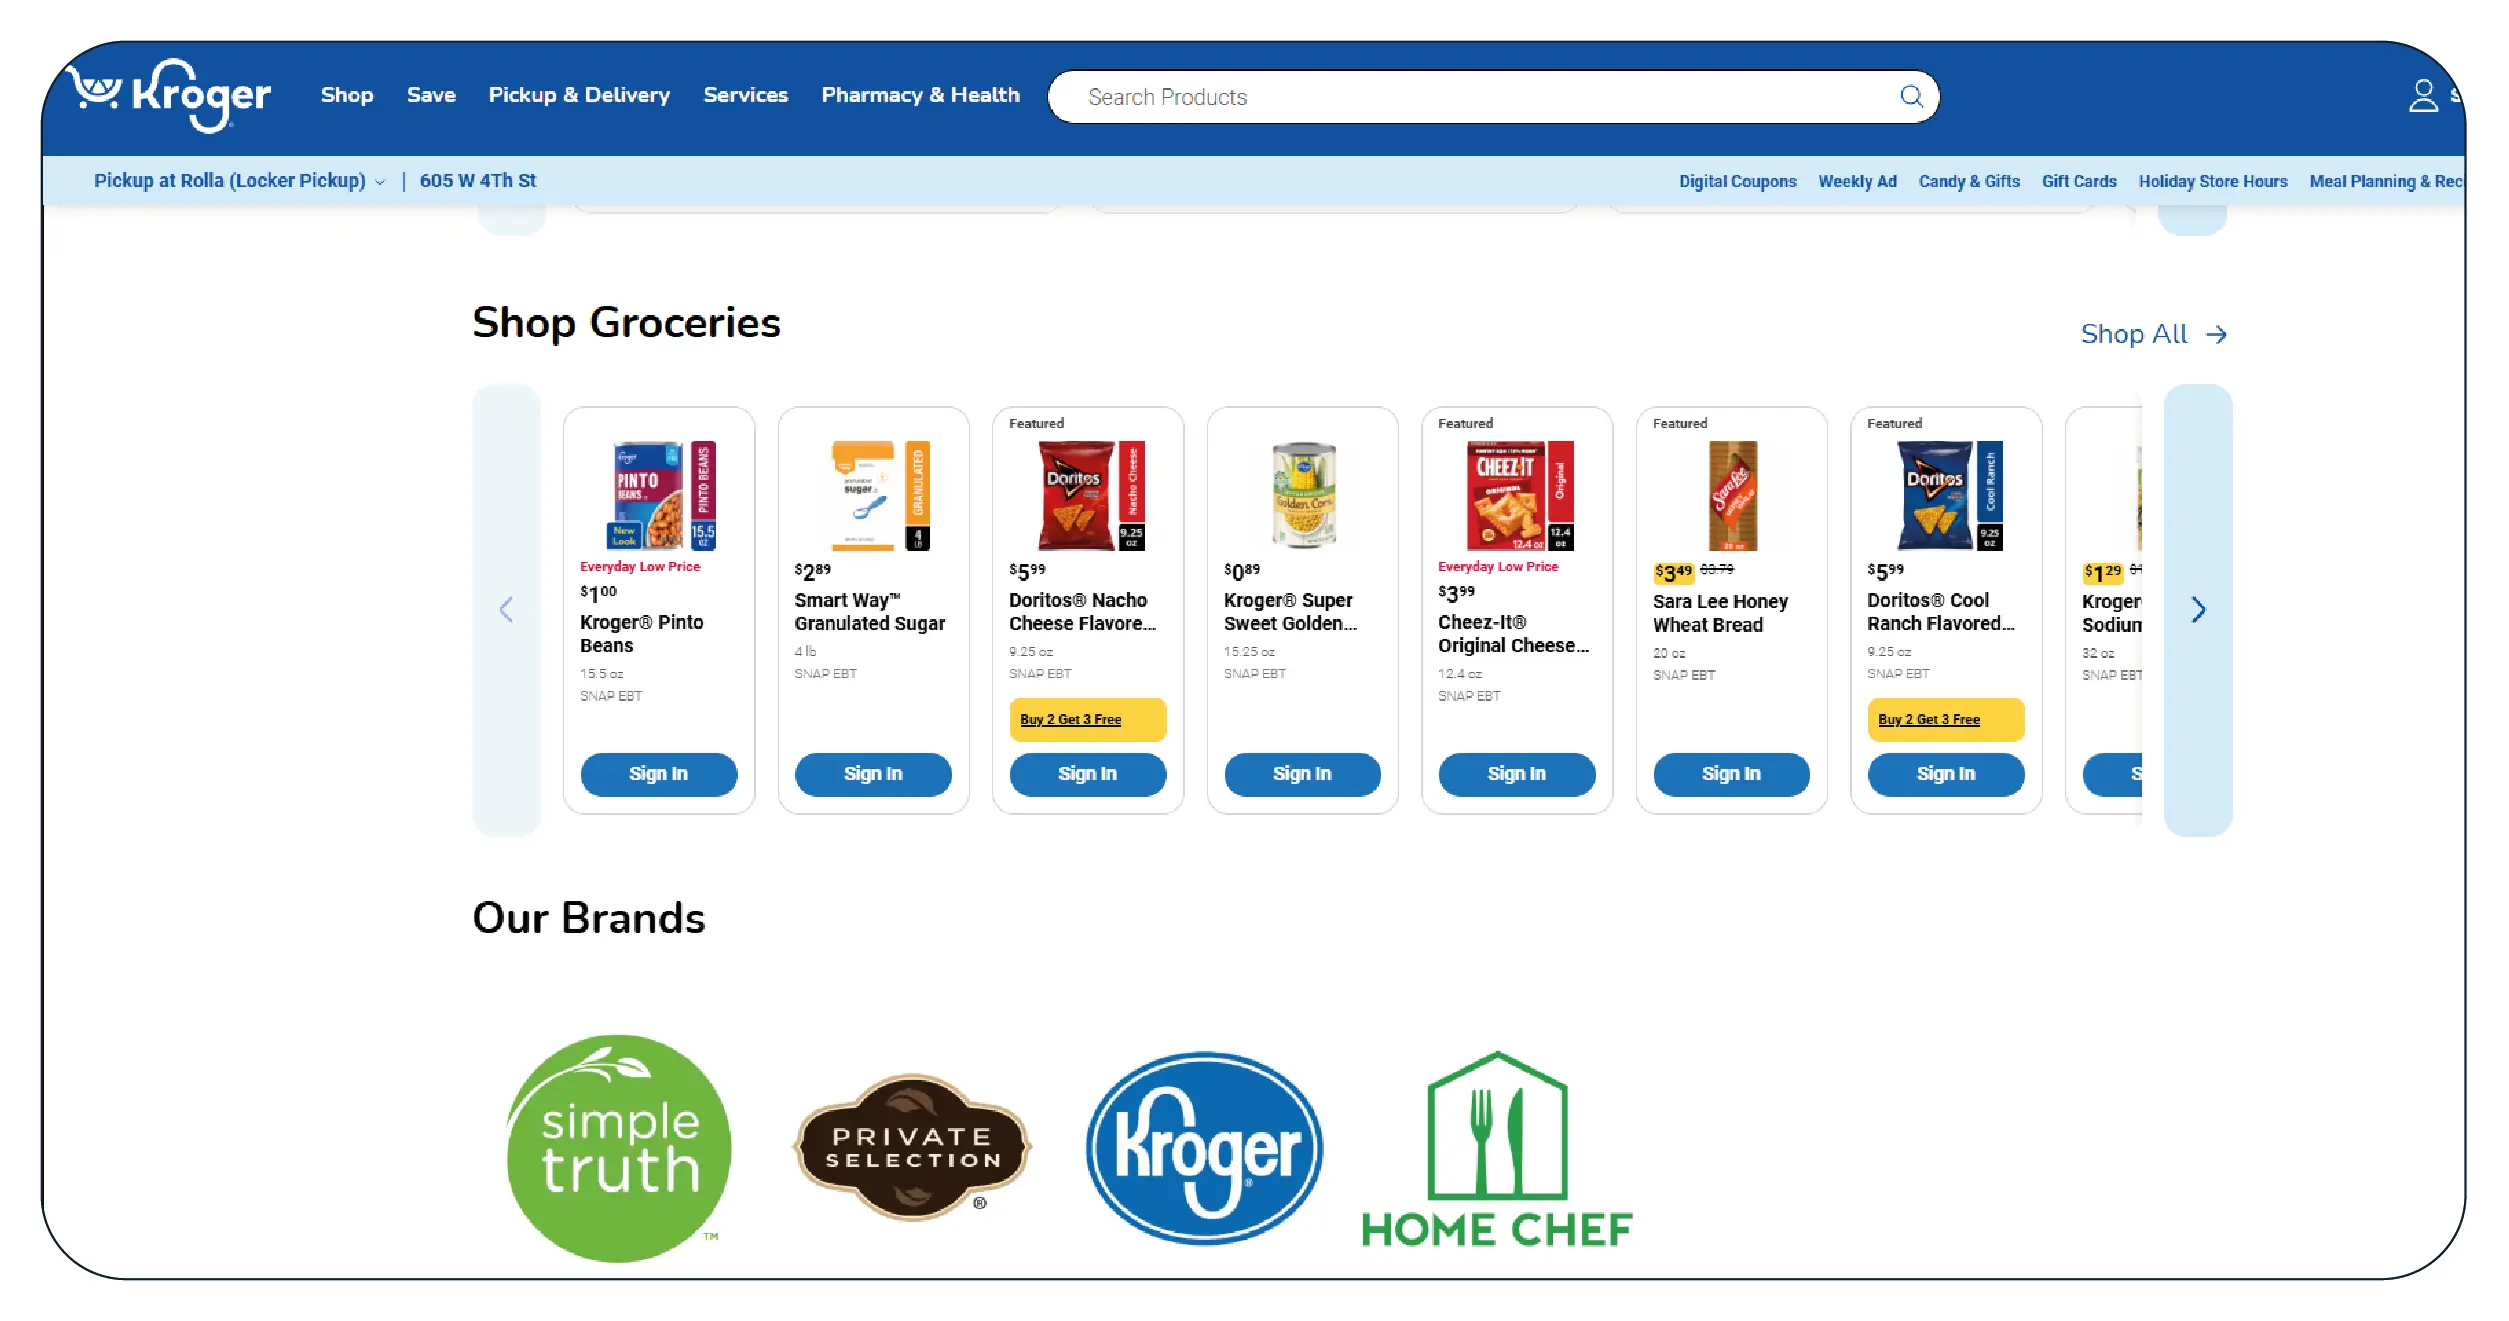
We began by identifying priority categories such as packaged foods, beverages, household essentials, and private-label products—categories where shrinkflation is most prevalent. SKUs were mapped across Walmart, Target, Kroger, Costco, Publix, and Safeway, ensuring accurate cross-retailer comparisons.
We began by identifying priority categories such as packaged foods, beverages, household essentials, and private-label products—categories where shrinkflation is most prevalent. SKUs were mapped across Walmart, Target, Kroger, Costco, Publix, and Safeway, ensuring accurate cross-retailer comparisons.
Phase 2: Automated Data Extraction
Using resilient scraping frameworks and adaptive parsers, we deployed automated pipelines that captured daily updates on price, pack size, promotional flags, and product metadata. These feeds were consolidated into a structured US Supermarket Shrinkflation Dataset, forming the foundation for longitudinal analysis.
Phase 3: Change Detection & Intelligence Logic
Advanced comparison logic automatically flagged discrepancies between historical and current SKU attributes. The system identified silent quantity reductions, packaging redesigns masking size changes, and price-per-unit inflation occurring without visible shelf price movement.
Validation layers cross-checked anomalies to reduce false positives caused by temporary listing errors or retailer formatting changes.
Phase 4: Analytics, Alerts & Delivery
Clean, enriched datasets were delivered via APIs and dashboards. Analysts could visualize shrinkflation trends by brand, retailer, category, or time period. Automated alerts notified stakeholders when critical thresholds—such as repeated pack-size reductions—were breached.
This phased approach eliminated manual effort, improved detection speed, and ensured the solution could scale as new retailers or categories were added.
Results & Key Metrics
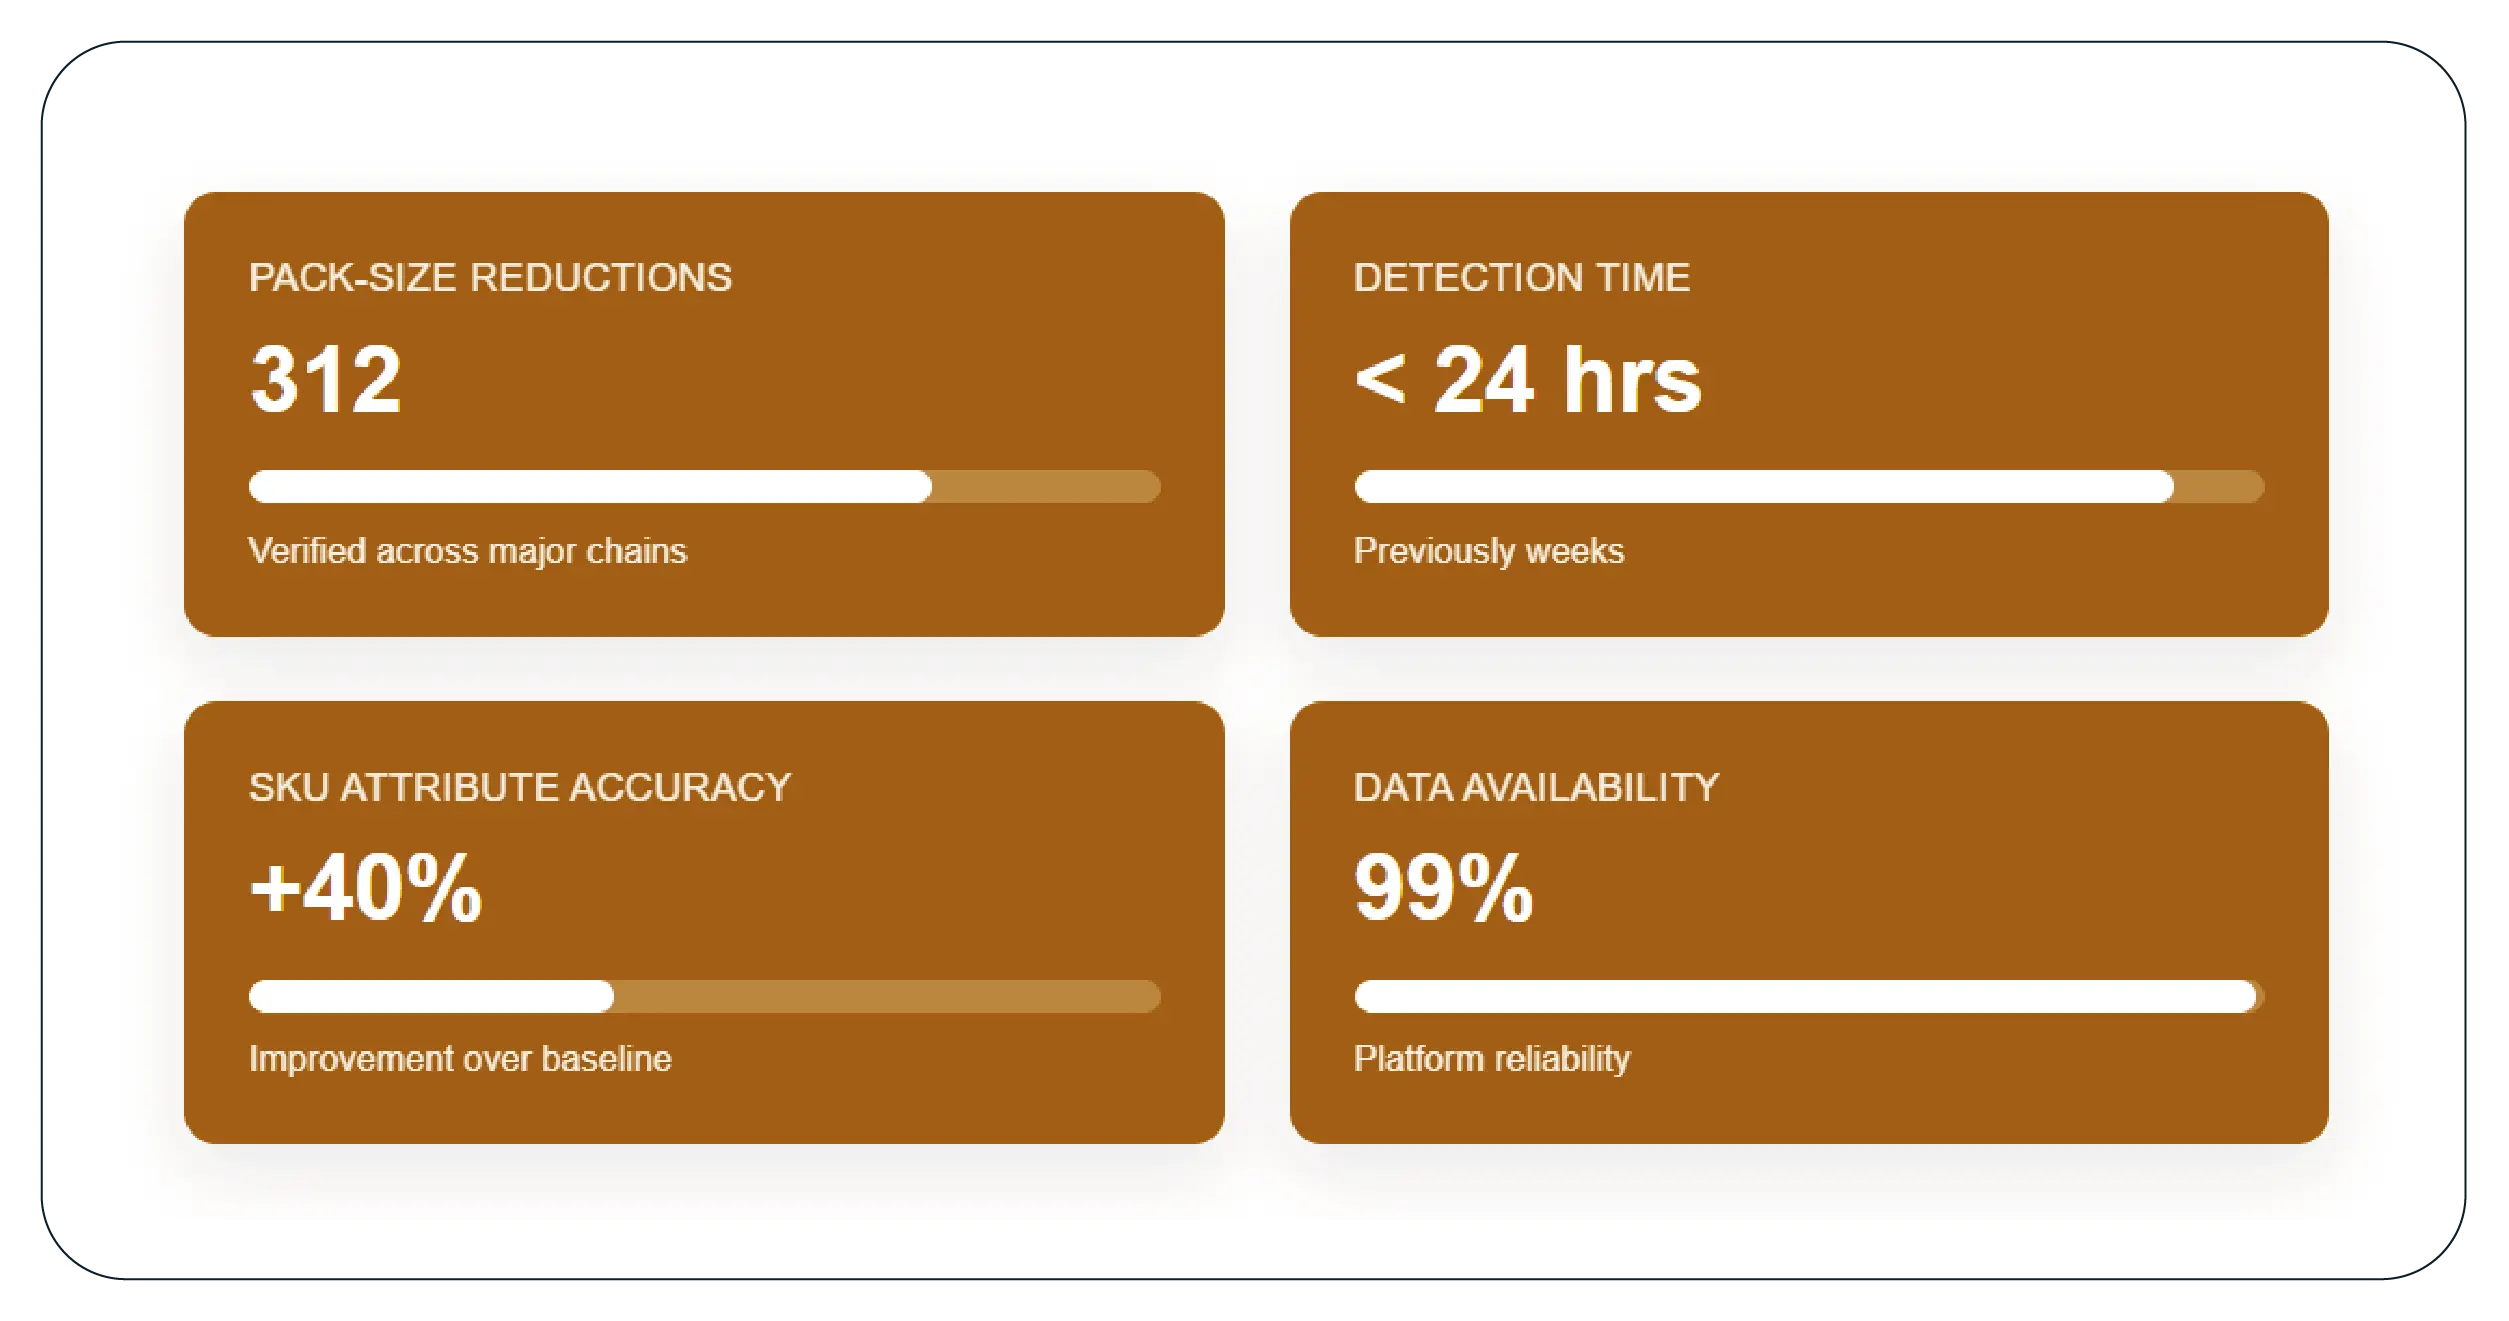
Detected 312 verified pack-size reductions across major chains
Reduced shrinkflation detection time from weeks to under 24 hours
Improved SKU attribute accuracy by 40%
Maintained data availability above 99%
Results Narrative
With AI-Powered Shrinkflation Analytics Using Scraped Data, the client transformed how shrinkflation was identified and reported. Brands gained early warnings on size reductions, helping them avoid undercutting margins or mispricing products. Analysts could clearly separate inflation-driven price increases from shrinkflation tactics, strengthening reports used by media, regulators, and enterprise customers.
What Made Product Data Scrape Different?
Product Data Scrape differentiated itself through deep retail domain expertise and proprietary change-detection logic. Our ability to explain How to Track Shrinkflation Across U.S. Grocery Chains using automated SKU intelligence delivered unmatched clarity. Smart normalization, adaptive scraping, and scalable architecture ensured long-term reliability even as retailer formats evolved.
Client’s Testimonial
“Product Data Scrape gave us visibility we simply couldn’t achieve before. Their shrinkflation tracking helped us detect hundreds of silent pack-size changes and deliver more credible insights to our clients.”
— Director of Consumer Analytics, U.S. Market Intelligence Firm
Conclusion
Shrinkflation is no longer a hidden tactic—it’s a measurable phenomenon when powered by the right data. By partnering with Product Data Scrape and leveraging Extract Grocery & Gourmet Food Data, the client built a future-ready intelligence system. The result is faster detection, higher accuracy, and stronger confidence in pricing and margin decisions across the U.S. grocery landscape.
FAQs
1. What retailers were covered in this case study?
The project tracked Walmart, Target, Kroger, Costco, Publix, and Safeway, covering both national brands and private-label products.
2. How is shrinkflation different from inflation in this analysis?
Inflation reflects a direct increase in shelf price, while shrinkflation occurs when pack size, weight, or quantity is reduced without a proportional price decrease.
3. How frequently was SKU data refreshed?
SKU data was refreshed daily, with automated alerts triggered when pack-size or unit-price changes were detected.
4. How did this help brands protect margins?
Early detection of shrinkflation allowed brands to adjust pricing, reformulate pack sizes strategically, and avoid unintended margin erosion or consumer backlash.
5. Can this shrinkflation tracking model scale further?
Yes, the architecture is designed to scale across additional U.S. retailers, categories, and even international markets without performance degradation.


.webp)


