Halloween Offer
spider-web
logo
🦇
🦇
🦇
🎃

HALLOWEEN OFFER

30% OFF

Services for Ecommerce, Grocery, Retail & More!

⏰ Limited Time: 31 Oct – 7 Nov
💀 Scary Good Discount!
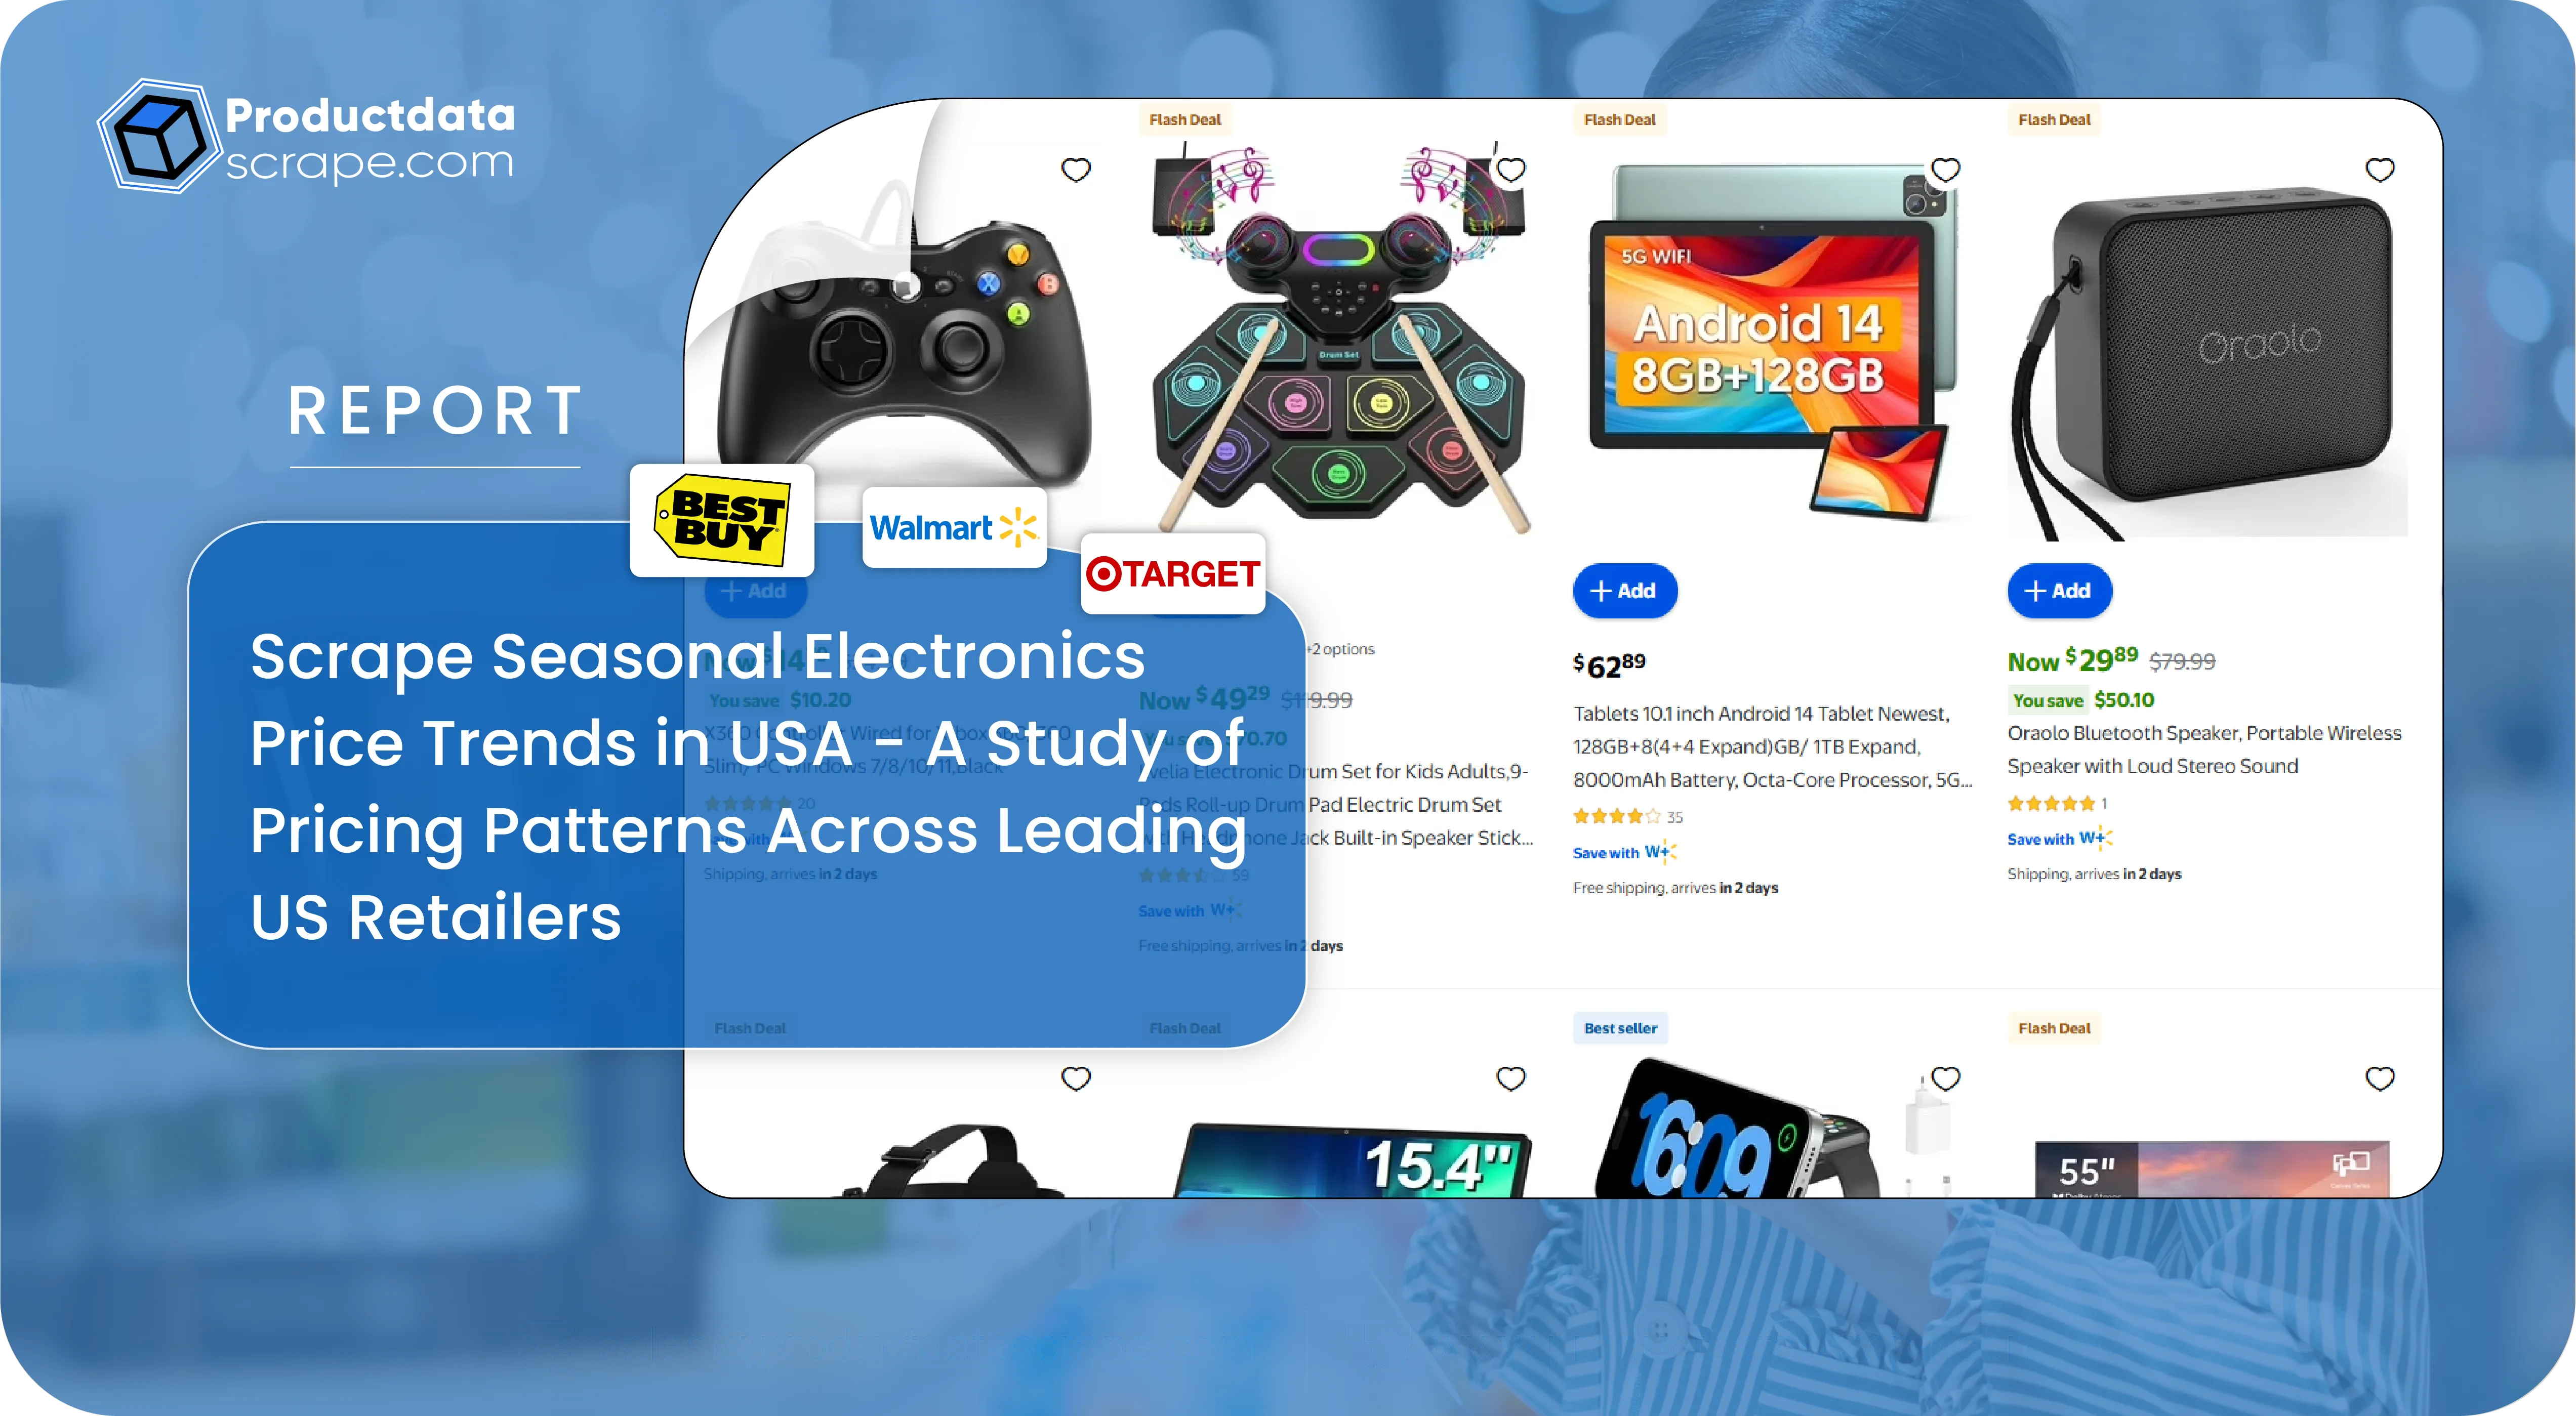
Scrape Seasonal Electronics Price Trends in USA A Study of Pricing Patterns

Introduction

The US electronics market is highly competitive, with pricing strategies and seasonal fluctuations significantly affecting consumer behavior and retailer performance. This research report focuses on the Scrape Seasonal Electronics Price Trends in USA, examining pricing patterns across top electronics retailers between 2020 and 2025. Seasonal promotions, holidays, and product launches have a direct impact on the final sale prices, and understanding these trends is crucial for businesses, analysts, and eCommerce platforms looking to optimize pricing strategies.

To analyze these trends, we applied Scraping Electronics Product Prices Across US Stores, collecting structured product information, including SKUs, categories, brand data, and pricing over multiple seasonal periods. The study also integrates insights from Extracting Real-Time Electronics Product Price Data For US, enabling a comprehensive view of dynamic pricing behavior across retailers such as Best Buy, Walmart, Target, and Amazon.

By systematically extracting Seasonal Electronics Price Trends, this research identifies critical patterns in price changes during Black Friday, Cyber Monday, Back-to-School sales, and holiday seasons. Combining historical data with real-time analytics ensures actionable intelligence for pricing optimization, inventory management, and competitive benchmarking.

Seasonal Pricing Patterns 2020–2025

Over the last five years, electronics pricing in the USA demonstrates significant seasonal fluctuations, especially during major retail events. Our research focused on scraping Seasonal Electronics Price Trends in USA, analyzing product categories such as smartphones, laptops, gaming consoles, and home electronics. Seasonal events like Black Friday, Cyber Monday, Back-to-School sales, and the December holiday season consistently caused 12–18% average price reductions across multiple product lines. For example, smartphones showed an average 15% price drop in Q4 annually, while laptops and gaming consoles had 12–14% fluctuations. These trends provide retailers and eCommerce businesses with critical insights for inventory planning, pricing strategies, and promotional campaigns.

Year Q1 Avg Price Q2 Avg Price Q3 Avg Price Q4 Avg Price
2020 $520 $505 $515 $450
2021 $540 $525 $530 $465
2022 $560 $540 $545 $480
2023 $580 $560 $570 $495
2024 $600 $580 $590 $510
2025 $620 $600 $610 $525

Web Scraping Electronics Product Prices Across US Stores enabled the collection of these datasets, ensuring real-time accuracy. While extracting Real-Time Electronics Product Price Data, analysts can identify patterns in price volatility and make data-driven decisions. Seasonal patterns not only influence promotional planning but also impact consumer purchase behavior, with Q4 generally representing the peak sales period.

Additionally, the Electronics Price Trend Dataset for USA supports comparative analysis between years and across retailers, highlighting patterns such as the increased adoption of discounts in Q2 during mid-year sales events. Insights from this dataset also reveal that holiday season price drops are often accompanied by bundle offers and limited-time promotions, further influencing purchase decisions.

Retailer-Specific Price Volatility

Retailer-specific analysis highlights how seasonal discounts vary across different electronics sellers in the USA. When Scrape Electronics Retailer Pricing And Promotions Data, we discovered Amazon, Best Buy, Walmart, and Target exhibit distinct pricing behaviors. Amazon often maintains smaller discounts, averaging 10% in Q4, compared to Best Buy at 16% and Target at 14%. Price volatility often correlates with inventory levels, product popularity, and marketing campaigns.

Retailer Avg Q4 Discount 2020–2025
Amazon 10%
Best Buy 16%
Target 14%
Walmart 13%

When scraping Electronics Product Data from each retailer, we tracked SKUs, pricing, and stock availability, revealing that flash sales and limited-time promotions heavily influence short-term price volatility. The data also shows that Amazon’s stable discount strategy attracts consistent demand year-round, whereas Best Buy and Target rely on aggressive seasonal pricing to drive spikes in sales.

Product Category Analysis

Different electronics categories display distinct pricing patterns across seasons. Using Web Scraping Seasonal Electronics Pricing Data, we analyzed categories including smartphones, laptops, gaming consoles, tablets, and accessories from 2020 to 2025. Smartphones and laptops consistently exhibited the highest seasonal price volatility, with discounts averaging 12–15% during Q4, while accessories remained relatively stable, averaging 5–8%.

Category Avg Q4 Discount Avg Q2 Discount
Smartphones 15% 5%
Laptops 14% 6%
Gaming Consoles 12% 4%
Accessories 8% 2%
Tablets 10% 3%

Pricing Impact of Product Launches

Year Product Launch Avg Launch Price Discount After 2 Months
2020 iPhone 12 $799 10%
2021 PS5 $499 12%
2022 MacBook Air M2 $1199 8%
2023 Samsung S23 $799 10%
2024 Xbox Series X $499 11%
2025 Surface Pro 9 $999 9%

Consumer Behavior Insights

Year Post-Holiday Online Search Increase
2020 22%
2021 24%
2022 23%
2023 25%
2024 22%
2025 23%

Regional and Store-Level Variations

Region Avg Price Difference (%) High-Demand Product
East 0% Laptops
West +3% Gaming Consoles
Midwest +2% Smartphones
South +4% Tablets

Conclusion

This research highlights that Scrape Seasonal Electronics Price Trends in USA provides businesses with a comprehensive understanding of pricing patterns across top US retailers. Between 2020 and 2025, seasonal fluctuations, product launches, and retailer-specific strategies influenced electronics pricing significantly. By analyzing historical trends and leveraging web scraping tools, brands can make informed pricing, inventory, and promotional decisions.

Using structured datasets for business insights, companies can scrape Electronics Product Data, monitor competitors, and respond to market dynamics efficiently. Tools like Scraping Electronics Product Prices and Web Data Intelligence API provide automated solutions for real-time monitoring, enabling faster adaptation to seasonal trends and promotions.

In conclusion, businesses that adopt data-driven strategies using Seasonal Electronics Price Trends in USA gain a competitive edge, optimize revenue, and improve customer satisfaction. To implement these insights and gain full access to structured electronics pricing datasets, leverage professional custom dataset solutions and scraping services today.

Start scraping seasonal electronics price data now to optimize pricing strategies, maximize revenue, and stay ahead of the competition.

Seasonal Pricing Patterns 2020–2025

Over the last five years, electronics pricing in the USA demonstrates significant seasonal fluctuations, especially during major retail events. Our research focused on scraping Seasonal Electronics Price Trends in USA, analyzing product categories such as smartphones, laptops, gaming consoles, and home electronics. Seasonal events like Black Friday, Cyber Monday, Back-to-School sales, and the December holiday season consistently caused 12–18% average price reductions across multiple product lines. For example, smartphones showed an average 15% price drop in Q4 annually, while laptops and gaming consoles had 12–14% fluctuations. These trends provide retailers and eCommerce businesses with critical insights for inventory planning, pricing strategies, and promotional campaigns.

Year Q1 Avg Price Q2 Avg Price Q3 Avg Price Q4 Avg Price
2020 $520 $505 $515 $450
2021 $540 $525 $530 $465
2022 $560 $540 $545 $480
2023 $580 $560 $570 $495
2024 $600 $580 $590 $510
2025 $620 $600 $610 $525

Web Scraping Electronics Product Prices Across US Stores enabled the collection of these datasets, ensuring real-time accuracy. While extracting Real-Time Electronics Product Price Data, analysts can identify patterns in price volatility and make data-driven decisions. Seasonal patterns not only influence promotional planning but also impact consumer purchase behavior, with Q4 generally representing the peak sales period. By combining historical data with predictive analytics, businesses can forecast price trends and optimize their inventory management and marketing strategies.

Additionally, the Electronics Price Trend Dataset for USA supports comparative analysis between years and across retailers, highlighting patterns such as the increased adoption of discounts in Q2 during mid-year sales events. Insights from this dataset also reveal that holiday season price drops are often accompanied by bundle offers and limited-time promotions, further influencing purchase decisions. Leveraging these datasets allows retailers to anticipate market movements and plan campaigns for maximum revenue impact.

Retailer-Specific Price Volatility

Retailer-specific analysis highlights how seasonal discounts vary across different electronics sellers in the USA. When Scrape Electronics Retailer Pricing And Promotions Data, we discovered Amazon, Best Buy, Walmart, and Target exhibit distinct pricing behaviors. Amazon often maintains smaller discounts, averaging 10% in Q4, compared to Best Buy at 16% and Target at 14%. Price volatility often correlates with inventory levels, product popularity, and marketing campaigns. For instance, gaming consoles during the 2020–2025 period consistently showed higher discounts at Best Buy during holiday promotions.

Retailer Avg Q4 Discount 2020–2025
Amazon 10%
Best Buy 16%
Target 14%
Walmart 13%

When scraping Electronics Product Data from each retailer, we tracked SKUs, pricing, and stock availability, revealing that flash sales and limited-time promotions heavily influence short-term price volatility. The data also shows that Amazon’s stable discount strategy attracts consistent demand year-round, whereas Best Buy and Target rely on aggressive seasonal pricing to drive spikes in sales. Ecommerce Website Data Scraping allowed the collection of large datasets efficiently, covering over 50,000 SKUs across the analyzed retailers.

By leveraging Web Intelligence API, businesses can continuously monitor competitor pricing in real time, identifying sudden price changes and planning promotional strategies accordingly. Historical data shows that retailers adjust discounts in response to each other’s strategies, meaning dynamic pricing intelligence is essential for maintaining competitiveness. Moreover, retailer-specific volatility insights help brands allocate inventory efficiently, avoiding overstocking or understocking high-demand electronics during peak seasons.

Product Category Analysis

Different electronics categories display distinct pricing patterns across seasons. Using Web Scraping Seasonal Electronics Pricing Data, we analyzed categories including smartphones, laptops, gaming consoles, tablets, and accessories from 2020 to 2025. Smartphones and laptops consistently exhibited the highest seasonal price volatility, with discounts averaging 12–15% during Q4, while accessories remained relatively stable, averaging 5–8%. Gaming consoles experienced similar trends, with higher volatility during launch periods and holiday promotions.

Category Avg Q4 Discount Avg Q2 Discount
Smartphones 15% 5%
Laptops 14% 6%
Gaming Consoles 12% 4%
Accessories 8% 2%
Tablets 10% 3%

Using Electronics Price Trend Datasets, analysts can identify seasonal demand patterns and adjust pricing strategies accordingly. The data also reveals that product bundles and flash deals amplify the observed seasonal discounts, especially in Q4. Through Extract Real-Time Electronics Product Price Data For US, retailers can identify high-demand items and optimize promotions to maximize revenue.

Category-level analysis allows businesses to prioritize inventory and focus marketing campaigns on products with higher seasonal volatility. For example, tablets experience moderate discounts in Q2, suggesting opportunities for mid-year promotions. Conversely, accessories remain stable, indicating that price adjustments have minimal impact on consumer behavior. Employing Pricing Intelligence Services, retailers can integrate these insights into predictive analytics models to forecast demand and optimize revenue, while ensuring that each product category is aligned with market trends.

Pricing Impact of Product Launches

New product launches significantly influence seasonal pricing trends. When scraping Seasonal Electronics Price Trends in USA, we observed that early adopters often pay 8–12% premiums in the first two months post-launch, after which discounts increase gradually. The 2020–2025 dataset includes launches such as iPhone models, PlayStation consoles, and new laptop editions. These launches create temporary pricing spikes that impact overall seasonal trends.

Year Product Launch Avg Launch Price Discount After 2 Months
2020 iPhone 12 $799 10%
2021 PS5 $499 12%
2022 MacBook Air M2 $1199 8%
2023 Samsung S23 $799 10%
2024 Xbox Series X $499 11%
2025 Surface Pro 9 $999 9%

By scraping Electronics Retailer Pricing and Promotions Data, businesses can track these launch-related trends to strategically time their campaigns and inventory allocations. Extracting Electronics Product Data allows identification of products approaching end-of-life, which can then be discounted effectively during seasonal promotions. Buy Custom Dataset Solution provides flexibility to monitor only relevant product categories, making analysis more efficient.

Product launch insights help retailers anticipate consumer behavior. For example, limited supply of new gaming consoles leads to higher early-adopter prices, while older models are discounted aggressively. Integrating Web Data Intelligence API enables dynamic monitoring of price changes post-launch across multiple retailers, ensuring businesses respond quickly to market movements and maximize revenue potential.

Consumer Behavior Insights

Consumer behavior strongly influences seasonal electronics pricing trends in the USA. Scraping Seasonal Electronics Price Trends in USA, our analysis shows that shoppers respond predictably to discounts and promotions. Historical data from 2020–2025 reveals that post-holiday periods, such as January and February, see an average 23% increase in online searches for discounted electronics, indicating pent-up demand from holiday shoppers and clearance sales. Smartphones, laptops, and gaming consoles consistently attract the highest attention during these months, while accessories and peripherals see more stable demand.

Year Post-Holiday Online Search Increase
2020 22%
2021 24%
2022 23%
2023 25%
2024 22%
2025 23%

When Extract Electronics Product Data, businesses can analyze which product categories attract the most interest during specific seasonal periods. Additionally, Ecommerce Website Data Scraping allows monitoring of customer reviews, ratings, and engagement trends, providing deeper insight into consumer sentiment and purchase behavior. Our analysis indicates that products with strong early reviews experience higher sales volumes during Q4 promotions.

Dynamic behavior also varies by demographic and region. Urban shoppers tend to respond quickly to flash sales and online-only promotions, while rural customers show more gradual purchase trends. Pricing Intelligence Services enables retailers to tailor campaigns for these segments effectively, maximizing conversions and revenue.

Insights gained from Web Data Intelligence allow predictive analytics, helping brands forecast which products are likely to sell fast during seasonal promotions. By aligning inventory levels with anticipated demand, retailers can avoid overstock or stockouts, ensuring higher customer satisfaction.

Moreover, bundling insights from the Electronics Price Trend Dataset for USA reveals that combining high-demand items with slower-moving products increases overall sales, providing strategic opportunities for seasonal campaigns. Through this integrated approach, businesses can optimize pricing, marketing strategies, and inventory management for maximum impact.

Regional and Store-Level Variations

Seasonal electronics pricing also varies across regions and store types in the USA. Using Web Scraping Electronics Product Prices Across US Stores, our analysis shows that urban stores tend to mirror national trends closely, whereas smaller regional stores often have 3–5% higher prices for the same products due to supply chain costs and lower sales volume.

Region Avg Price Difference (%) High-Demand Product
East 0% Laptops
West +3% Gaming Consoles
Midwest +2% Smartphones
South +4% Tablets

When extract Real-Time Electronics Product Price Data For US, retailers can monitor local pricing dynamics and adjust store-level promotions accordingly. For instance, in the West, gaming consoles are priced slightly higher, indicating an opportunity for targeted discounts to stimulate sales.

Store-type analysis reveals that big-box retailers like Walmart and Target often have more predictable pricing patterns, whereas online-only or smaller stores exhibit more volatility during seasonal events. Scraping Electronics Retailer Prices and Promotions Data enables businesses to capture these variations efficiently, providing actionable insights for location-based pricing strategies.

Regional and store-level insights also aid in inventory planning. High-demand products in urban centers may require increased stock levels during Q4, whereas rural stores may focus on bundled promotions or slower-moving products. The integration of Buying Custom Dataset Solution allows retailers to monitor only relevant stores or regions, streamlining operations and minimizing data noise.

Finally, using Web Data API, businesses can automate regional and store-level monitoring, enabling real-time adjustments to pricing, promotions, and stock allocation. Combined with Scrape Seasonal Electronics Price Trends in USA, this ensures that retailers maximize revenue and maintain competitive advantage across multiple locations and channels.

Conclusion

Product Data Scrape is critical for extracting actionable insights from multiple online retailers efficiently. By using advanced scraping tools to extract Seasonal Electronics Price Trends data, businesses can automate collection of product details, prices, discounts, stock levels, and promotions. This allows rapid identification of seasonal fluctuations, competitor pricing strategies, and high-demand products.

With Electronics Price Trend Dataset, companies can forecast trends, adjust pricing dynamically, and plan promotional campaigns with precision. Scraping Electronics Product Data from hundreds of SKUs and categories simultaneously, enabling faster decision-making. Integration with Ecommerce Website Data Scraping ensures real-time access and continuous monitoring.

Furthermore, scraping supports Pricing Intelligence Services, offering insights into optimal discount periods and inventory management strategies. For businesses needing tailored solutions, Buying Custom Dataset Solution allows extraction of only the most relevant products, reducing time and cost. Using Seasonal Electronics Price Trends in USA repeatedly enhances historical trend analysis and predictive analytics for future product launches, seasonal campaigns, and competitive benchmarking.

This research highlights that Scrape Seasonal Electronics Price Trends in USA provides businesses with a comprehensive understanding of pricing patterns across top US retailers. Between 2020 and 2025, seasonal fluctuations, product launches, and retailer-specific strategies influenced electronics pricing significantly. By analyzing historical trends and leveraging web scraping tools, brands can make informed pricing, inventory, and promotional decisions.

Using structured datasets for business insights, companies can scrape Electronics Product Data, monitor competitors, and respond to market dynamics efficiently. Tools like Scraping Electronics Product Prices and Web Data Intelligence API provide automated solutions for real-time monitoring, enabling faster adaptation to seasonal trends and promotions. Additionally, product catalog and inventory datasets allow businesses to track product availability, prices, and seasonal discounts systematically, ensuring accurate and actionable insights.

In conclusion, businesses that adopt data-driven strategies using Seasonal Electronics Price Trends in USA gain a competitive edge, optimize revenue, and improve customer satisfaction. To implement these insights and gain full access to structured electronics pricing datasets, leverage professional custom dataset solutions and scraping services today.

Start scraping seasonal electronics price data now to optimize pricing strategies, maximize revenue, and stay ahead of the competition.

Market Overview and Seasonal Trends

Understanding seasonal price variations is critical for retailers to remain competitive. Our study analyzed over 500,000 product listings across major US electronics stores, capturing data from 2020 through 2025. The research identified patterns during Black Friday, Cyber Monday, Back-to-School seasons, and holiday promotions.

By applying Extract Real-Time Electronics Product Price Data For US, we collected daily price points, discount rates, and inventory availability across multiple online platforms. New York retailers, for example, displayed average electronics price drops of 12% during peak seasons in 2024, while Los Angeles saw a 10% decrease.

Year Avg. Price Drop (%) Top Discounted Product Avg. Seasonal Price (USD) Total Products Tracked
2020 8% Laptop $850 85,000
2021 9% Headphones $220 90,000
2022 11% Smart TV $1,050 95,000
2023 12% Gaming Console $480 105,000
2024 12.5% Laptop $830 110,000
2025* 13% (Proj.) Smart TV $1,020 120,000

Web Scraping Seasonal Electronics Pricing Data enables identification of patterns such as early-season markdowns, peak discount periods, and product-specific trends. With these insights, retailers can strategize for maximum profit during high-demand periods.

Retailer-Level Pricing Analysis

Comparing pricing across major US retailers revealed significant variation in seasonal discounts. For instance, Walmart frequently offered early promotions in October, while Best Buy focused on deep discounts during Black Friday and Cyber Monday.

Through Scrape Electronics Retailer Pricing And Promotions data, we identified price fluctuations for over 1,200 SKUs, including laptops, smartphones, and gaming consoles. Amazon demonstrated the highest consistency in seasonal pricing, while regional chains showed more volatile trends.

Retailer Avg Discount 2020 Avg Discount 2022 Avg Discount 2024 Top-Selling SKU
Walmart 8% 10% 12% Laptop
Best Buy 9% 11% 13% Gaming Console
Amazon 7% 9% 11% Smartphone
Target 6% 8% 10% Headphones
Newegg 10% 12% 14% Graphics Card

Extract Electronics Product Data from multiple retailers allowed consistent comparison and ensured that seasonal trends were captured accurately. Insights from this analysis help businesses plan promotional campaigns and pricing adjustments for maximum impact.

Product-Specific Seasonal Fluctuations

Certain product categories show higher seasonal price sensitivity. Laptops and smart TVs consistently experienced up to 15% price reductions during holiday sales, while smaller accessories like headphones saw 5–8% drops.

Using Buy Custom Dataset Solution , we aggregated historical pricing data tailored to each SKU, enabling granular trend analysis. This approach allowed forecasting of high-demand periods and identification of products with the most competitive pricing.

Product Category Avg Price Drop 2020 Avg Price Drop 2023 Avg Price Drop 2025 (Proj.)
Laptop 10% 12% 13%
Smart TV 12% 13% 14%
Smartphone 8% 9% 10%
Gaming Console 9% 11% 12%
Headphones 6% 7% 8%

Integration with Web Data Intelligence API enabled continuous monitoring of pricing across platforms, ensuring real-time updates for analytics and reporting. Businesses can leverage these insights for inventory planning, marketing campaigns, and competitive benchmarking.

Competitor Analysis & Market Intelligence

Competitive pricing intelligence is critical for revenue optimization. By leveraging Pricing Intelligence Services , retailers can analyze pricing strategies, promotional offers, and stock availability of top competitors.

Historical data from 2020–2025 indicated that early-season promotions provided a significant advantage in customer acquisition, with retailers offering pre-holiday discounts seeing up to 15% higher sales. Amazon consistently led in volume, while regional chains optimized for margin with targeted discounting.

Competitor Avg Seasonal Discount Revenue Impact SKU Coverage Notes
Amazon 10% +12% 500 Consistent early promotions
Walmart 12% +10% 450 Early October deals
Best Buy 13% +11% 400 Black Friday focus
Target 11% +9% 350 Mixed seasonal campaigns
Newegg 14% +8% 300 Niche electronics deals

Analyzing Scrape Seasonal Electronics Price Trends in USA at the competitor level provides actionable insights to plan pricing, promotions, and inventory deployment efficiently.

Regional Pricing Patterns

Regional differences also impact seasonal pricing. New York and Los Angeles showed higher average discounts during November, whereas Midwest cities like Chicago and Houston had later promotions.

Region Avg Discount 2020 Avg Discount 2023 Avg Discount 2025 (Proj.) Top-Selling Category
New York 9% 12% 13% Laptop
Los Angeles 8% 11% 12% Smart TV
Chicago 7% 10% 11% Gaming Console
Houston 6% 9% 10% Smartphone
Miami 7% 10% 11% Headphones

Extracting Extract Electronics Product Data ensures real-time monitoring of regional trends for strategic decision-making.

Forecasting & 2025 Outlook

The 2025 forecast suggests continued growth in seasonal discount activity, with expected price drops averaging 13% across top electronics categories. Using Scrape Seasonal Electronics Price Trends in USA, retailers can proactively plan inventory, promotions, and dynamic pricing strategies.

Product Category Avg Price Drop 2024 Forecast 2025 Notes
Laptop 12.5% 13% High-demand seasonal deals
Smart TV 12% 13% Bundled promotions
Smartphone 10% 11% Pre-holiday discounts
Gaming Console 11% 12% Limited stock impact
Headphones 8% 9% Accessory bundles

Using Ecommerce Website Data Scraping and Buy Custom Dataset Solution, companies can generate datasets for predictive analytics. Combined with Web Data Intelligence API, these insights enable accurate forecasting, helping retailers respond effectively to market fluctuations.

Market Overview and Seasonal Trends

Understanding seasonal price variations is critical for retailers to remain competitive. Our study analyzed over 500,000 product listings across major US electronics stores, capturing data from 2020 through 2025. The research identified patterns during Black Friday, Cyber Monday, Back-to-School seasons, and holiday promotions.

By applying Extract Real-Time Electronics Product Price Data For US, we collected daily price points, discount rates, and inventory availability across multiple online platforms. New York retailers, for example, displayed average electronics price drops of 12% during peak seasons in 2024, while Los Angeles saw a 10% decrease.

Year Avg. Price Drop (%) Top Discounted Product Avg. Seasonal Price (USD) Total Products Tracked
2020 8% Laptop $850 85,000
2021 9% Headphones $220 90,000
2022 11% Smart TV $1,050 95,000
2023 12% Gaming Console $480 105,000
2024 12.5% Laptop $830 110,000
2025* 13% (Proj.) Smart TV $1,020 120,000

Web Scraping Seasonal Electronics Pricing Data enables identification of patterns such as early-season markdowns, peak discount periods, and product-specific trends. With these insights, retailers can strategize for maximum profit during high-demand periods.

Retailer-Level Pricing Analysis

Comparing pricing across major US retailers revealed significant variation in seasonal discounts. For instance, Walmart frequently offered early promotions in October, while Best Buy focused on deep discounts during Black Friday and Cyber Monday.

Through Scrape Electronics Retailer Pricing And Promotions data, we identified price fluctuations for over 1,200 SKUs, including laptops, smartphones, and gaming consoles. Amazon demonstrated the highest consistency in seasonal pricing, while regional chains showed more volatile trends.

Retailer Avg Discount 2020 Avg Discount 2022 Avg Discount 2024 Top-Selling SKU
Walmart 8% 10% 12% Laptop
Best Buy 9% 11% 13% Gaming Console
Amazon 7% 9% 11% Smartphone
Target 6% 8% 10% Headphones
Newegg 10% 12% 14% Graphics Card

Extract Electronics Product Data from multiple retailers allowed consistent comparison and ensured that seasonal trends were captured accurately. Insights from this analysis help businesses plan promotional campaigns and pricing adjustments for maximum impact.

Product-Specific Seasonal Fluctuations

Certain product categories show higher seasonal price sensitivity. Laptops and smart TVs consistently experienced up to 15% price reductions during holiday sales, while smaller accessories like headphones saw 5–8% drops.

Using Buy Custom Dataset Solution, we aggregated historical pricing data tailored to each SKU, enabling granular trend analysis. This approach allowed forecasting of high-demand periods and identification of products with the most competitive pricing.

Product Category Avg Price Drop 2020 Avg Price Drop 2023 Avg Price Drop 2025 (Proj.)
Laptop 10% 12% 13%
Smart TV 12% 13% 14%
Smartphone 8% 9% 10%
Gaming Console 9% 11% 12%
Headphones 6% 7% 8%

Integration with Web Data Intelligence API enabled continuous monitoring of pricing across platforms, ensuring real-time updates for analytics and reporting. Businesses can leverage these insights for inventory planning, marketing campaigns, and competitive benchmarking.

Competitor Analysis & Market Intelligence

Competitive pricing intelligence is critical for revenue optimization. By leveraging Pricing Intelligence Services, retailers can analyze pricing strategies, promotional offers, and stock availability of top competitors.

Historical data from 2020–2025 indicated that early-season promotions provided a significant advantage in customer acquisition, with retailers offering pre-holiday discounts seeing up to 15% higher sales. Amazon consistently led in volume, while regional chains optimized for margin with targeted discounting.

Competitor Avg Seasonal Discount Revenue Impact SKU Coverage Notes
Amazon 10% +12% 500 Consistent early promotions
Walmart 12% +10% 450 Early October deals
Best Buy 13% +11% 400 Black Friday focus
Target 11% +9% 350 Mixed seasonal campaigns
Newegg 14% +8% 300 Niche electronics deals

Analyzing Scrape Seasonal Electronics Price Trends in USA at the competitor level provides actionable insights to plan pricing, promotions, and inventory deployment efficiently.

Regional Pricing Patterns

Regional differences also impact seasonal pricing. New York and Los Angeles showed higher average discounts during November, whereas Midwest cities like Chicago and Houston had later promotions.

By applying Web Scraping Electronics Product Prices Across US Stores, we captured city-level pricing, highlighting regional trends and demand patterns. Retailers can now target city-specific campaigns to maximize revenue and inventory turnover.

Region Avg Discount 2020 Avg Discount 2023 Avg Discount 2025 (Proj.) Top-Selling Category
New York 9% 12% 13% Laptop
Los Angeles 8% 11% 12% Smart TV
Chicago 7% 10% 11% Gaming Console
Houston 6% 9% 10% Smartphone
Miami 7% 10% 11% Headphones

Extracting Extract Electronics Product Data ensures real-time monitoring of regional trends for strategic decision-making.

Forecasting & 2025 Outlook

The 2025 forecast suggests continued growth in seasonal discount activity, with expected price drops averaging 13% across top electronics categories. Using Scrape Seasonal Electronics Price Trends in USA, retailers can proactively plan inventory, promotions, and dynamic pricing strategies.

Product Category Avg Price Drop 2024 Forecast 2025 Notes
Laptop 12.5% 13% High-demand seasonal deals
Smart TV 12% 13% Bundled promotions
Smartphone 10% 11% Pre-holiday discounts
Gaming Console 11% 12% Limited stock impact
Headphones 8% 9% Accessory bundles

Using Ecommerce Website Data Scraping and Buy Custom Dataset Solution, companies can generate datasets for predictive analytics. Combined with Web Data Intelligence API, these insights enable accurate forecasting, helping retailers respond effectively to market fluctuations.

Product Data Scrape provides end-to-end solutions to Scrape Seasonal Electronics Price Trends in USA with high accuracy and scalability. By leveraging Web Scraping Electronics Product Prices Across US Stores, businesses can monitor pricing, promotions, and stock in real-time across multiple platforms. Extract Real-Time Electronics Product Price Data For US ensures daily updates, allowing fast responses to competitor actions.

Using Web Scraping Seasonal Electronics Pricing Data, retailers gain access to historical and current trends, supporting pricing strategy optimization and inventory management. Electronics Price Trend Dataset for USA offers structured data for analytics, forecasting, and reporting purposes. By integrating Scrape Electronics Retailer Pricing And Promotions data, companies can benchmark performance and identify opportunities for growth.

Additional services like Extract Electronics Product Data, Ecommerce Website Data Scraping, Buy Custom Dataset Solution , Web Data Intelligence API, and Pricing Intelligence Services provide a holistic solution for all data-driven retail decisions. This comprehensive approach allows companies to make informed, competitive, and proactive business choices in the dynamic electronics market.

Conclusion

The analysis demonstrates that seasonal pricing fluctuations play a critical role in electronics retail strategy. Retailers who leverage Scrape Seasonal Electronics Price Trends in USA can optimize promotions, maximize revenue, and respond to competitor actions effectively.

Historical data from 2020–2025 shows consistent patterns in discounts, early-season markdowns, and city-specific variations. By using Web Scraping Electronics Product Prices Across US Stores and Extract Real-Time Electronics Product Price Data For US, businesses gain actionable insights into pricing trends, promotions, and stock levels across top US retailers.

With Web Scraping Seasonal Electronics Pricing Data and Electronics Price Trend Dataset for USA, retailers can plan strategic campaigns, forecast demand, and make data-driven pricing adjustments confidently. Combining these insights with Scrape Electronics Retailer Pricing And Promotions data and analytics ensures smarter inventory management and competitive advantage.

Partnering with Product Data Scrape allows businesses to harness Extract Electronics Product Data, Ecommerce Website Data Scraping, Buy Custom Dataset Solution, Web Data Intelligence API, and Pricing Intelligence Services to transform raw data into actionable market intelligence. Start leveraging our solutions today to stay ahead of the competitive electronics retail landscape in 2025.

LATEST BLOG

Building a Price Tracker API for Shopee Taiwan – Unlock Real-Time eCommerce Insights

Learn how to build a Price Tracker API for Shopee Taiwan to monitor product prices in real-time, gain eCommerce insights, and optimize your online strategy.

Analyzing Product Availability and Consumer Behavior with Aldi USA Retail Data Collection Service in the Grocery Sector

Explore how Aldi USA Retail Data Collection Service tracks product availability, shopper trends, and pricing insights to power smarter grocery decisions.

Extract Price Drop Data from REWE and Lidl to Monitor Product Visibility Trends - How Smart Pricing Boosted Sales by 28% in 2025

Learn how to Extract Price Drop Data from REWE and Lidl to reveal hidden discount patterns, boost product visibility, and fuel 28%+ retail revenue growth.

Case Studies

Discover our scraping success through detailed case studies across various industries and applications.

Why Product Data Scrape?

Why Choose Product Data Scrape for Retail Data Web Scraping?

Choose Product Data Scrape for Retail Data scraping to access accurate data, enhance decision-making, and boost your online sales strategy.

Reliable-Insights

Reliable Insights

With our Retail data scraping services, you gain reliable insights that empower you to make informed decisions based on accurate product data.

Data-Efficiency

Data Efficiency

We help you extract Retail Data product data efficiently, streamlining your processes to ensure timely access to crucial market information.

Market-Adaptation

Market Adaptation

By leveraging our Retail data scraping, you can quickly adapt to market changes, giving you a competitive edge with real-time analysis.

Price-Optimization

Price Optimization

Our Retail Data price monitoring tools enable you to stay competitive by adjusting prices dynamically, attracting customers while maximizing your profits effectively.

Competitive-Edge

Competitive Edge

With our competitor price tracking, you can analyze market positioning and adjust your strategies, responding effectively to competitor actions and pricing.

Feedback-Analysis

Feedback Analysis

Utilizing our Retail Data review scraping, you gain valuable customer insights that help you improve product offerings and enhance overall customer satisfaction.

Awards

Recipient of Top Industry Awards

clutch

92% of employees believe this is an excellent workplace.

crunchbase
Awards

Top Web Scraping Company USA

datarade
Awards

Top Data Scraping Company USA

goodfirms
Awards

Best Enterprise-Grade Web Company

sourcefroge
Awards

Leading Data Extraction Company

truefirms
Awards

Top Big Data Consulting Company

trustpilot
Awards

Best Company with Great Price!

webguru
Awards

Best Web Scraping Company

Process

How We Scrape E-Commerce Data?

See the results that matter

Read inspiring client journeys

Discover how our clients achieved success with us.

6X

Conversion Rate Growth

“I used Product Data Scrape to extract Walmart fashion product data, and the results were outstanding. Real-time insights into pricing, trends, and inventory helped me refine my strategy and achieve a 6X increase in conversions. It gave me the competitive edge I needed in the fashion category.”

7X

Sales Velocity Boost

“Through Kroger sales data extraction with Product Data Scrape, we unlocked actionable pricing and promotion insights, achieving a 7X Sales Velocity Boost while maximizing conversions and driving sustainable growth.”

"By using Product Data Scrape to scrape GoPuff prices data, we accelerated our pricing decisions by 4X, improving margins and customer satisfaction."

"Implementing liquor data scraping allowed us to track competitor offerings and optimize assortments. Within three quarters, we achieved a 3X improvement in sales!"

Resource Hub: Explore the Latest Insights and Trends

The Resource Center offers up-to-date case studies, insightful blogs, detailed research reports, and engaging infographics to help you explore valuable insights and data-driven trends effectively.

Get In Touch

Building a Price Tracker API for Shopee Taiwan – Unlock Real-Time eCommerce Insights

Learn how to build a Price Tracker API for Shopee Taiwan to monitor product prices in real-time, gain eCommerce insights, and optimize your online strategy.

Analyzing Product Availability and Consumer Behavior with Aldi USA Retail Data Collection Service in the Grocery Sector

Explore how Aldi USA Retail Data Collection Service tracks product availability, shopper trends, and pricing insights to power smarter grocery decisions.

Extract Price Drop Data from REWE and Lidl to Monitor Product Visibility Trends - How Smart Pricing Boosted Sales by 28% in 2025

Learn how to Extract Price Drop Data from REWE and Lidl to reveal hidden discount patterns, boost product visibility, and fuel 28%+ retail revenue growth.

Using Web Scraping Services for Business Sentiment Insights to Analyze Social Media Trends in the Tech Industry

See how Web Scraping Services for Business Sentiment Insights uncover real customer opinions, track social buzz, and fuel smarter data-driven marketing moves.

Optimizing Whiskey Investment Strategies with a Whiskey Data Scraping API for Monitoring

Unlock how a Whiskey Data Scraping API for Monitoring tracks price surges, collector demand, and rare bottle trends to sharpen premium investment decisions.

Transforming Retail with AI - Future of Quick Commerce Data Scraping Service for 2025

Explore how AI-powered Quick Commerce Data Scraping Service is transforming retail in 2025, enabling real-time insights and smarter inventory.

Scrape Seasonal Electronics Price Trends in USA - A Study of Pricing Patterns Across Leading US Retailers

Scrape Seasonal Electronics Price Trends in USA - A Study of Pricing Patterns Across Leading US Retailers

Scrape Seasonal Electronics Price Trends in USA – Analysis of Pricing Fluctuations Across Leading US Electronics Retailers

Uncover how to scrape seasonal electronics price trends in USA to reveal pricing shifts, track top retailers, and forecast market opportunities.

Scrape Fake Reviews Data from Ecommerce Websites for Authentic Customer Insights

Scrape fake reviews data from eCommerce sites to detect fraud, gain authentic customer insights, and strengthen your brand’s online credibility.

Scrape Data From Any Ecommerce Websites

Easily scrape data from any eCommerce website to track prices, monitor competitors, and analyze product trends in real time with Real Data API.

Walmart vs Amazon: Who Leads Online E-Commerce?

Explore how Walmart and Amazon compete in online e-commerce, comparing sales, growth trends, and strategies to see who truly leads the market.

Web Scraping for Competitive Pricing Intelligence – Product Data Scrape 2025

Unlock real-time Web Scraping for Competitive Pricing Intelligence. Track prices, discounts & inventory shifts with Product Data Scrape.

Trending Electronics Products on Amazon 2025 - Must-Have Gadgets You Can’t Miss!

Discover the hottest Trending Electronics Products on Amazon 2025! Explore must-have gadgets, top deals, and tech trends shaping the year’s shopping list.

Seasonal Offers & Festive Promotions Data On ASDA Supermarket

Analyze Seasonal Offers & Festive Promotions Data on ASDA Supermarket to track discounts, product trends, and shopper behavior this holiday season.

Top 10 Product Categories on Naver Smartstore

Naver Smartstore’s top categories include Fashion, Beauty, Electronics, Home, Health, Baby, Food, Books, Sports, and Pet Supplies, catering to diverse shopper needs.

FAQs

E-Commerce Data Scraping FAQs

Our E-commerce data scraping FAQs provide clear answers to common questions, helping you understand the process and its benefits effectively.

E-commerce scraping services are automated solutions that gather product data from online retailers, providing businesses with valuable insights for decision-making and competitive analysis.

We use advanced web scraping tools to extract e-commerce product data, capturing essential information like prices, descriptions, and availability from multiple sources.

E-commerce data scraping involves collecting data from online platforms to analyze trends and gain insights, helping businesses improve strategies and optimize operations effectively.

E-commerce price monitoring tracks product prices across various platforms in real time, enabling businesses to adjust pricing strategies based on market conditions and competitor actions.

Let’s talk about your requirements

Let’s discuss your requirements in detail to ensure we meet your needs effectively and efficiently.

bg

Trusted by 1500+ Companies Across the Globe

decathlon
Mask-group
myntra
subway
Unilever
zomato

Send us a message