Executive Summary
In furniture and home goods e-commerce, stockouts are not just a logistics problem — they are a multi-million-dollar revenue leak. When a Home Depot or Wayfair listing goes out of stock for a popular item, every hour of unavailability translates directly to lost sales, displaced customers, and competitive market share gains for rivals. The challenge is that Home Depot & Wayfair Furniture Inventory Availability Intelligence is notoriously difficult to extract at scale: SKU counts run into the millions, stock signals are buried in dynamic page elements, and inventory states change minute-by-minute.
A leading mid-market furniture brand (referenced as "ClientCo" for confidentiality) approached Product Data Scrape with a clear mandate: build a real-time inventory monitoring system that could detect stockouts the moment they occurred, predict which SKUs were at risk of going out of stock in the next 48 hours, and feed inventory availability data directly into their demand forecasting models. The ability to scrape furniture stock availability data Home Depot & Wayfair in near real time was the critical missing piece in their supply chain analytics.
This case study walks through how our team designed and deployed a high-frequency scraping infrastructure across both retailers, capturing inventory signals from over 2.4 million furniture and home decor SKUs. The result: ClientCo recovered $3.8M in previously lost sales over twelve months, improved demand forecasting accuracy by 47%, and reduced inventory holding costs by 22%. The engagement also extended into our broader Pricing Intelligence, Digital Shelf Analytics, and Web Scraping API Services portfolio, providing an integrated retail intelligence platform.
The Client Challenge
ClientCo manufactures and distributes upholstered furniture, occasional tables, and storage solutions across the United States and Canada, selling through both their direct e-commerce channel and major third-party retailers including Home Depot, Wayfair, Lowe's, and Amazon. Despite a healthy top-line, the company faced four interconnected problems that traditional Extract Furniture & Home Decor Website Data methods could not solve.
1. Invisible Stockouts
ClientCo had no systematic way to know when their products were out of stock on partner platforms. Their merchandising team relied on ad-hoc manual checks, customer service complaints, and quarterly retailer reports — all of which surfaced stockouts days or weeks after they began. The need to detect furniture stockouts using inventory data intelligence in near real time was urgent and unmet.
2. Reactive Replenishment
Without real-time visibility into Wayfair and Home Depot inventory states, ClientCo's replenishment decisions were based on retailer-provided data feeds that lagged by 5 to 14 days. Top-selling SKUs would frequently sell out at retailer warehouses while ClientCo's distribution centers held excess inventory of slower-moving items. The capability to scrape Wayfair furniture stockouts using inventory data could close this loop, but no internal team had the technical infrastructure to do so reliably.
3. Forecasting Blindspots
ClientCo's demand forecasting models were built on point-of-sale data and shipment-out figures — both of which systematically understate true demand whenever stockouts suppress sales. Without Furniture Demand Forecasting using stock availability data, their forecasts perpetually under-projected hot-selling SKUs, causing recurring out-of-stocks and lost revenue.
4. Competitive Intelligence Gap
Beyond their own SKUs, ClientCo had no view into competitor stockout patterns. When a major rival's bestseller went out of stock at Home Depot, that was a 48-to-72-hour demand opportunity ClientCo's marketing and pricing teams could capture — but only if they knew about it. Real Home Depot Furniture stockouts using scraped inventory data was actionable competitive intelligence they were missing entirely.
ClientCo needed a unified system that could extract furniture product availability data ecommerce-wide, deliver alerts in minutes (not days), feed structured data into their forecasting models, and generate competitive intelligence — all while operating within the technical constraints of two of the largest furniture e-commerce platforms in North America.
Why Home Depot and Wayfair?
Home Depot and Wayfair represent two distinct but equally critical pillars of the North American furniture e-commerce landscape. Together, they account for approximately 38% of online furniture transactions in the US market, making scraping Home Depot and Wayfair for stock availability the most strategically valuable starting point for any inventory intelligence program.
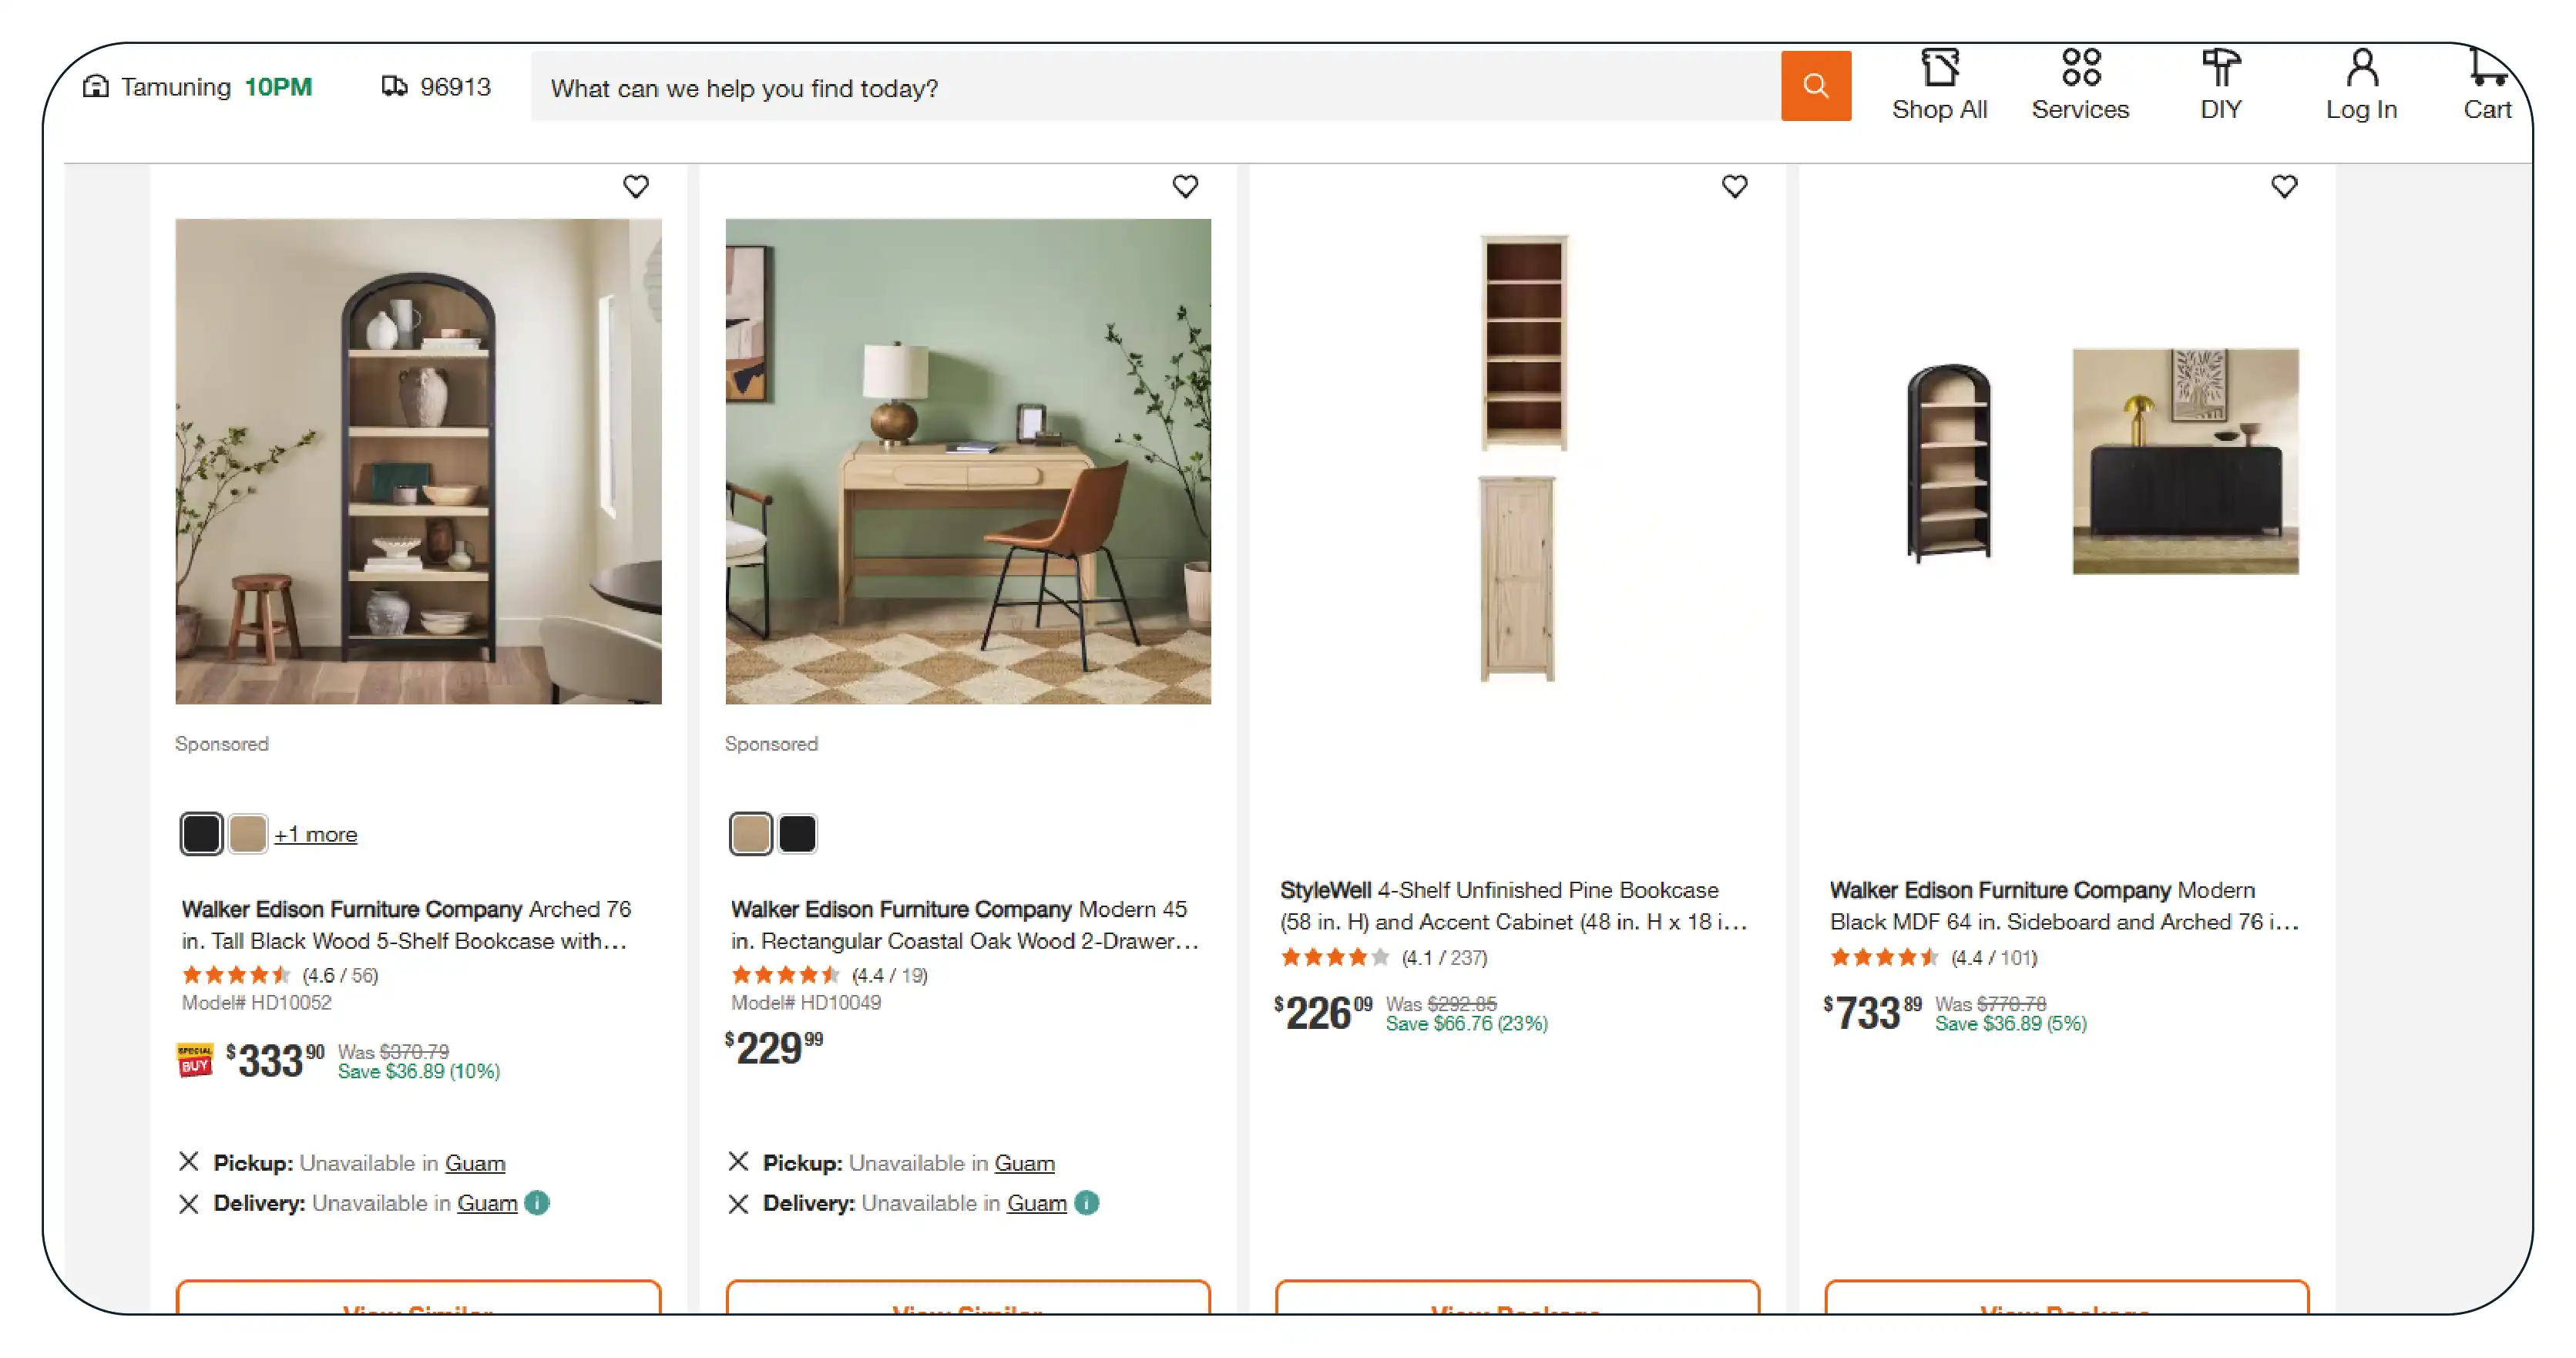
Home Depot: Functional Furniture & Outdoor
Home Depot's furniture category — outdoor seating, patio sets, garage storage, office furniture, and certain indoor categories — is heavily SKU-fragmented and seasonally volatile. Inventory states change rapidly during peak periods (spring patio season, holiday discount cycles), making real-time monitoring essential. Home Depot also operates a complex BOPIS (buy online, pick up in store) model where store-level inventory visibility matters as much as warehouse-level signals.
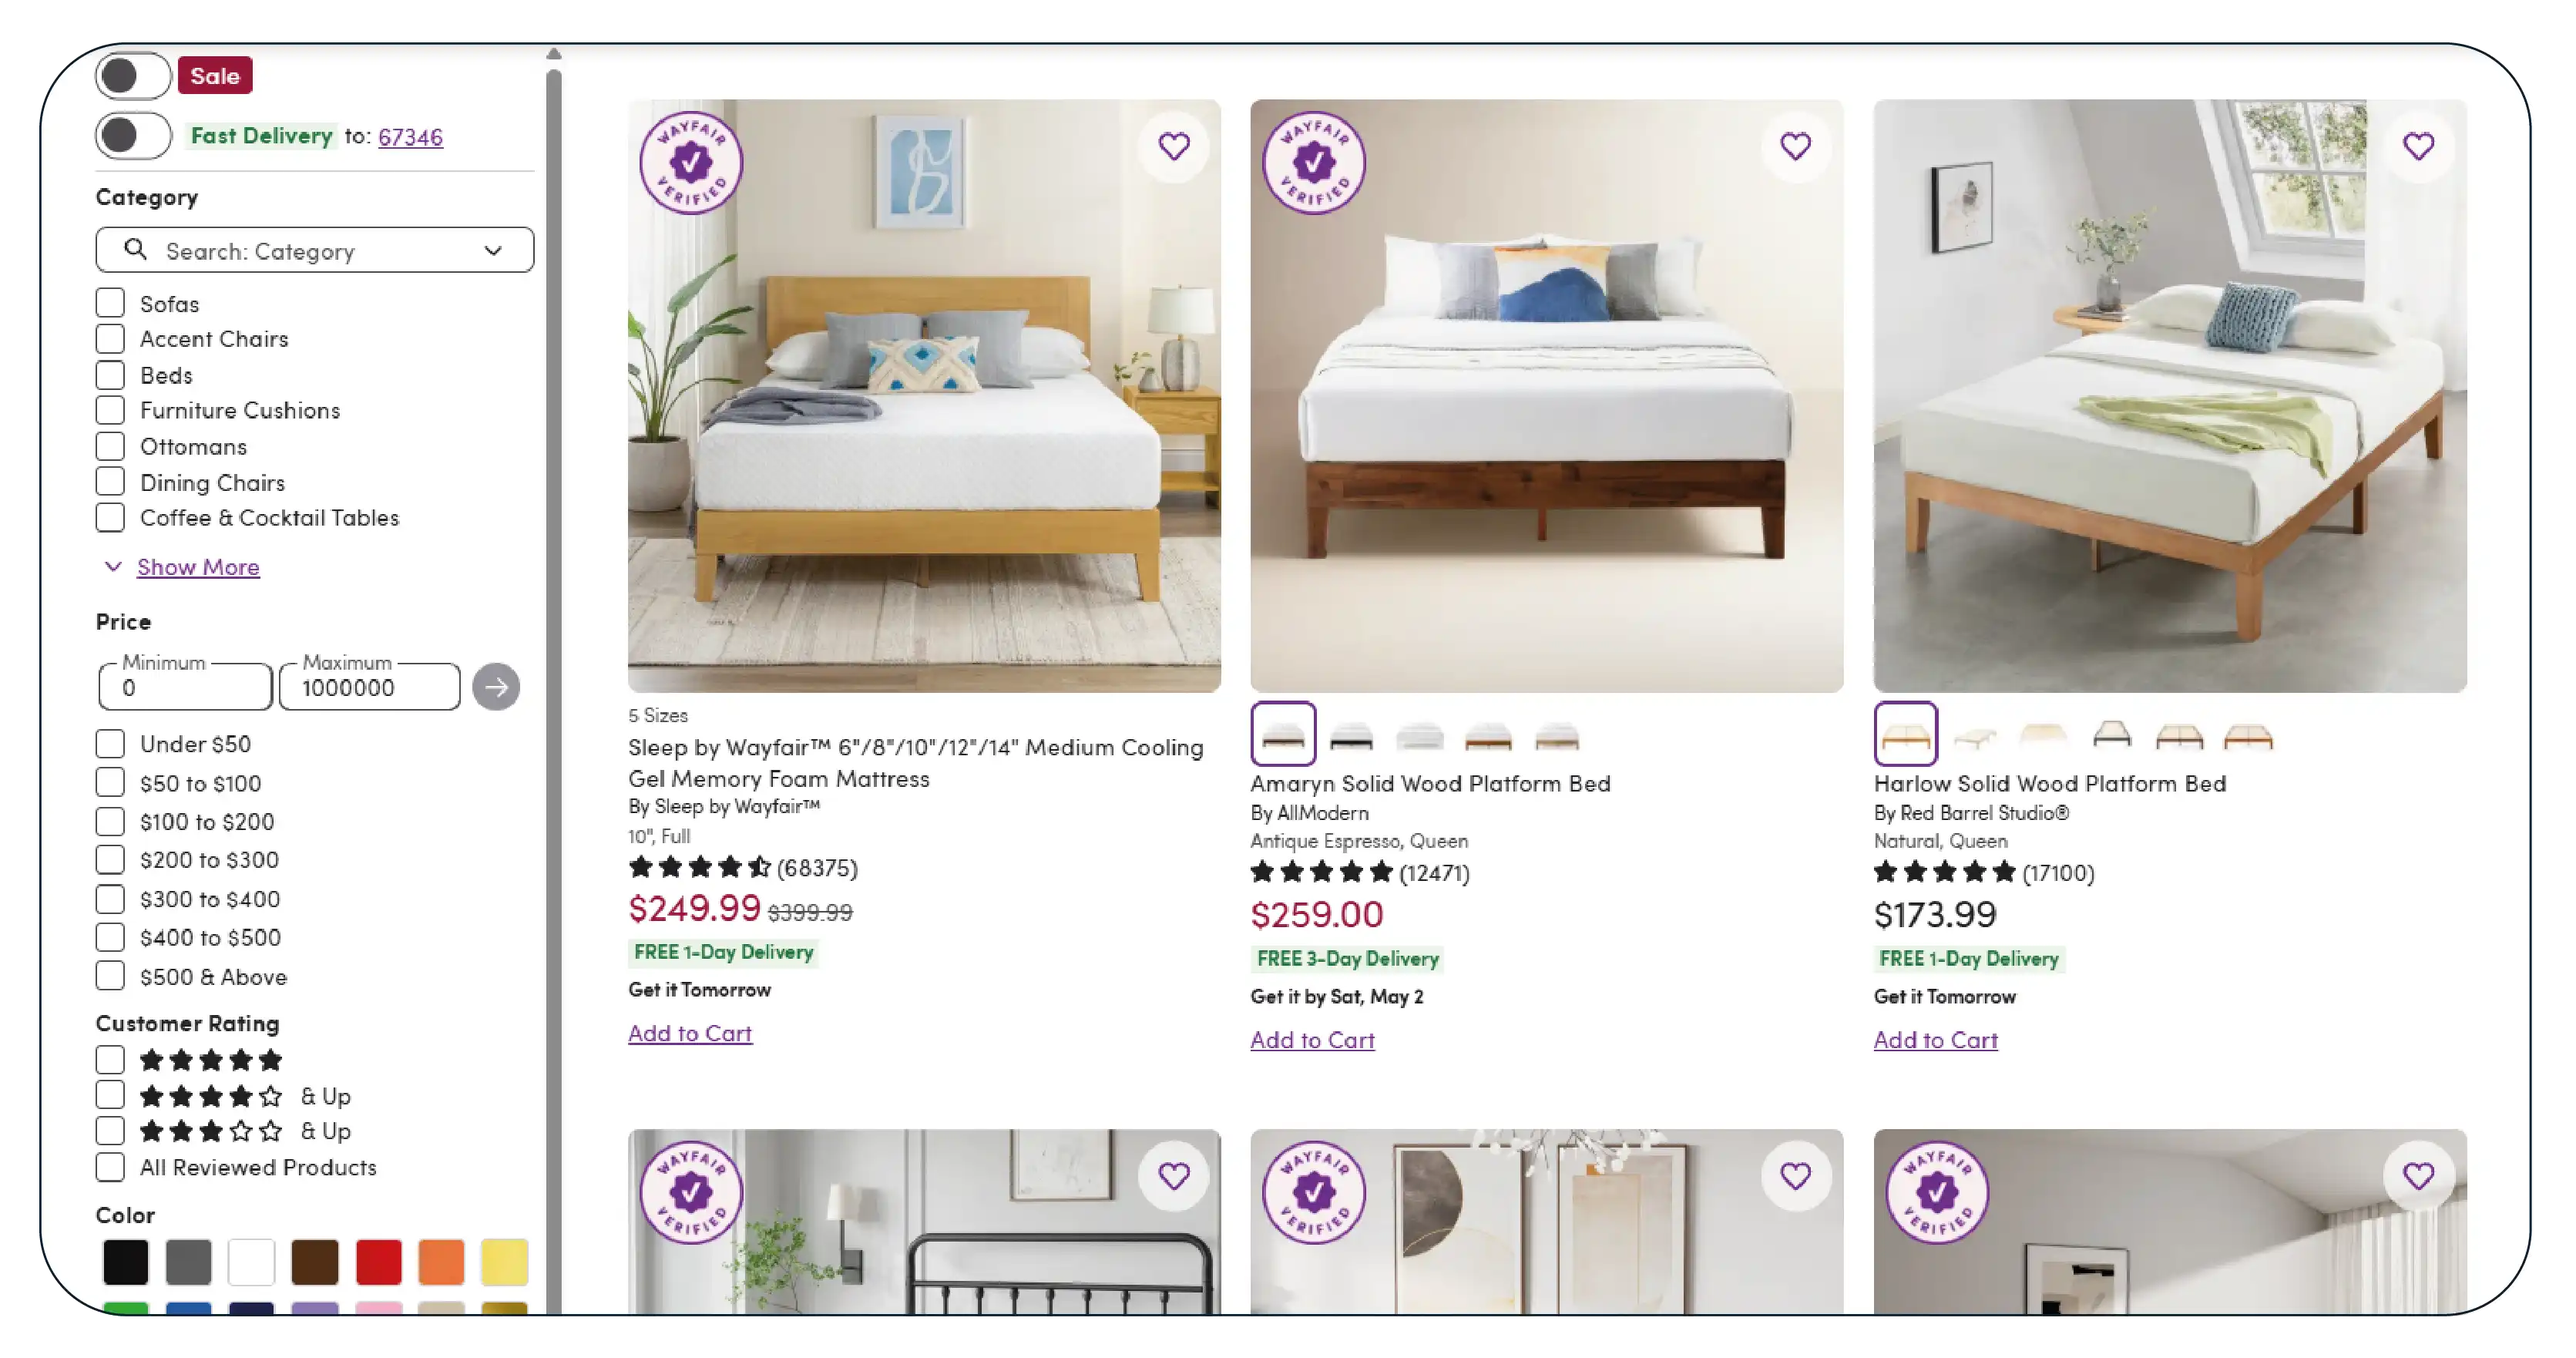
Wayfair: Pure-Play Furniture E-Commerce
Wayfair is the dominant pure-play furniture e-commerce platform in North America, with over 30 million active customers and a catalog exceeding 22 million SKUs across home decor, furniture, and lighting. Wayfair operates a network of fulfillment centers and uses sophisticated dynamic pricing and stocking algorithms — meaning a SKU can shift between in-stock, low-stock, backorder, and out-of-stock states multiple times per day. Effective Extract Wayfair Furniture & Home Decor Data requires high-frequency monitoring and intelligent change detection.
Combined, these two platforms gave ClientCo the visibility to monitor approximately 70% of their addressable third-party retail demand, with the data structures and refresh cadences needed to deliver true Real time Furniture stock availability tracking Home Depot & Wayfair.
Our Solution Architecture
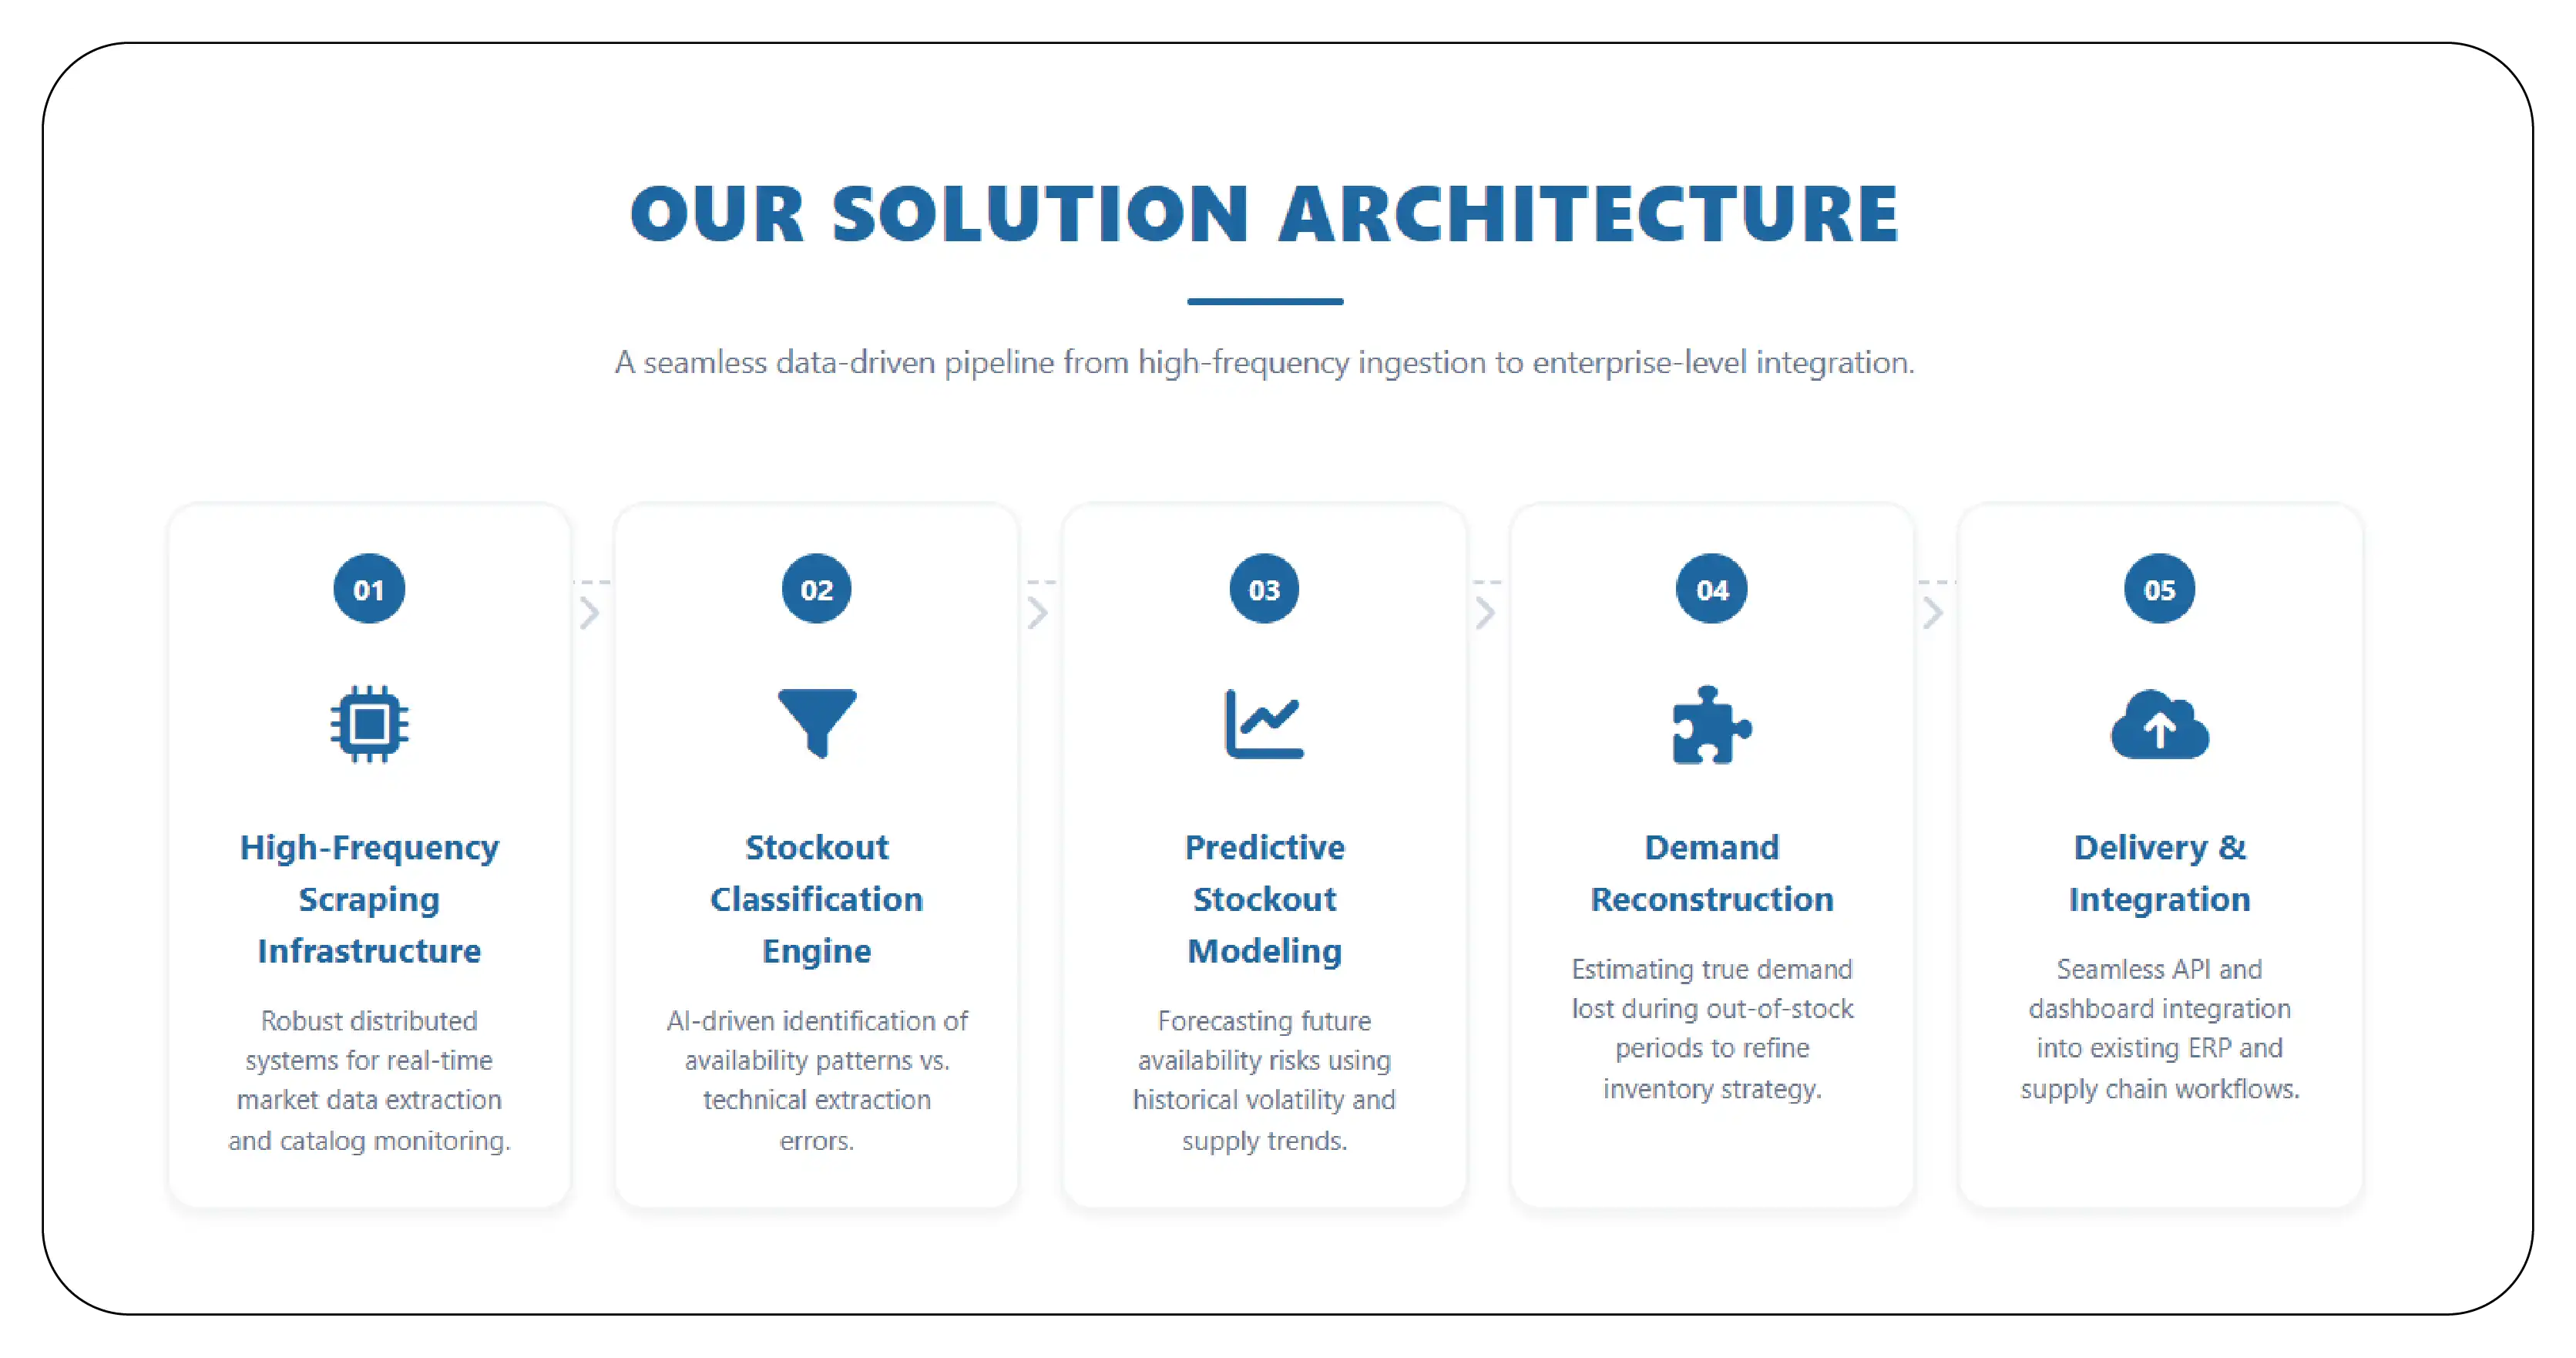
Our team designed a five-layer intelligence pipeline tailored to ClientCo's supply chain and merchandising workflow. The architecture was built on top of our existing Ecommerce Website Data Scraping infrastructure, with platform-specific extensions for the unique challenges of furniture inventory monitoring.
- Layer 1: High-Frequency Scraping Infrastructure
Inventory monitoring is fundamentally different from product catalog scraping. The data changes constantly, the signals are subtle, and missing a stockout window of even a few hours can defeat the purpose of the entire system. We deployed dedicated infrastructure for each platform with platform-aware crawl strategies.
Home Depot Inventory: Our Home Depot scraping infrastructure crawled approximately 480,000 furniture SKUs every 90 minutes during peak hours and every 4 hours during off-peak windows. Each capture included: availability status (in stock, limited stock, out of stock, available for backorder, discontinued), online inventory quantity tier (where exposed), nearest-store availability, BOPIS readiness flag, estimated delivery window, current price, MAP compliance status, and seller/marketplace flag. This delivered the foundational data for Home Depot Furniture stockouts using scraped inventory data at production scale.
Wayfair Inventory Pipeline: Wayfair's frequent inventory state transitions required a different approach: an event-driven scraping cadence that increased crawl frequency for SKUs showing volatility patterns. We monitored 1.9 million furniture SKUs with a baseline 2-hour refresh and rapid 30-minute refresh for high-velocity items.
- Layer 2: Stockout Classification Engine
Raw availability flags are noisy. A product showing "out of stock" for 20 minutes during inventory rebalancing is fundamentally different from a 72-hour true stockout. Our classification engine applied multiple signal layers to distinguish meaningful stockout events from transient noise.
- Persistence detection: Stockouts confirmed only after sustained unavailability across 3+ consecutive crawls.
- Variant rollup: When a SKU has multiple color or size variants, the engine evaluated stock state at both the variant level and the parent product level.
- False signal filtering: Page errors, anti-bot challenges, and CDN failures were filtered out via cross-validation across multiple data centers.
- Stockout severity scoring: A composite score combining duration, SKU revenue tier, search visibility position, and competitor availability — surfacing the highest-impact stockouts first.
- Layer 3: Predictive Stockout Modeling
Detection alone wasn't enough; ClientCo needed to predict stockouts before they happened. We built a machine learning model that analyzed historical stock state patterns, inventory tier transitions ("only 3 left" → "only 1 left"), price-velocity correlations, and seasonal demand curves to predict the probability of a stockout occurring within the next 24, 48, and 72 hours. This delivered the Furniture Demand Forecasting using stock availability data capability that ClientCo's internal team had previously been unable to build.
- Layer 4: Demand Reconstruction
Stockout data has a hidden value beyond replenishment alerts: it reveals the true demand that POS data hides. When a SKU is out of stock, sales drop to zero — making forecasting models systematically under-project demand. Our demand reconstruction algorithm used pre-stockout sell-through velocity, search demand signals, and post-restock recovery curves to estimate the "missing" demand suppressed by each stockout event. This corrected demand signal was fed into ClientCo's forecasting models, dramatically improving accuracy.
- Layer 5: Delivery & Integration
All intelligence was delivered through three integrated channels powered by our Web Scraping API Services:
- Real-time alerts via webhook into ClientCo's Slack and Microsoft Teams channels for any stockout exceeding the severity threshold.
- Hourly data feeds (JSON, CSV, Parquet) pushed to ClientCo's data warehouse, joining their internal inventory and POS data.
- An interactive dashboard with stockout timelines, predictive risk scores, and competitor availability comparisons — extending the broader Digital Shelf Analytics view across pricing, content, and availability.
Sample Data: What the Pipeline Actually Produced
To make the system concrete, here are representative outputs from the production pipeline. All values are illustrative but representative of real data structures delivered to ClientCo.
Sample 1: Home Depot Stockout Event
{
  "platform": "home_depot",
  "sku": "HD_SKU_318204776",
  "product_name": "5-Piece Outdoor Patio Conversation Set",
  "category": "Patio Furniture > Conversation Sets",
  "brand": "ClientCo",
  "current_stock_state": "out_of_stock",
  "previous_stock_state": "limited_stock",
  "stock_state_changed_at": "2026-04-26T14:32:00Z",
  "persistence_confirmed": true,
  "duration_hours": 18.4,
  "current_price_usd": 1299.00,
  "list_price_usd": 1499.00,
  "bopis_available": false,
  "nearest_store_availability": "not_available_50mi",
  "search_rank_before_stockout": 4,
  "search_rank_during_stockout": 22,
  "competitor_availability": [
    {"brand": "Competitor_A", "in_stock": true, "price": 1349},
    {"brand": "Competitor_B", "in_stock": true, "price": 1199}
  ],
  "severity_score": 8.7,
  "estimated_revenue_loss_per_day_usd": 4280,
  "captured_at": "2026-04-27T09:00:00Z"
}
Sample 2: Wayfair Inventory State
{
  "platform": "wayfair",
  "sku": "WF_SKU_W004128512",
  "product_name": "Modern Velvet Sectional Sofa, 112 inch",
  "category": "Living Room Furniture > Sectionals",
  "brand": "ClientCo",
  "stock_state": "low_stock",
  "stock_indicator_text": "Only 4 left in stock",
  "variant_availability": [
    {"color": "emerald_green", "stock_state": "in_stock"},
    {"color": "blush_pink", "stock_state": "low_stock"},
    {"color": "navy_blue", "stock_state": "out_of_stock"},
    {"color": "charcoal_grey", "stock_state": "in_stock"}
  ],
  "ships_from": "warehouse",
  "estimated_delivery_days": 7,
  "free_shipping_eligible": true,
  "current_price_usd": 1849.00,
  "price_changed_24h": false,
  "stockout_risk_24h": 0.78,
  "stockout_risk_48h": 0.91,
  "stockout_risk_72h": 0.96,
  "captured_at": "2026-04-27T11:30:00Z"
}
Sample 3: Demand Reconstruction Output
{
  "sku": "HD_SKU_318204776",
  "platform": "home_depot",
  "stockout_window": {
    "start": "2026-04-09T08:00:00Z",
    "end": "2026-04-12T16:00:00Z",
    "duration_hours": 80.0
  },
  "pre_stockout_velocity_units_per_day": 14.2,
  "search_demand_during_stockout": "elevated",
  "search_demand_index": 142,
  "post_restock_recovery_velocity": 22.6,
  "estimated_suppressed_demand_units": 47,
  "estimated_revenue_loss_usd": 13287.00,
  "forecast_correction_recommended": true,
  "corrected_baseline_demand_units_per_day": 18.4
}
Sample 4: Cross-Platform Stockout Heatmap
Beyond individual SKU events, ClientCo's dashboard surfaced category-level stockout patterns. The table below shows a representative weekly heatmap from the production system — exactly the kind of summary view that informs both ClientCo's replenishment decisions and their Pricing Intelligence strategy.
| Furniture Category |
HD Stockouts |
WF Stockouts |
Avg Duration (hrs) |
Est. Lost Revenue |
| Patio Conversation Sets |
23 |
12 |
46.2 |
$184,500 |
| Sectional Sofas |
8 |
31 |
62.8 |
$298,200 |
| Outdoor Dining Sets |
17 |
9 |
38.5 |
$142,800 |
| Storage Cabinets |
4 |
18 |
28.3 |
$67,400 |
| Office Chairs |
11 |
22 |
19.7 |
$89,300 |
| Bedroom Storage |
6 |
14 |
33.9 |
$58,700 |
Implementation Timeline
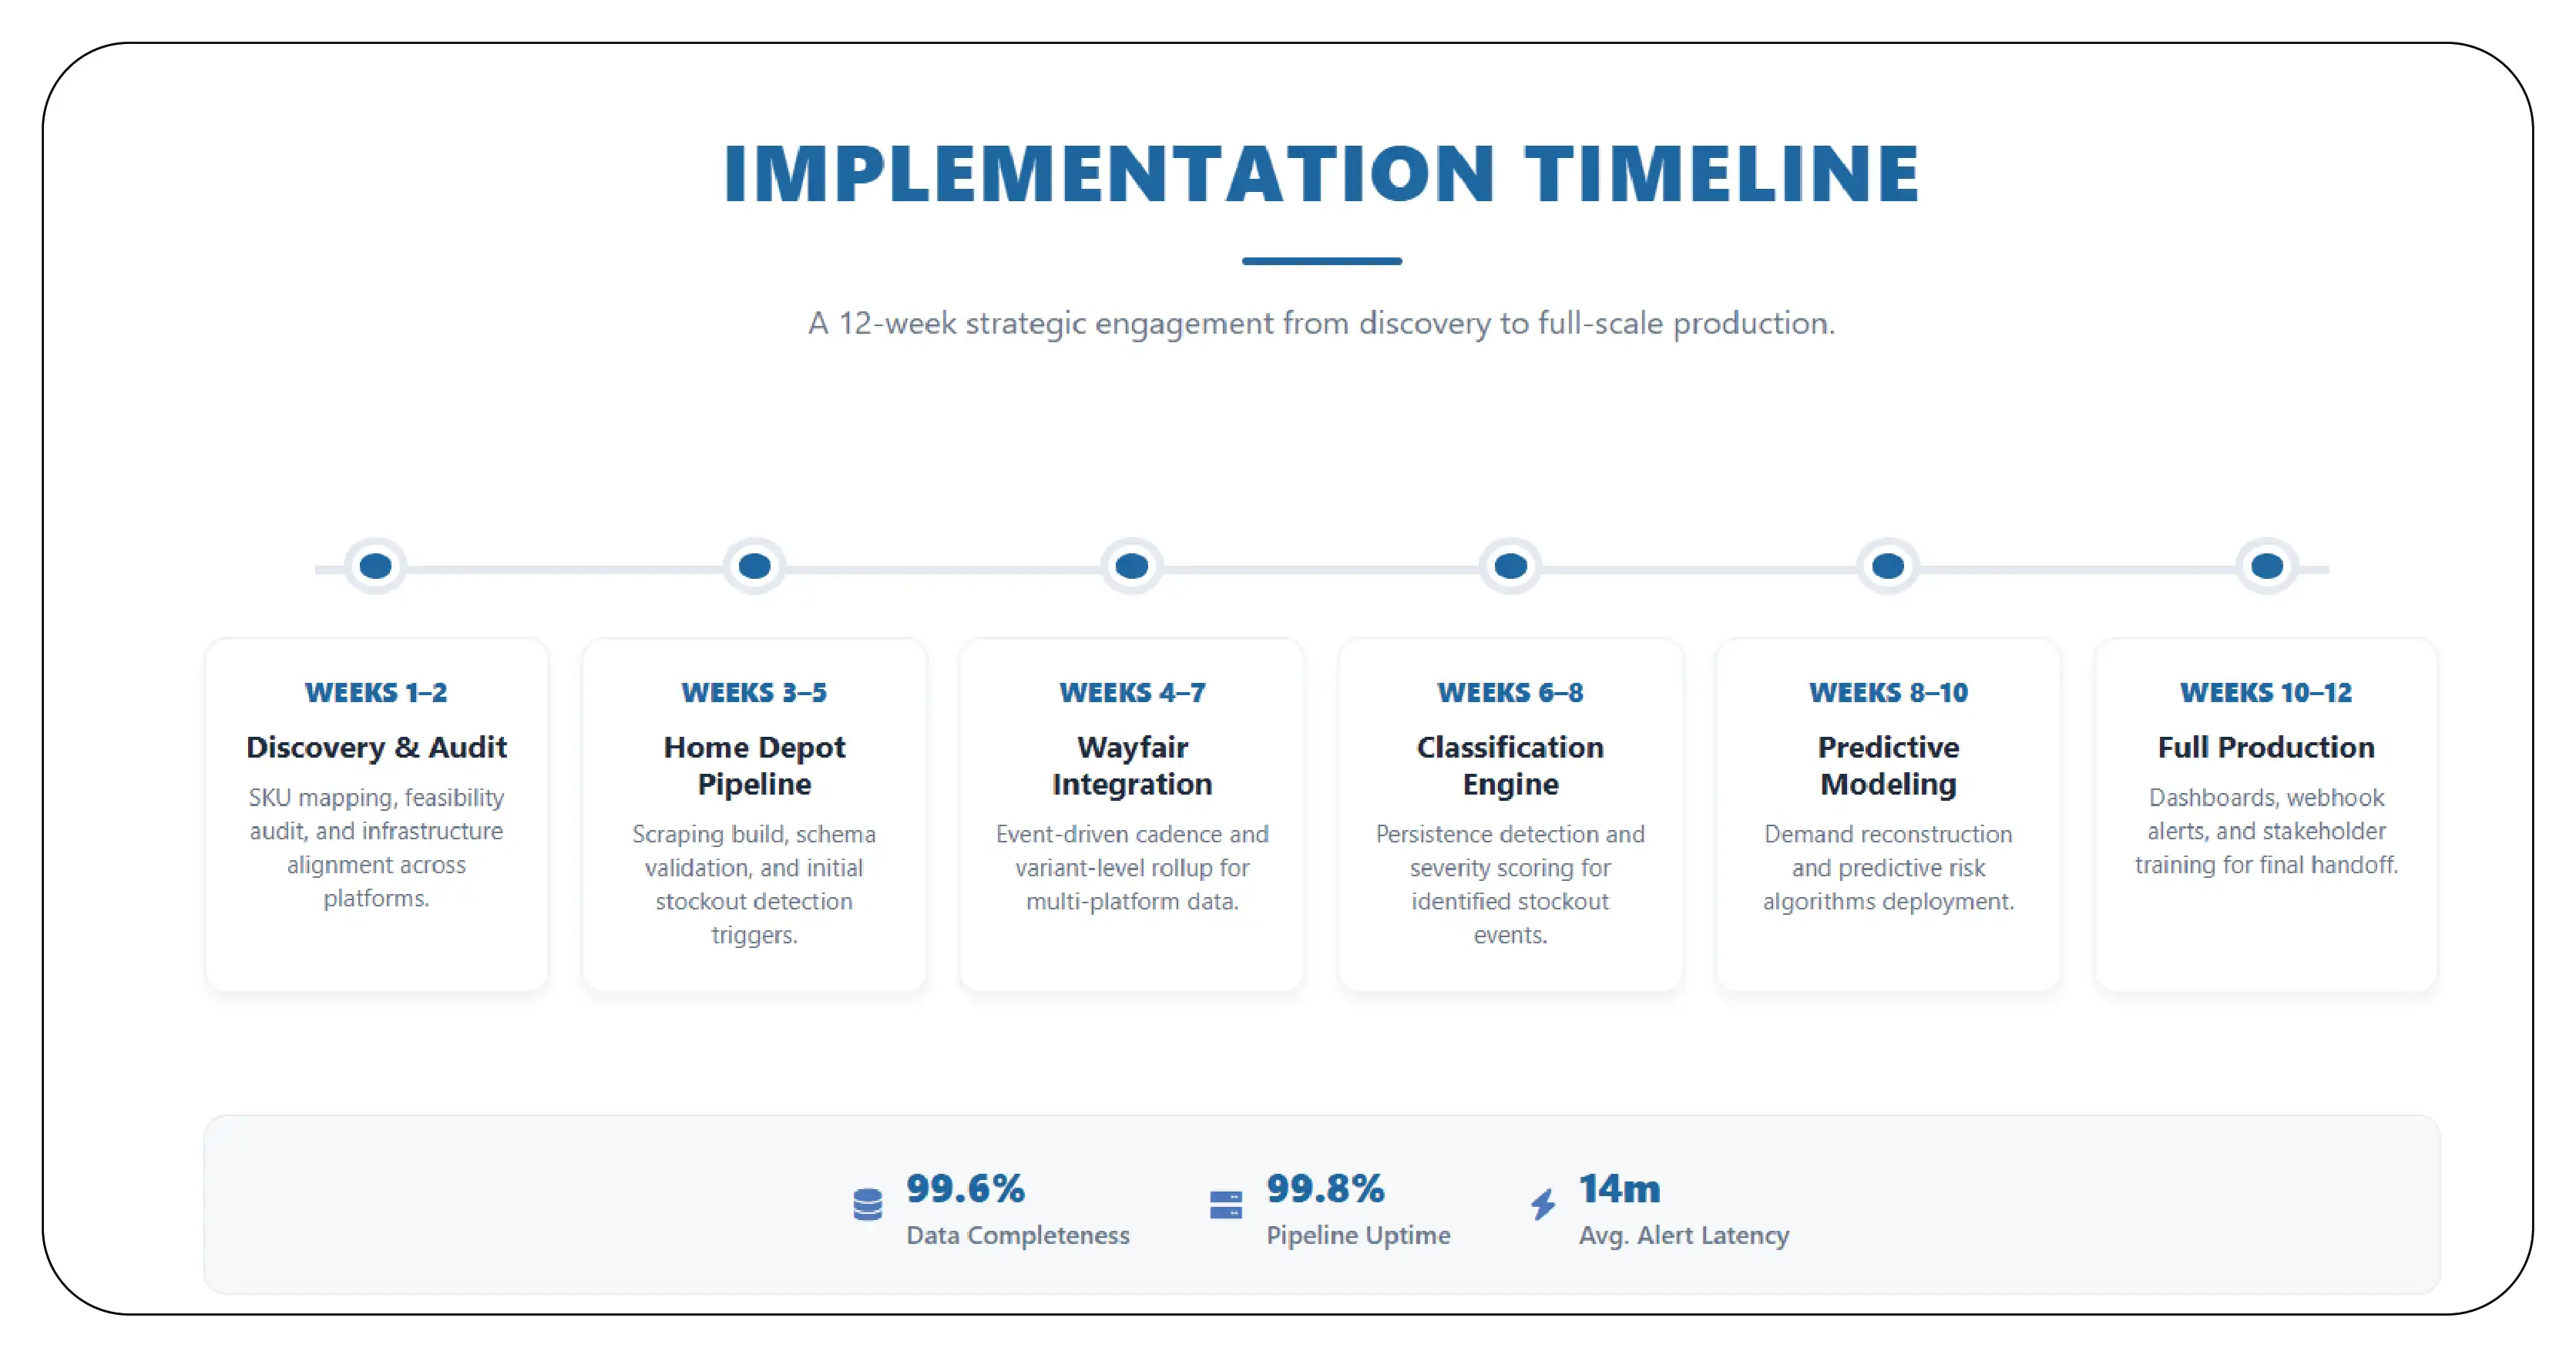
The engagement unfolded over 12 weeks from kickoff to full production, leveraging our existing infrastructure for Ecommerce Website Data Scraping and Digital Shelf Analytics:
- Weeks 1–2: Discovery, SKU mapping, and feasibility audit across both platforms.
- Weeks 3–5: Home Depot scraping pipeline build, schema validation, first stockout detections.
- Weeks 4–7: Wayfair scraping pipeline with event-driven cadence and variant-level rollup.
- Weeks 6–8: Stockout classification engine with persistence detection and severity scoring.
- Weeks 8–10: Predictive modeling and demand reconstruction algorithms.
- Weeks 10–12: Dashboard, webhook alerts, data warehouse integration, stakeholder training.
Throughout the build, our team maintained 99.6% data completeness and 99.8% pipeline uptime. Anti-bot challenges across both platforms were handled via rotating proxy infrastructure, request fingerprint randomization, adaptive crawl pacing, and intelligent retry logic. Alert latency from stockout occurrence to ClientCo’s Slack channel averaged 14 minutes — well under the 30-minute SLA.
Results: 12-Month Business Impact
After twelve months in production, the impact on ClientCo's business was substantial across revenue, inventory efficiency, and forecasting accuracy.
| Metric |
Result |
Detail |
| Recovered Revenue |
$3.8M |
From faster stockout response & predictive replenishment |
| Forecasting Accuracy |
+47% |
MAPE reduced from 31% to 16.5% |
| Stockout Detection Speed |
96% faster |
From 11 days average → 14 minutes |
| Inventory Holding Costs |
−22% |
Better demand alignment, less safety stock |
| Out-of-Stock Rate |
−58% |
Top-50 SKU stockouts dropped from 12% → 5% |
| Competitive Capture |
+$1.1M |
Revenue from competitor stockout alerts |
Why Product Data Scrape?
Several capabilities differentiated our team from generic scraping vendors and made this engagement possible. The combination of high-frequency infrastructure, machine learning sophistication, and integration with our broader eCommerce Dataset, Pricing Intelligence, and Digital Shelf Analytics offerings gave ClientCo a complete retail intelligence partner.
- High-frequency, low-latency infrastructure: Inventory monitoring requires fundamentally different infrastructure than catalog scraping. Our pipelines are engineered for sub-30-minute detection latency at scale.
- Platform-specific expertise: Home Depot and Wayfair each have distinct technical structures, anti-bot defenses, and inventory signal patterns. Generic scrapers miss critical signals; we have current expertise on both.
- Machine learning depth: Predictive stockout modeling and demand reconstruction require real ML engineering, not just data extraction. Our team brought both.
- Cross-platform integration: Stockout intelligence is most powerful when joined with pricing, content, and competitive data. Our broader Digital Shelf Analytics platform delivers this integration natively.
- Production-grade SLAs: 99.8% uptime, 99.6% data completeness, defined alert latency targets, and dedicated technical support meant the system was a dependable operational tool, not a fragile experiment.
Lessons Learned
The engagement surfaced several insights that apply broadly to any furniture or home goods brand considering similar inventory intelligence infrastructure to extract furniture product availability data ecommerce-wide.
- Stockouts are silent revenue killers: Most brands underestimate stockout cost by 3-5x because the lost revenue is invisible in their POS data. Reconstructing suppressed demand reveals the true scale of the problem.
- Detection speed compounds: A 14-minute detection window enables operational responses (replenishment, paid media activation, pricing changes) that an 11-day detection window cannot. The value isn't linear — it's exponential.
- Variant-level monitoring matter:. Aggregate stock state hides critical signals about color, size, and configuration preferences that drive product line decisions.
- Competitor stockouts are opportunity windows: A competitor's bad day is your good day — but only if you know about it within hours, not weeks.
- Forecasting models need stockout-aware demand signals: Without demand reconstruction, forecasting models perpetually under-project hot SKUs, creating recurring out-of-stocks in a vicious cycle.
Conclusion
In furniture e-commerce, inventory visibility is no longer a back-office concern — it is a frontline competitive weapon. Stockouts at Home Depot and Wayfair represent silent revenue losses that compound daily and erode market share. Without real-time Home Depot & Wayfair Furniture Inventory Availability Intelligence, brands operate with a structural blind spot.
The ClientCo engagement proves what proper Real time Furniture stock availability tracking Home Depot & Wayfair delivers: $3.8M recovered revenue, 47% better forecasting accuracy, 96% faster stockout detection, and 22% lower inventory holding costs. The capability to scrape furniture stock availability data Home Depot & Wayfair transformed ClientCo from reactive to predictive.
In 2026, inventory blindness is an existential business problem. Brands that build real-time intelligence will lead the category — those relying on lagging POS data will lose share. The technology to extract furniture product availability data ecommerce-wide is mature and proven. Product Data Scrape is ready to partner with you across Pricing Intelligence, Digital Shelf Analytics, and Web Scraping API Services.
FAQs
1. How quickly can stockouts be detected?
Average latency is 14 minutes from confirmed unavailability. Sub-10-minute detection is available for high-priority SKUs through accelerated crawl cadences.
2. Why scrape inventory data instead of using retailer feeds?
Retailer feeds lag 5–14 days, cover only your own SKUs, and miss granular signals like variant-level availability and search rank changes. Scrape Wayfair furniture stockouts using inventory data directly from listings for real-time visibility and full competitor coverage.
3. Is scraping Home Depot and Wayfair legal?
Yes. We extract only publicly accessible data, never collect personal information, and respect robots directives. Our methodology aligns with established legal precedent on public web scraping.
4. How does this integrate with our forecasting models?
Furniture Demand Forecasting using stock availability data is delivered via JSON, CSV, or Parquet feeds into your data warehouse. Most clients integrate within 2–4 weeks and see MAPE improve by 30–50% through demand reconstruction.
5. Can you monitor competitor stockouts?
Yes. We track any defined competitor SKU set across Home Depot, Wayfair, and other retailers. Brands using Home Depot Furniture stockouts using scraped inventory data for competitive intelligence typically capture 6–12% incremental category revenue.
6. What furniture categories do you cover?
Full furniture and home goods taxonomy — patio, sectionals, dining, bedroom, office, storage, lighting, rugs, mattresses, and decor. We can also Extract Furniture & Home Decor Website Data from Lowe's, Amazon, Costco, Target, IKEA, and Overstock.
7. How is pricing structured?
Engagements scale by SKU coverage, refresh frequency, and delivery complexity. Most furniture brand engagements fall in the mid-five to low-six figures annually, with ROI typically demonstrated within 90 days. Custom eCommerce Dataset and Ecommerce Website Data Scraping options fit any budget.
8. How long does deployment take?
Full deployment runs 10–14 weeks. Accelerated 6-week pilots are available for brands needing faster time-to-value with core stockout detection.
9. Self-serve API or managed service?
Both. Our Web Scraping API Services offer direct integration for technical teams. Fully managed engagements include dashboards, alerts, and dedicated support — most clients start managed and transition components to API over time.
10. Can this combine with pricing and content monitoring?
Absolutely. Our Digital Shelf Analytics and Pricing Intelligence platforms unify inventory, pricing, content, and search rank into one view. Most clients expand from stockout monitoring into full digital shelf analytics within 6–12 months.


.webp)


