
Introduction
Every retailer running a competitive pricing program depends on one assumption: the data they're acting on is accurate. Yet across the industry, pricing teams routinely make multi-million-dollar decisions based on data that is partially stale, incompletely matched, or silently corrupted. The reason is simple — most organizations don't actually measure the quality of their pricing intelligence. They consume it, trust it, and only discover the gaps after a margin disaster or a missed competitive move.
This is exactly the problem Pricing Intelligence accuracy Metrics for retailers are designed to solve. By establishing a quantitative framework for scoring data quality — completeness, freshness, match accuracy, and price correctness — pricing teams can make data trust an explicit, measurable, and improvable property of their operations. Product Data Scrape has spent the past decade refining these scoring methodologies in production environments across 150+ enterprise clients.
In this guide, we'll walk through the complete framework: the four foundational accuracy metrics, the formulas for scoring each, real sample data showing what good and bad accuracy look like in practice, the 2026 industry benchmarks every pricing team should aim for, and how to operationalize Real-time Pricing accuracy monitoring metrics across a working pricing intelligence program.
Why Pricing Data Accuracy Scoring Matters
Pricing intelligence has become foundational to modern retail strategy — competitor monitoring, dynamic repricing, MAP enforcement, and promotional response all depend on accurate competitor price data flowing into decision systems. But "accurate" is rarely defined precisely. Most retail pricing teams operate on vague trust in their data sources, which leads to four specific problems.
- Silent decision corruption: When 8% of competitor price points are stale or mismatched, 8% of repricing decisions are quietly wrong. The financial impact compounds invisibly until a margin review surfaces it.
- Vendor accountability gaps: Without explicit accuracy SLAs, pricing data vendors are evaluated on coverage and cost — never on the quality of what they deliver. Bad data persists for years.
- Repricer instability: Automated repricing engines are extremely sensitive to data quality. A single mismatched product can cascade into pricing errors across an entire category.
- Lost competitive response: Stale data means the competitor moved 18 hours ago and your team is still debating yesterday's market.
Establishing rigorous Pricing data Accuracy Scoring Metrics for intelligence transforms pricing data from a black box into a measurable input — one with explicit quality scores, defined thresholds, and clear escalation paths when scores drop. The retailers winning the 2026 pricing war are the ones who measure their data, not just consume it.
The Four Pillars of Pricing Intelligence Accuracy
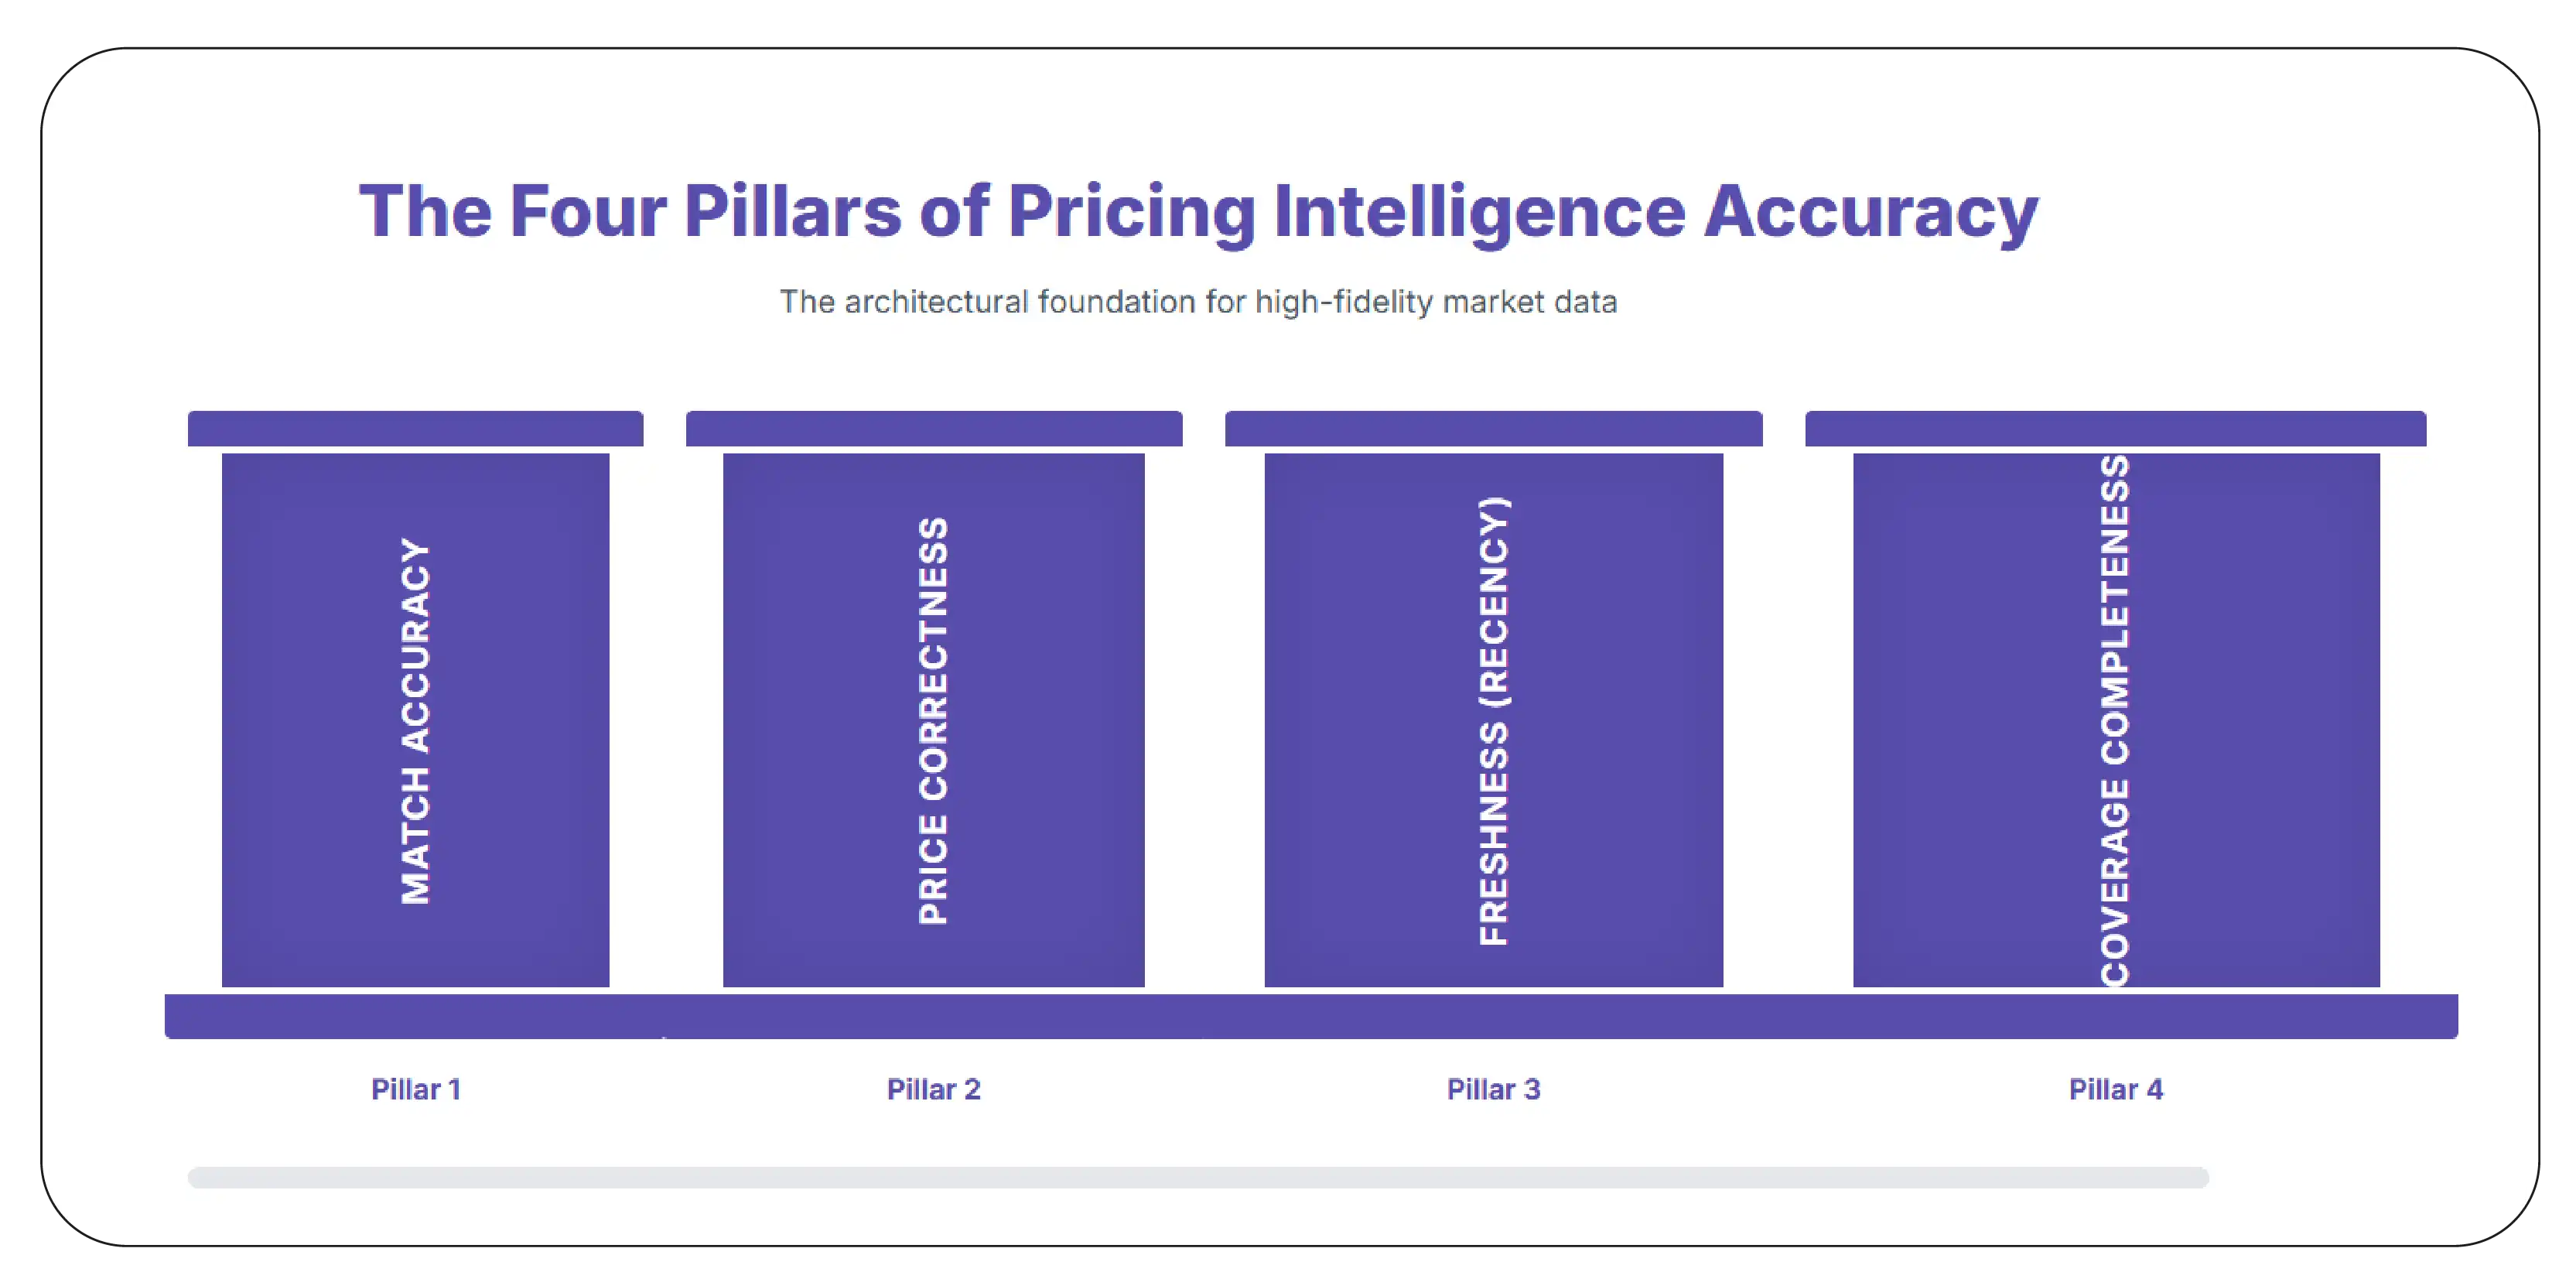
Pricing data accuracy decomposes cleanly into four orthogonal dimensions. Each measures a distinct failure mode, and each requires its own scoring formula. Comprehensive Competitor Pricing accuracy Benchmarking requires tracking all four — measuring only one or two creates false confidence.
Match accuracy measures whether the competitor product you're tracking actually corresponds to your own product. A 32-inch Samsung TV matched against a 43-inch Samsung TV produces a perfectly precise price comparison that is operationally useless. Match accuracy failures are the most insidious because the data looks clean even when it's wrong.
Scoring Formula:
Accuracy Score = (Correctly matched products / Total matched products) × 100
Sub-metrics to track
Exact match rate: Products matched on UPC/EAN/MPN with verified identifier alignment.
Fuzzy match precision: Products matched on title/attribute similarity that survive a manual audit.
Variant disambiguation rate: Color, size, and configuration matching for SKU-level precision.
False positive rate: Products incorrectly matched (cousin products, accessories, bundles).
- Pillar 2: Price Correctness
Price correctness measures whether the price captured matches what a real consumer would see on the page at the time of capture. Failures here come from list-price-vs-sale-price confusion, dynamic pricing variations, regional price differences, and incorrect parsing of promotional displays (e.g., capturing the strikethrough MRP instead of the actual selling price).
Scoring Formula
Price Correctness Score = (Correct prices on audit / Total prices audited) × 100
Sub-metrics to track
Sale price capture accuracy: Did the system pick up the actual current selling price?
Promotional price extraction: BOGO, percent-off, multi-buy correctly parsed.
Regional/dynamic price handling: Geographic and time-based variations captured correctly.
Currency and tax inclusion: Consistent treatment across markets.
- Pillar 3: Freshness (Recency)
Freshness measures the gap between when a price changed on the competitor site and when your system reflects that change. In categories with high pricing volatility — electronics, fashion, FMCG — even a few hours of staleness can lead to materially wrong decisions. Real-time Pricing accuracy monitoring metrics specifically focus on this dimension.
Scoring Formula
Freshness Score = (Data points within target staleness window / Total data points) × 100
Sub-metrics to track
Median staleness: Half of records are fresher than this age — typically 2–6 hours for high-velocity categories.
P95 staleness: 95% of records are fresher than this — the tail metric that catches systemic delays.
Stockout latency: How quickly stockout transitions are reflected in the data.
Refresh cadence adherence: Are SLA-defined refresh intervals actually being met?
- Pillar 4: Coverage Completeness
Coverage completeness measures whether the data you expect to be there is actually there. A pricing program that should track 12,000 SKUs across 8 competitors but is silently failing on 11% of them produces a confident-looking dashboard with hidden gaps. Coverage failures are the most common and the easiest to ignore.
Scoring Formula
Coverage Completeness Score = (Successful data captures / Expected data captures) × 100
Sub-metrics to track
SKU-level capture rate: What percentage of expected SKUs returned data?
Field-level completeness: Of captured records, how many have all expected fields populated?
Source-level success rate: Per-competitor or per-domain capture success.
Variant coverage: Are all expected color/size/configuration variants represented?
The Composite Accuracy Score
The four pillars combine into a single weighted composite score that gives pricing teams a one-number summary of data trust. The exact weights depend on category and use case, but a typical formulation is:
Composite Pricing Accuracy Score (CPAS) =
    0.30 × Match Accuracy
  + 0.25 × Price Correctness
  + 0.25 × Freshness
  + 0.20 × Coverage Completeness

Example: Match=96%, Price=98%, Fresh=89%, Coverage=92%
CPAS = 0.30(96) + 0.25(98) + 0.25(89) + 0.20(92)
     = 28.8 + 24.5 + 22.25 + 18.4
     = 93.95 / 100
This composite is the headline metric exposed in pricing dashboards. Drill-downs into each pillar surface the specific failure mode when CPAS drops below threshold. Competitor Price scraping accuracy measurement becomes operationally tractable when expressed this way — pricing teams can finally answer the question "how much should I trust today's data?"
Sample Data: Accuracy Scoring in Practice
Below are representative outputs from a production accuracy monitoring system. All values are illustrative but reflect real data structures delivered to enterprise pricing teams.
Sample 1: SKU-Level Accuracy Record
{
  "captured_at": "2026-04-28T11:00:00Z",
  "client_sku": "INTERNAL_SKU_47281",
  "competitor": "competitor_a",
  "competitor_url": "https://competitor-a.com/products/wireless-earbuds",
  "match_score": {
    "value": 0.97,
    "method": "upc_exact",
    "verified": true,
    "confidence_band": "high"
  },
  "price_correctness": {
    "captured_price_inr": 1899,
    "audit_price_inr": 1899,
    "match": true,
    "promotional_context_captured": true
  },
  "freshness": {
    "last_captured": "2026-04-28T10:42:00Z",
    "staleness_minutes": 18,
    "within_sla": true
  },
  "coverage": {
    "all_fields_present": true,
    "missing_fields": []
  },
  "composite_accuracy_score": 96.4
}
Sample 2: Aggregated Daily Quality Report
{
    "report_date": "2026-04-28",
    "client": "ClientCo",
    "total_skus_monitored": 12480,
    "competitors_tracked": 8,
    "total_data_points_24h": 198720,
    "accuracy_pillars": {
    "match_accuracy": {
    "score": 96.2,
    "exact_match_rate": 87.4,
    "fuzzy_match_precision": 94.1,
    "false_positive_rate": 1.3
    },
    "price_correctness": {
    "score": 98.1,
    "audit_sample_size": 500,
    "audit_pass_rate": 98.1
    },
    "freshness": {
    "score": 91.8,
    "median_staleness_minutes": 47,
    "p95_staleness_minutes": 218
    },
    "coverage_completeness": {
    "score": 94.5,
    "sku_capture_rate": 96.7,
    "field_completeness_rate": 98.2
    }
    },
    "composite_score": 95.2,
    "trend_7d": "stable",
    "alerts_triggered": 2
}
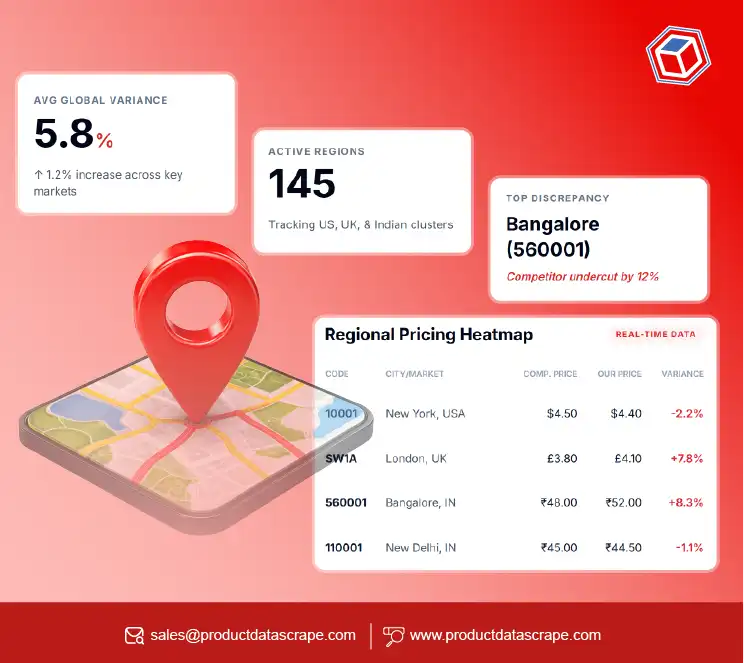
Sample 3: Competitor-Level Accuracy Heatmap
Aggregating accuracy across competitors reveals which sources are reliable and which need investigation. The table below shows a representative weekly summary that pricing teams use to prioritize remediation efforts.
| Competitor |
Match |
Price |
Freshness |
Coverage |
CPAS |
| Competitor A |
96.2% |
98.1% |
91.8% |
94.5% |
95.2 |
| Competitor B |
89.4% |
95.7% |
78.3% |
88.1% |
87.8 |
| Competitor C |
94.8% |
97.2% |
88.6% |
92.4% |
93.4 |
| Competitor D |
97.1% |
96.9% |
94.2% |
95.8% |
96.1 |
| Competitor E |
92.5% |
94.1% |
82.7% |
90.3% |
90.4 |
2026 Industry Benchmarks
Knowing your accuracy scores is necessary but not sufficient — you also need to know what scores are good. Based on observation across 150+ enterprise pricing programs in 2026, here are the benchmark thresholds that separate elite, competitive, and underperforming pricing intelligence operations.
| Metric |
Underperforming |
Competitive |
Elite |
Stretch |
| Match Accuracy |
< 90% |
90 – 94% |
95 – 97% |
98%+ |
| Price Correctness |
< 95% |
95 – 97% |
98 – 99% |
99.5%+ |
| Freshness (P95 staleness) |
> 12 hrs |
4 – 12 hrs |
1 – 4 hrs |
< 1 hr |
| Coverage Completeness |
< 88% |
88 – 93% |
94 – 97% |
98%+ |
| Composite Score (CPAS) |
< 90 |
90 – 93 |
94 – 96 |
97+ |
These benchmarks shift by category. High-velocity electronics and fashion typically demand tighter freshness thresholds (1-hour P95 instead of 4), while stable categories like office supplies can operate comfortably at the higher end of the staleness range. Establishing the right Scrape Competitive Metrics Pricing Benchmarking baseline for your specific category is part of any rigorous pricing program build-out.
How to Build an Accuracy Scoring Program
Going from "we trust our data" to "we measure our data" is a meaningful operational lift. Here's the practical roadmap most retailers follow when building a rigorous accuracy program — based on patterns observed across enterprise deployments.
Step 1: Establish Audit Sampling
Set up a daily random sample of 200–500 captured records that get manually verified against the source page at capture time. This sample is your ground truth — every accuracy metric ultimately calibrates against it. Over time, this audit data feeds into automated detection models that flag suspicious records without manual review.
Step 2: Instrument the Four Pillars
Implement scoring for match accuracy, price correctness, freshness, and coverage. Each pillar needs its own logging, dashboarding, and threshold alerting. Most enterprise teams use Web Scraping API Services infrastructure that exposes accuracy metadata as part of every record returned, making this instrumentation straightforward.
Step 3: Define Thresholds & SLAs
Set explicit accuracy thresholds for each pillar, by category and competitor. When a threshold is breached, the system should alert the data engineering team and downstream consumers (repricers, dashboards) so they can quarantine or downweight the affected segment until quality is restored.
Step 4: Build Trend Tracking
Single-day accuracy snapshots are useful but limited. Trend tracking — week-over-week, month-over-month — reveals slow degradations that point-in-time monitoring misses. Many issues (anti-bot rule changes on competitor sites, schema drift, regional rollouts) appear as gradual accuracy slides before becoming visible operational problems.
Step 5: Integrate With Decision Systems
The final and most strategic step: feed accuracy scores into the pricing decision systems themselves. Repricers should weight competitor signals by their CPAS — high-confidence competitors influence price more heavily, low-confidence competitors are downweighted or excluded. This is the difference between using accuracy data and operating with it.
Where Accuracy Scoring Pays Off
Repricer Decision Quality
Automated repricing engines that incorporate competitor-level accuracy scores consistently produce better margin outcomes than those treating all sources as equally trustworthy. Margin improvement of 1.5–3% on repriced SKUs is typical.
Vendor Accountability
When pricing data vendors are held to explicit accuracy SLAs (e.g., "CPAS ≥ 94 with 95% confidence"), they invest in the engineering to deliver. This shifts the procurement conversation from price-per-record to value-per-record.
Category Strategy Confidence
Pricing strategy decisions — where to invest, where to retreat, where to lead — are dramatically improved when category teams know exactly which data they can trust. Product Competitive Pricing Services teams operating with explicit accuracy scores report 30–40% faster strategic decision cycles.
Audit and Compliance
Regulated categories (pharma, alcohol) and contractual MAP relationships require defensible audit trails. Accuracy scoring provides exactly this — a quantitative basis for every pricing decision and competitor assertion.
Common Pitfalls in Accuracy Scoring
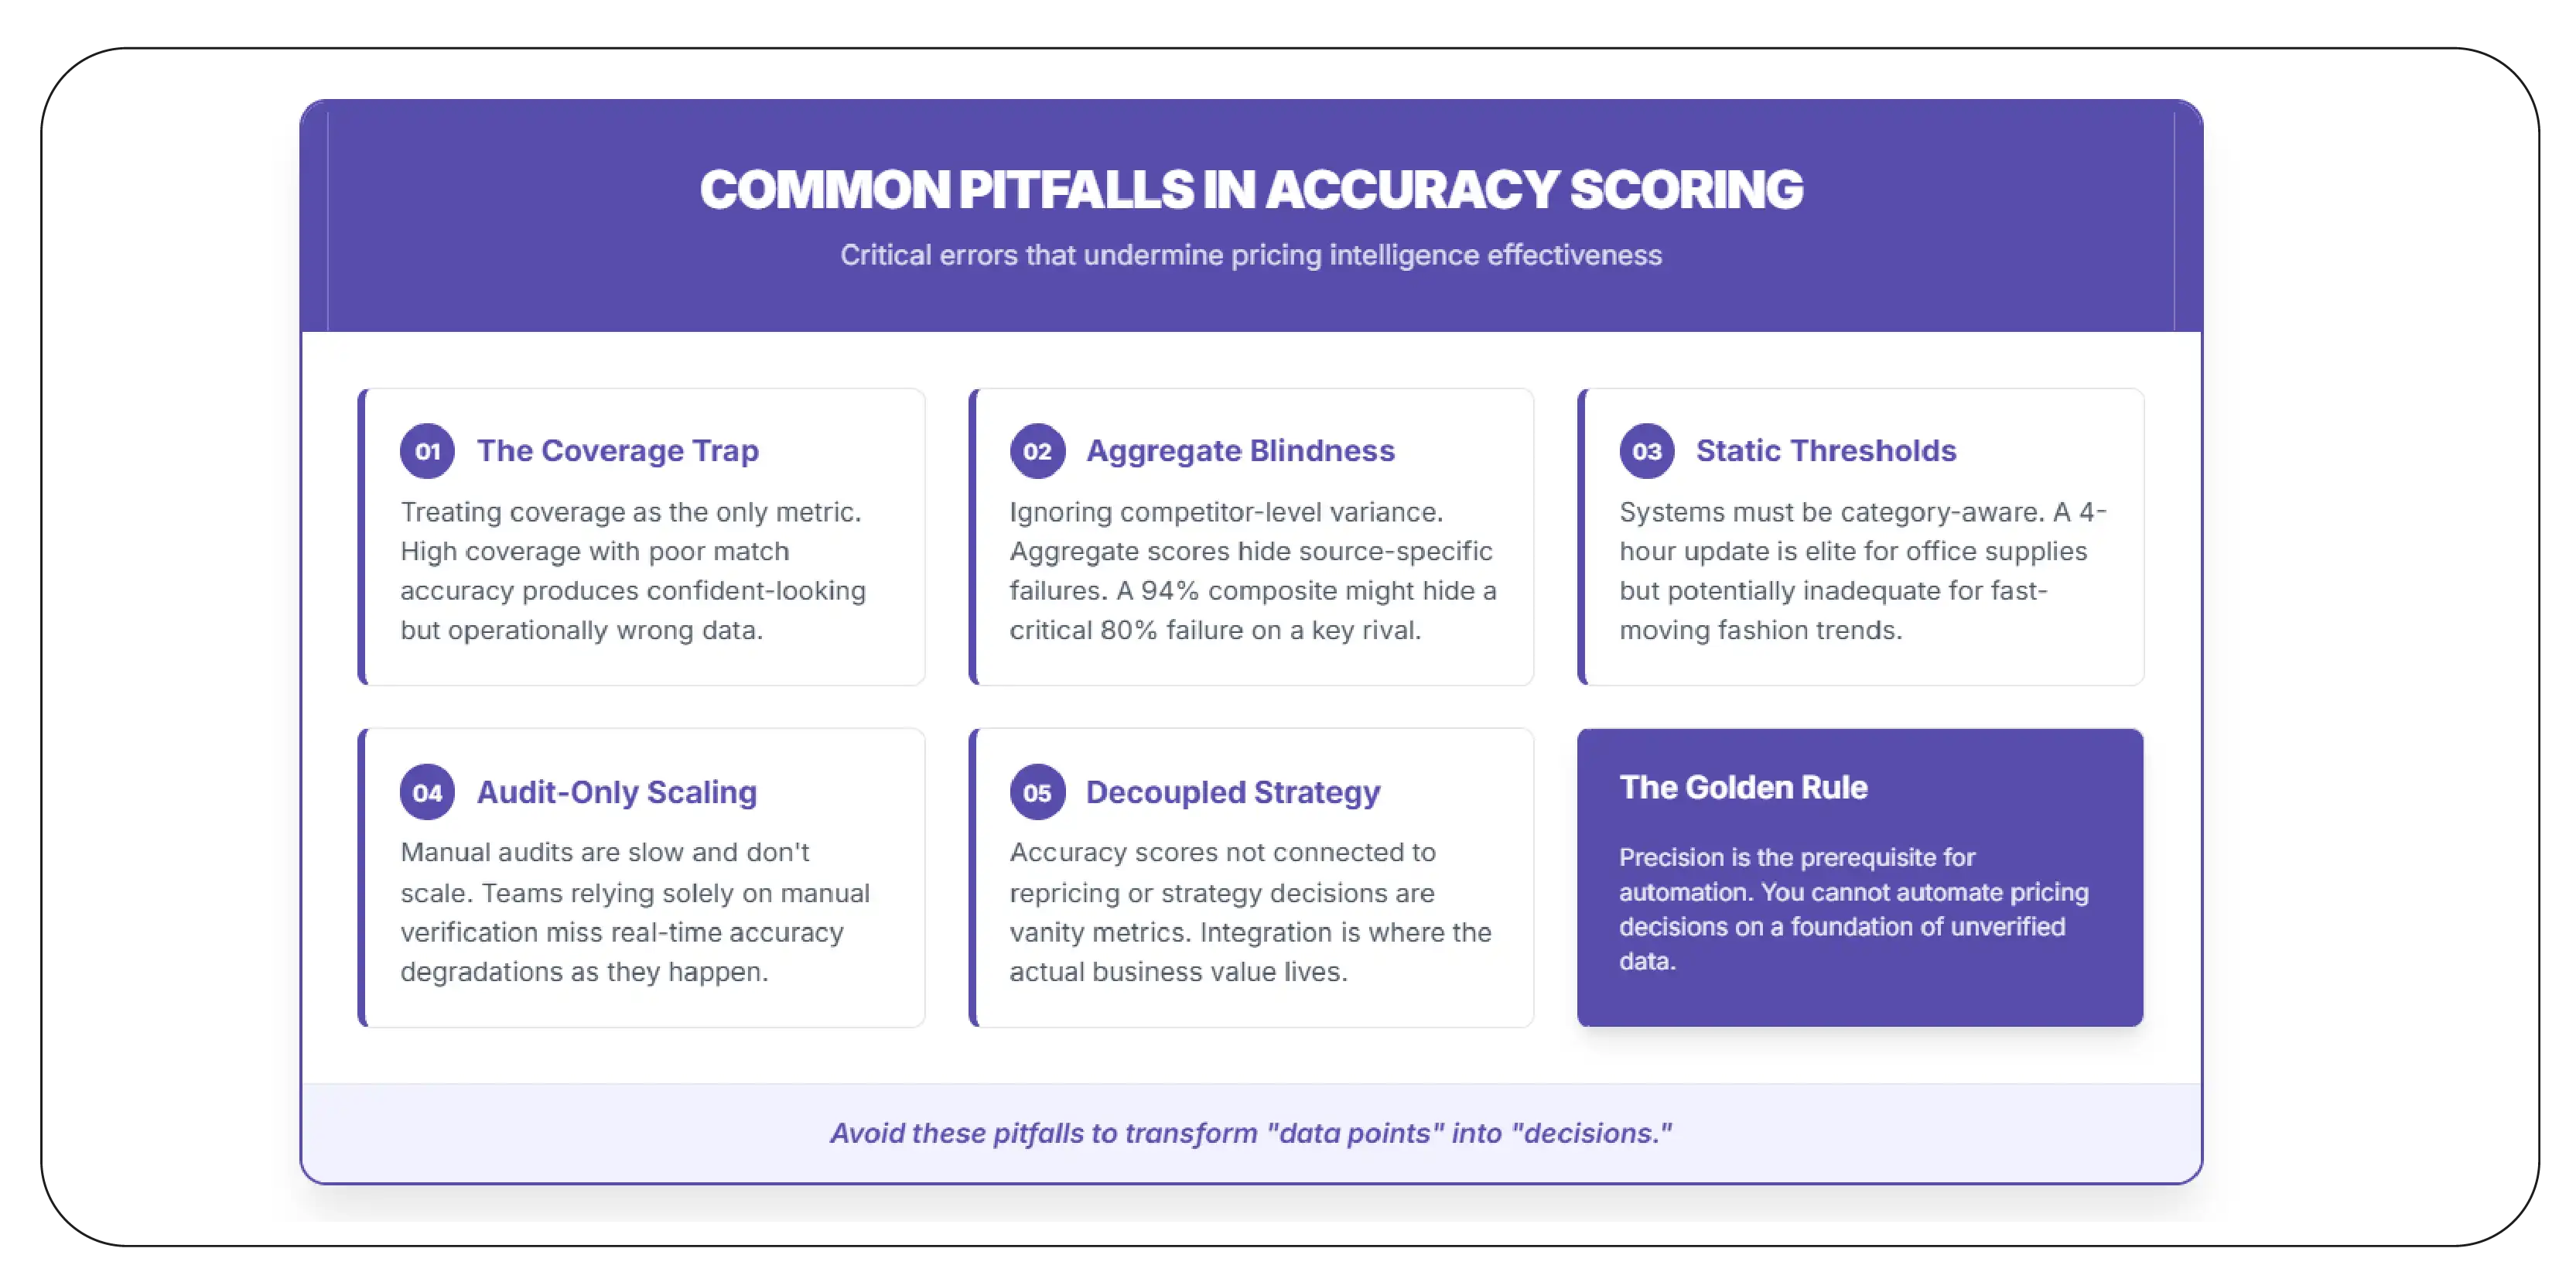
- Treating coverage as the only metric: High coverage with poor match accuracy produces confident-looking but operationally wrong data. All four pillars matter.
- Ignoring competitor-level variance: Aggregate scores hide source-specific failures. A 94% composite that's actually 99% on Competitor A and 80% on Competitor B is much more actionable when disaggregated.
- Static threshold systems: Thresholds should be category-aware. A 4-hour P95 is elite for office supplies and inadequate for fashion.
- Audit-only verification: Manual audits are slow and don't scale. Teams that rely solely on audit miss real-time accuracy degradations.
- Decoupled accuracy and decisions: Accuracy scores that aren't connected to repricing or strategy decisions are vanity metrics. The integration is where the value lives.
Why Product Data Scrape
Several capabilities differentiate our service from generic scraping vendors when it comes to building rigorous accuracy scoring programs.
- Embedded accuracy metadata: Every record returned by our pipelines carries match scores, freshness timestamps, and coverage flags as native fields — instrumentation is built in, not bolted on.
- Audit infrastructure included: Daily audit sampling and verification workflows are part of our standard delivery, providing the ground truth needed to calibrate automated accuracy detection.
- Category-aware benchmarking: Benchmarks tuned to your specific category (electronics, fashion, FMCG, etc.) rather than generic averages.
- Production-grade SLAs: 99.5% uptime, defined CPAS thresholds, alert latency targets, and dedicated technical support — accuracy as a contractual commitment, not a marketing claim.
- Integrated decision systems: Accuracy scores flow directly into repricers, dashboards, and strategic analytics — closing the loop between data quality and business outcomes.
Conclusion
In 2026, the pricing intelligence advantage no longer comes from having data — it comes from knowing how good your data is. Retailers and brands that operationalize Pricing Intelligence accuracy Metrics for retailers gain a structural advantage: every decision is informed by an explicit confidence score, every vendor is accountable to defined SLAs, and every drift in data quality is detected early instead of discovered after a margin disaster.
The framework is simple but rigorous: four pillars (match, price, freshness, coverage), one composite score, defined benchmarks, and tight integration into decision systems. The retailers who implement this discipline are the ones who win the 2026 pricing war — not because they have more data, but because they trust it more wisely.
Ready to score, benchmark, and improve your pricing intelligence accuracy? Product Data Scrape partners with enterprise retailers to deploy Pricing Intelligence Services, Digital Shelf Analytics, and accuracy scoring frameworks across all major e-commerce platforms — combining proven methodology with production-grade infrastructure.
FAQs
1. What is the most important pricing accuracy metric?
It depends on the use case, but match accuracy is foundational — if your competitor product matching is wrong, every other metric becomes meaningless. After match, freshness usually matters most for high-velocity categories, and price correctness for MAP enforcement.
2. How often should accuracy be measured?
Daily at minimum, hourly for high-velocity categories. Real-time monitoring with threshold alerting is the gold standard — most enterprise teams aim for sub-15-minute alert latency when CPAS drops below SLA.
3. Should accuracy scores affect repricing decisions?
Absolutely. Repricers that incorporate per-record confidence scores significantly outperform naive systems. High-CPAS records influence pricing decisions more strongly; low-CPAS records are downweighted or excluded entirely.
4. What's an audit sample size that actually works?
200–500 records per day is typical for enterprise programs. Smaller samples produce noisy accuracy estimates; larger samples become operationally expensive without proportional benefit. Stratify the sample across competitors and categories.
5. Can accuracy scoring be automated end-to-end?
Mostly yes. Match accuracy can be automated through rule-based and ML-driven verification. Price correctness can be automated through periodic source re-fetching. Freshness and coverage are inherently automated. Manual audits remain valuable as a calibration ground truth, but they need not be the primary mechanism.
6. How do accuracy benchmarks vary by category?
Significantly. Electronics and fashion demand sub-1-hour freshness; office supplies tolerate 12+ hours. Match accuracy thresholds are tighter in branded electronics (where UPC/MPN make exact matching feasible) and looser in unbranded fashion (where fuzzy matching is the norm). Always benchmark within your category.
7. What technology infrastructure supports accuracy scoring?
Most enterprise programs use dedicated Web Scraping API Services that expose accuracy metadata as part of every record. Combined with a data warehouse, dashboarding tools, and alerting infrastructure, the full stack typically runs on standard cloud services. The methodology matters more than the specific tools.
8. Can we build accuracy scoring in-house, or do we need a vendor?
Both paths work. In-house builds give full control but require dedicated data engineering investment. Vendor solutions accelerate time-to-value and bring benchmarking data from across their client base. Many enterprise teams hybrid — vendor-supplied data with in-house accuracy scoring layered on top.
9. How do we ensure pricing data is collected legally?
Reputable providers extract only publicly accessible data, never collect personal information, and respect robots directives. The methodology aligns with established legal precedent on public web scraping. Always work with your legal team during onboarding and choose providers who can demonstrate compliance.
10. What's the ROI of investing in accuracy scoring?
Typical results from enterprise programs: 1.5–3% margin improvement on repriced SKUs, 30–40% faster strategic decisions, 50–70% reduction in pricing-error escalations, and meaningful reduction in vendor cost through SLA-based contracting. Most programs reach positive ROI within 6 months.
About Product Data Scrape
We are a leading e-commerce data intelligence company serving 150+ global brands and retailers including Decathlon, Flipkart, L'Oréal, Myntra, P&G, Subway, Unilever, and Zomato. We deliver competitive pricing intelligence, Digital Shelf Analytics, MAP monitoring, Web Scraping API Services, and Scrape Data From Any Ecommerce Websites capabilities across 45+ countries. Our infrastructure processes over 130 million product data points monthly with 99.5% uptime.
For Competitor Pricing accuracy Benchmarking, custom accuracy scoring frameworks, or any cross-platform retail data engagement, contact our solutions team.


.webp)


