
Introduction
The U.S. grocery sector is undergoing a rapid transformation driven by data, automation, and changing consumer expectations. Inflationary pressures, evolving dietary preferences, and the rise of omnichannel shopping have made demand prediction more complex than ever. To stay competitive, U.S. grocery chains use data scraping APIs to capture real-time insights from digital shelves, competitor pricing, promotions, and assortment changes. These data-driven approaches help retailers move from reactive decision-making to predictive strategy. By leveraging a scalable Web Data Intelligence API, grocery chains can continuously monitor online signals and convert raw data into actionable intelligence. This blog explores how data scraping APIs are reshaping grocery analytics, enabling retailers to forecast shopping trends for 2026 with greater accuracy. Through structured datasets, historical comparisons from 2020 to 2026, and predictive modeling, grocery leaders are aligning pricing, inventory, and promotions with consumer demand before trends fully emerge.
Transforming Retail Visibility Through Advanced Analytics
Modern grocery forecasting relies on consolidated insights derived from Retail Data Analytics for Market Insights that integrate scraped pricing, promotions, and availability data across competitors. Between 2020 and 2026, grocery chains that adopted advanced analytics saw measurable improvements in forecast accuracy and category performance.
| Year |
Forecast Accuracy (%) |
Avg. Price Change YoY |
Promo Intensity Index |
| 2020 |
68% |
4.2% |
1.1 |
| 2021 |
71% |
5.1% |
1.2 |
| 2022 |
74% |
6.8% |
1.4 |
| 2023 |
77% |
5.9% |
1.3 |
| 2024 |
80% |
4.6% |
1.2 |
| 2025 |
83% |
4.1% |
1.2 |
| 2026 |
85% |
3.8% |
1.1 |
These improvements highlight how analytics-driven retailers use historical scraped data to identify pricing elasticity, optimize promotions, and anticipate category-level demand shifts ahead of competitors.
Building Comprehensive Product-Level Intelligence
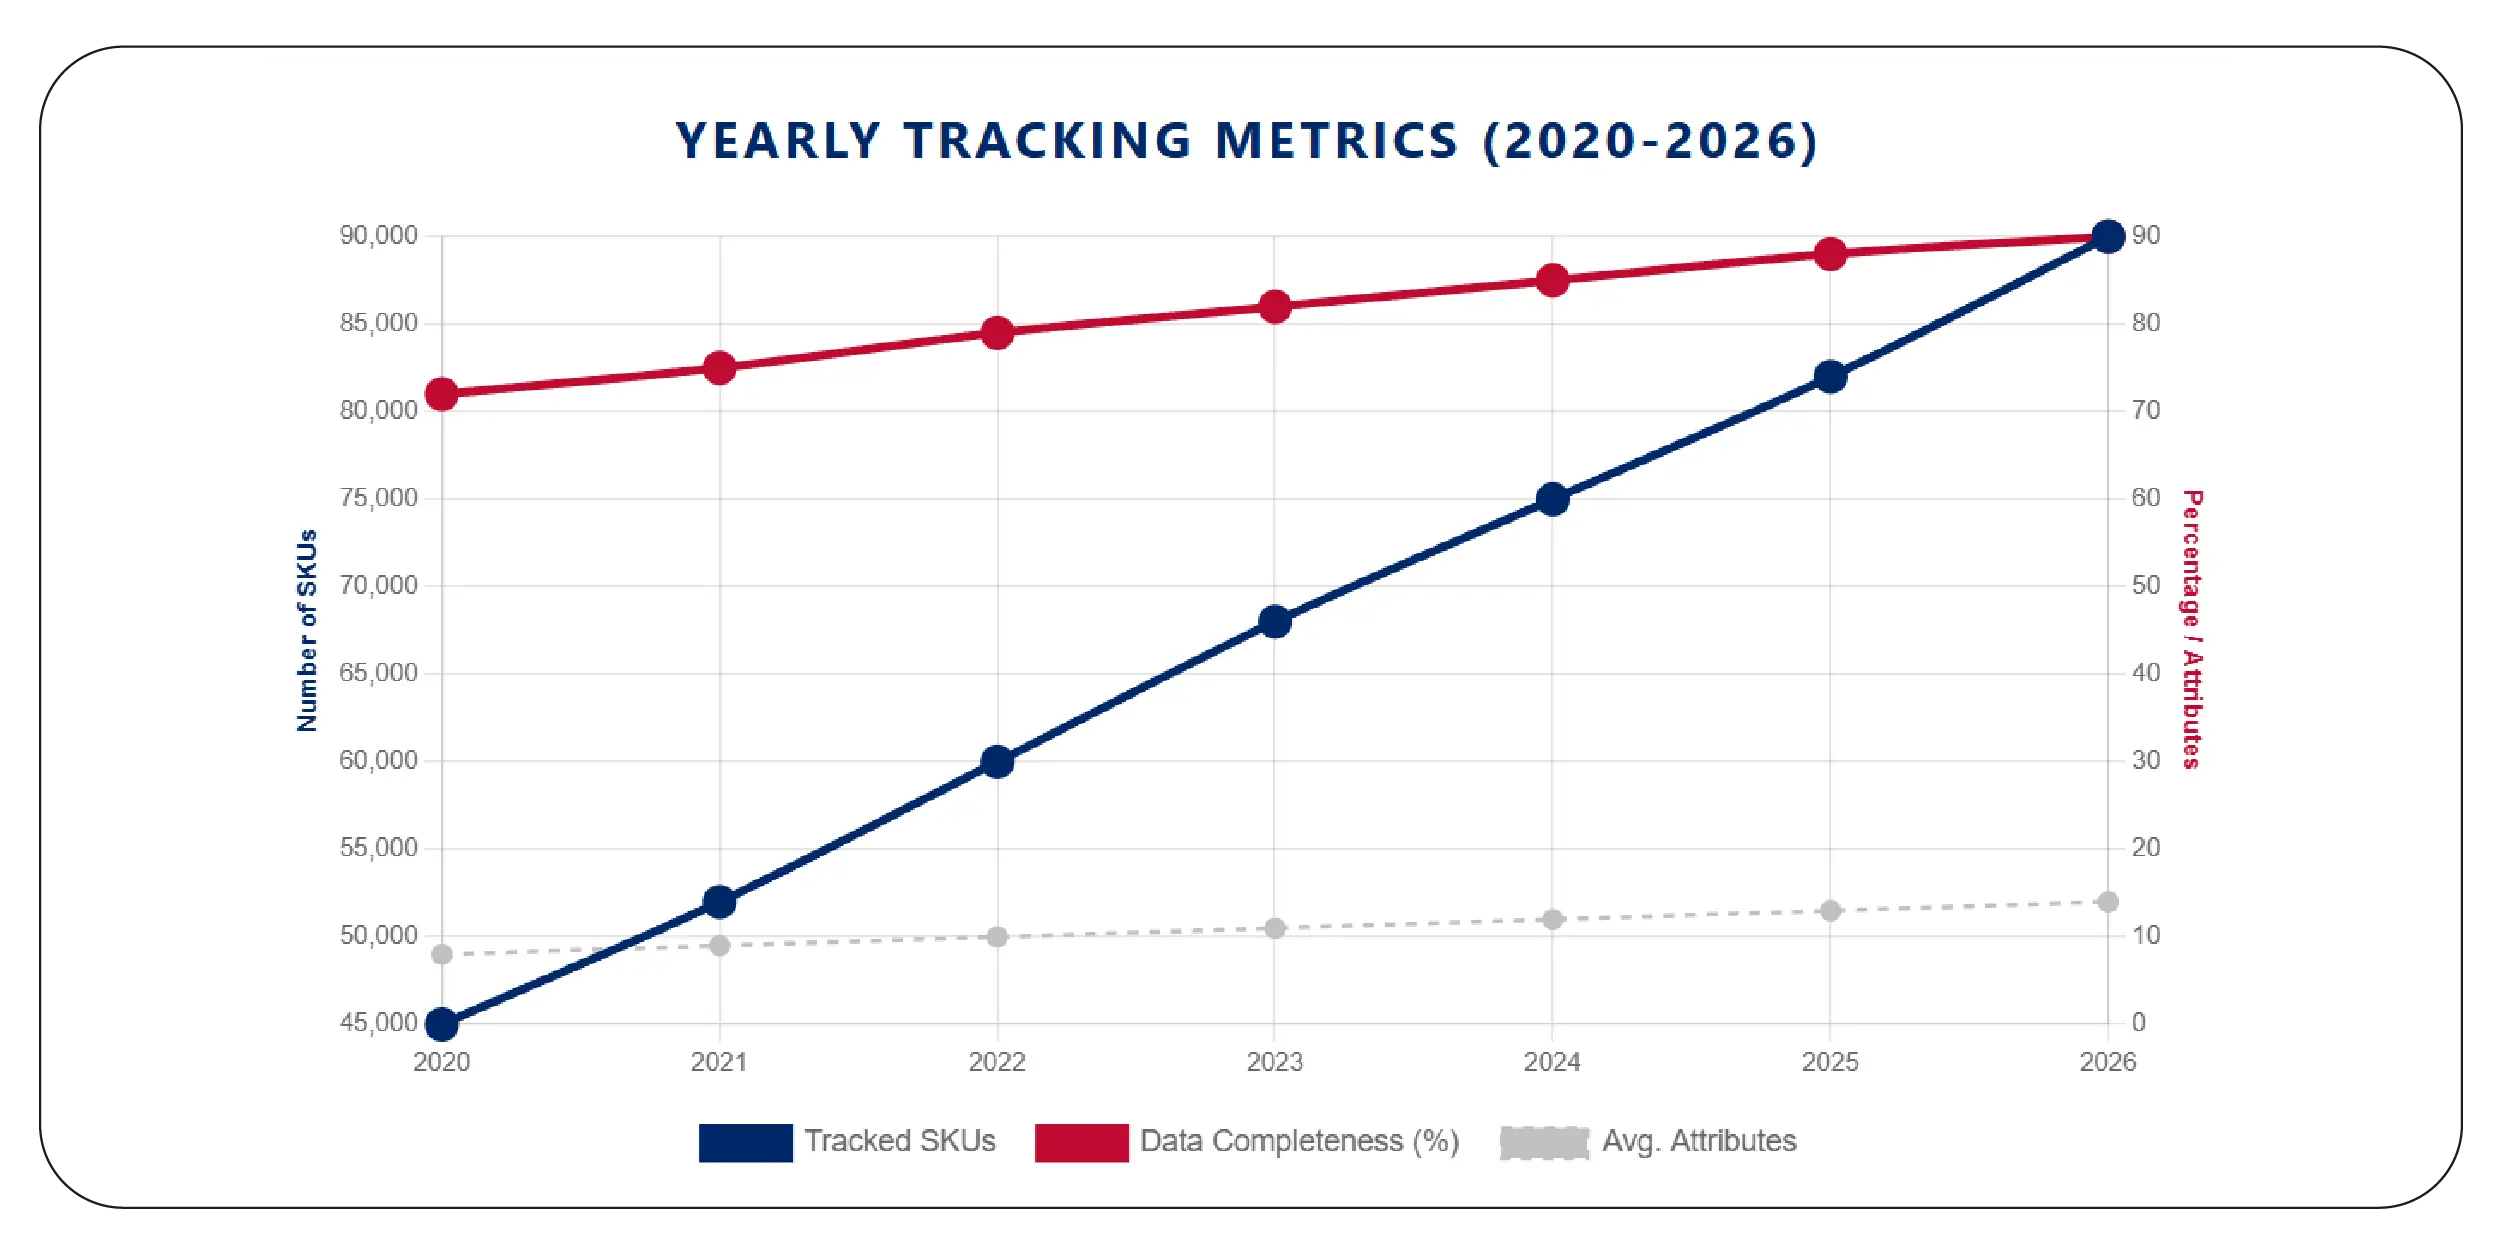
Accurate forecasting starts with access to complete and structured product information. Grocery chains increasingly rely on a unified Grocery store dataset combined with the ability to Extract Grocery & Gourmet Food Data across categories such as packaged foods, fresh produce, dairy, and private labels. Scraped datasets between 2020 and 2026 show consistent expansion in tracked SKUs and product attributes.
| Year |
Tracked SKUs |
Avg. Attributes per SKU |
Data Completeness |
| 2020 |
45,000 |
8 |
72% |
| 2021 |
52,000 |
9 |
75% |
| 2022 |
60,000 |
10 |
79% |
| 2023 |
68,000 |
11 |
82% |
| 2024 |
75,000 |
12 |
85% |
| 2025 |
82,000 |
13 |
88% |
| 2026 |
90,000 |
14 |
90% |
Richer datasets allow retailers to analyze price-per-unit, brand mix, and private-label expansion, forming the foundation for reliable demand prediction models.
Turning Historical Signals into Predictive Demand Models
One of the most powerful applications of scraping APIs is grocery demand forecasting using scraped data. By analyzing multi-year price movements, availability patterns, and promotion frequency, grocery chains can forecast demand spikes for key categories. From 2020 to 2026, scraped data has significantly improved category-level forecasting precision.
| Year |
Demand Forecast Accuracy |
Stockout Reduction |
Excess Inventory Reduction |
| 2020 |
65% |
– |
– |
| 2021 |
69% |
6% |
4% |
| 2022 |
73% |
10% |
7% |
| 2023 |
77% |
14% |
10% |
| 2024 |
81% |
18% |
13% |
| 2025 |
84% |
21% |
16% |
| 2026 |
87% |
25% |
18% |
These insights enable grocery chains to proactively adjust procurement and pricing strategies before consumer behavior shifts.
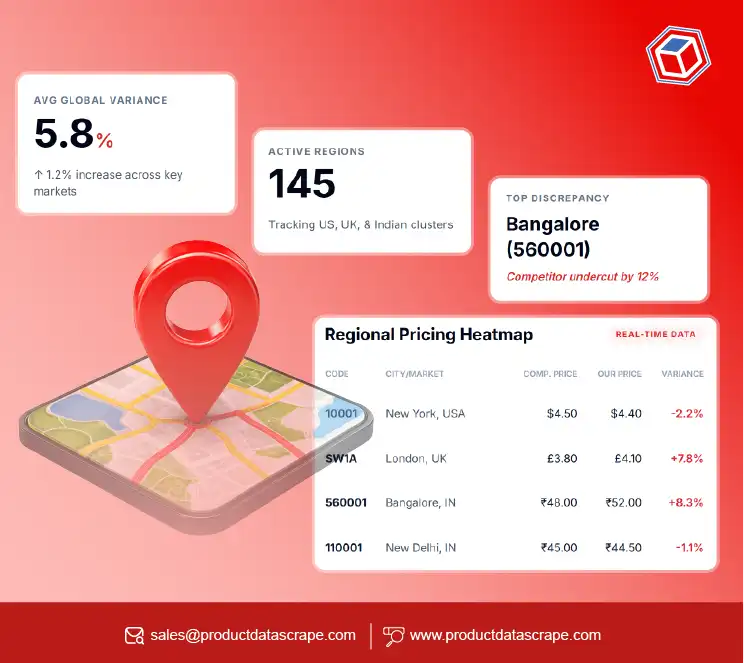
Regionalizing Strategy with Location-Level Intelligence
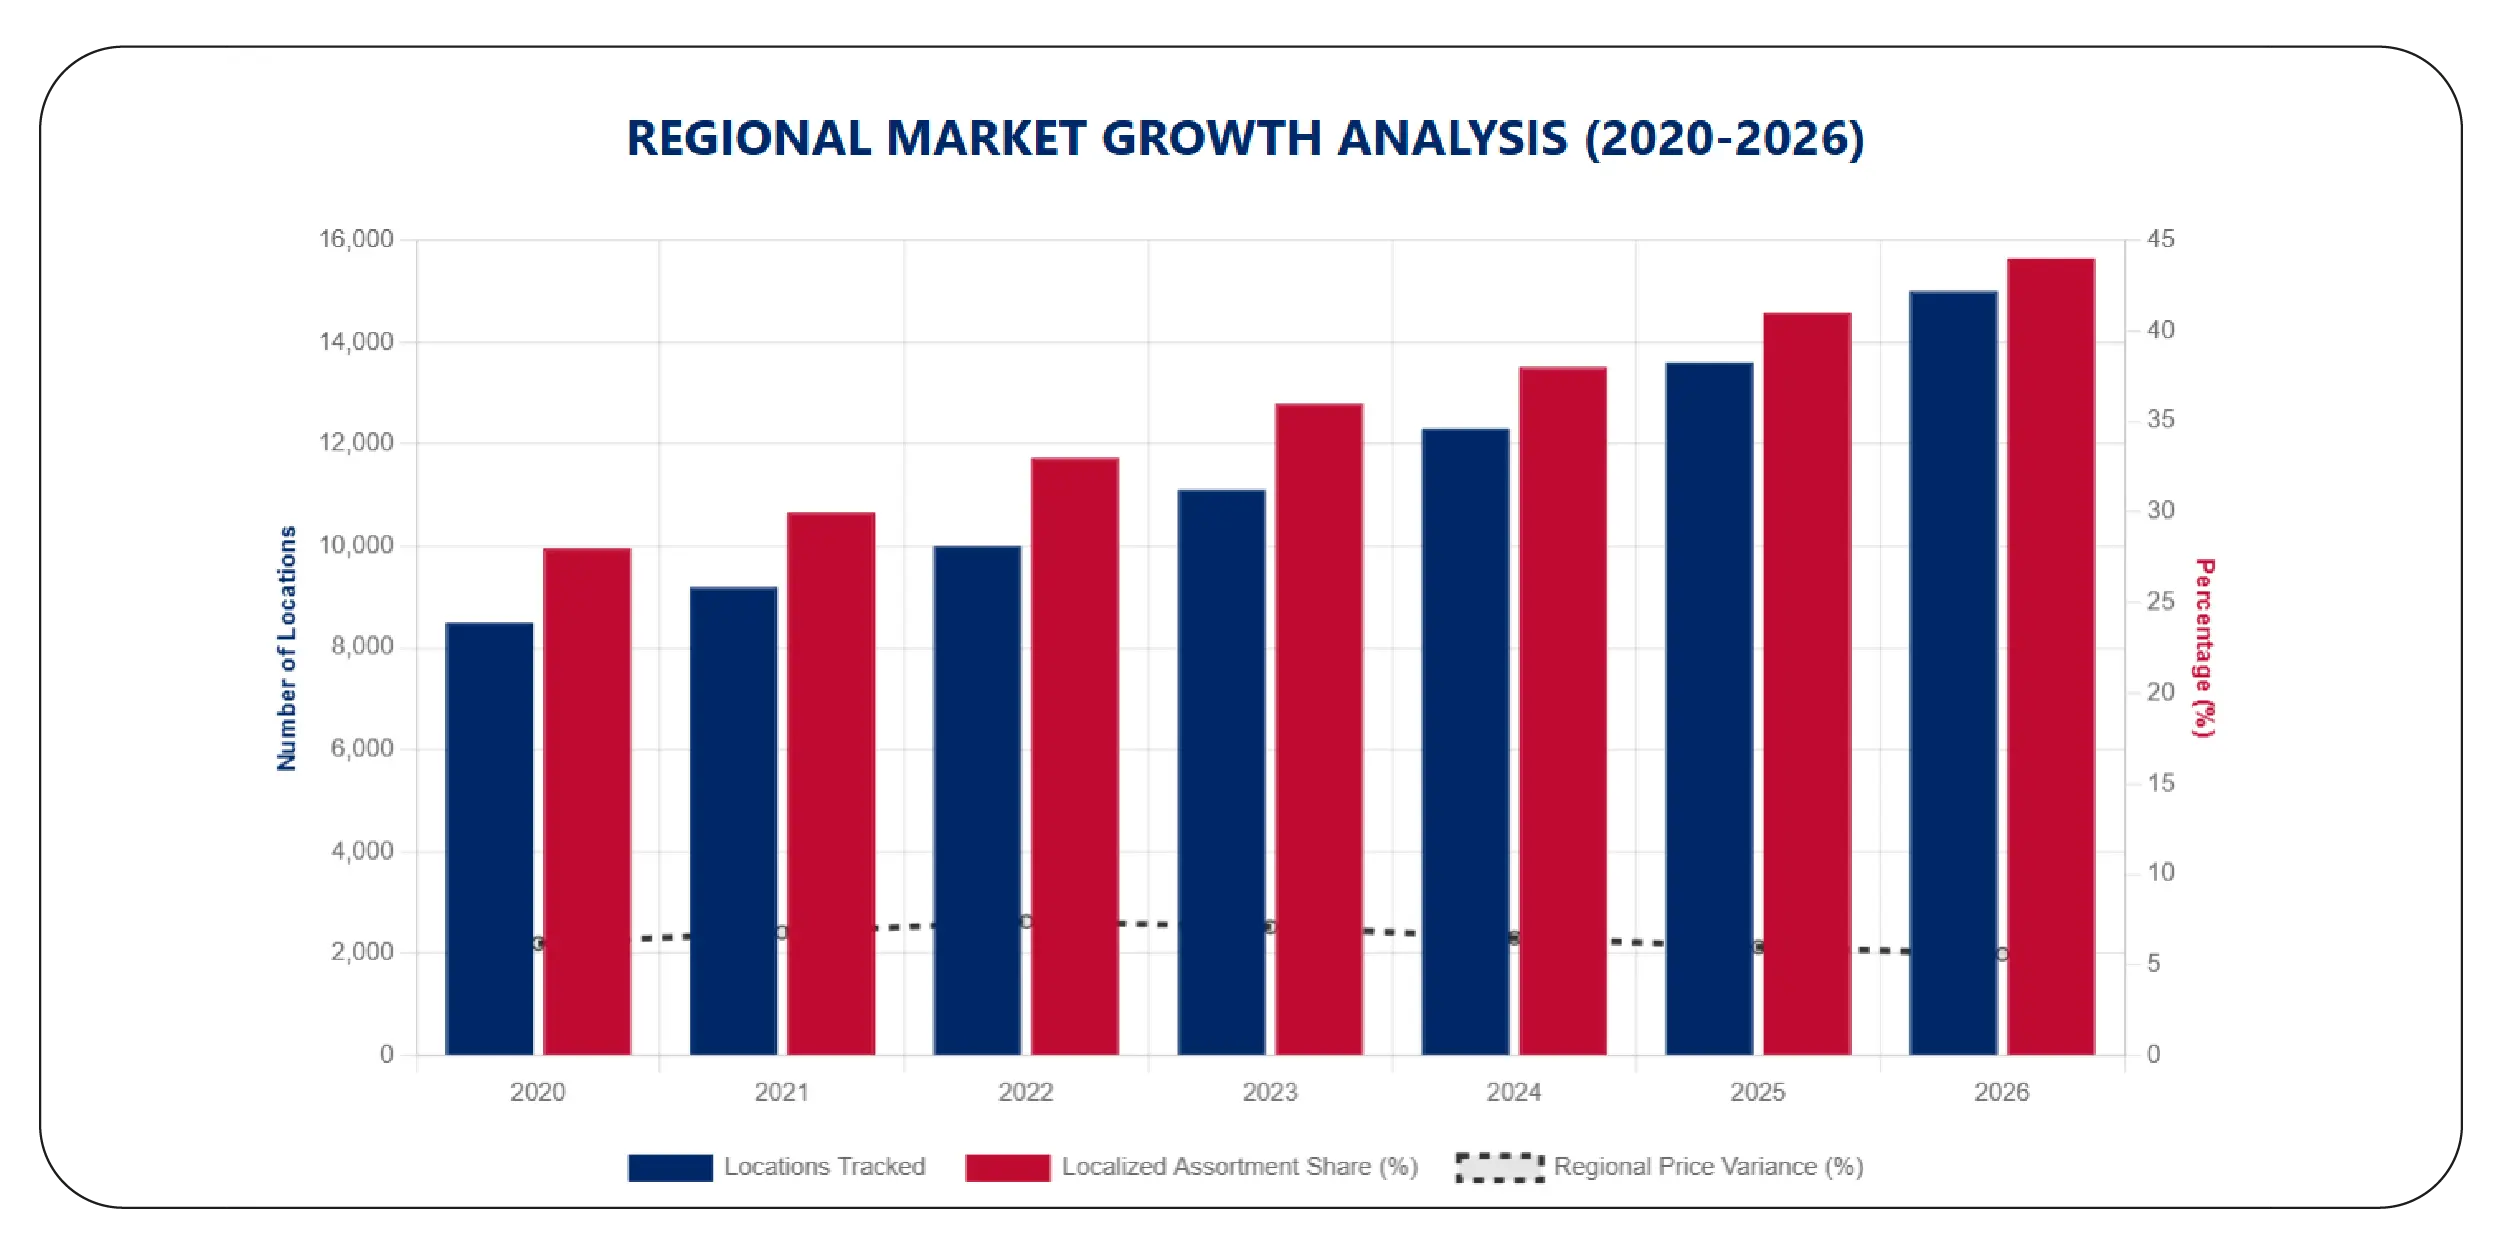
Shopping trends vary significantly by geography, income levels, and urban density. Through Grocery Store Location Data Scraping in USA, retailers capture store-level availability, local pricing differences, and regional assortment strategies. Location-based datasets from 2020 to 2026 show growing reliance on hyperlocal intelligence.
| Year |
Locations Tracked |
Regional Price Variance |
Localized Assortment Share |
| 2020 |
8,500 |
6.2% |
28% |
| 2021 |
9,200 |
6.8% |
30% |
| 2022 |
10,000 |
7.4% |
33% |
| 2023 |
11,100 |
7.1% |
36% |
| 2024 |
12,300 |
6.5% |
38% |
| 2025 |
13,600 |
6.0% |
41% |
| 2026 |
15,000 |
5.6% |
44% |
This data helps retailers tailor pricing and promotions to local demand patterns, improving store-level performance.
Competitive Benchmarking Through Discounters
Hard discounters play a critical role in shaping grocery price perception. Monitoring competitors like Aldi provides early signals of category-level pricing shifts. Using Aldi USA Retail Data Collection Service, grocery chains benchmark pricing strategies and private-label growth.
| Year |
Avg. Aldi Price Index |
Private Label Share |
Competitive Price Gap |
| 2020 |
92 |
38% |
8% |
| 2021 |
91 |
40% |
9% |
| 2022 |
89 |
43% |
11% |
| 2023 |
90 |
45% |
10% |
| 2024 |
91 |
47% |
9% |
| 2025 |
92 |
49% |
8% |
| 2026 |
93 |
52% |
7% |
These benchmarks inform promotional timing and private-label investment strategies across traditional grocery chains.
Creating a Unified Intelligence Layer for Strategy
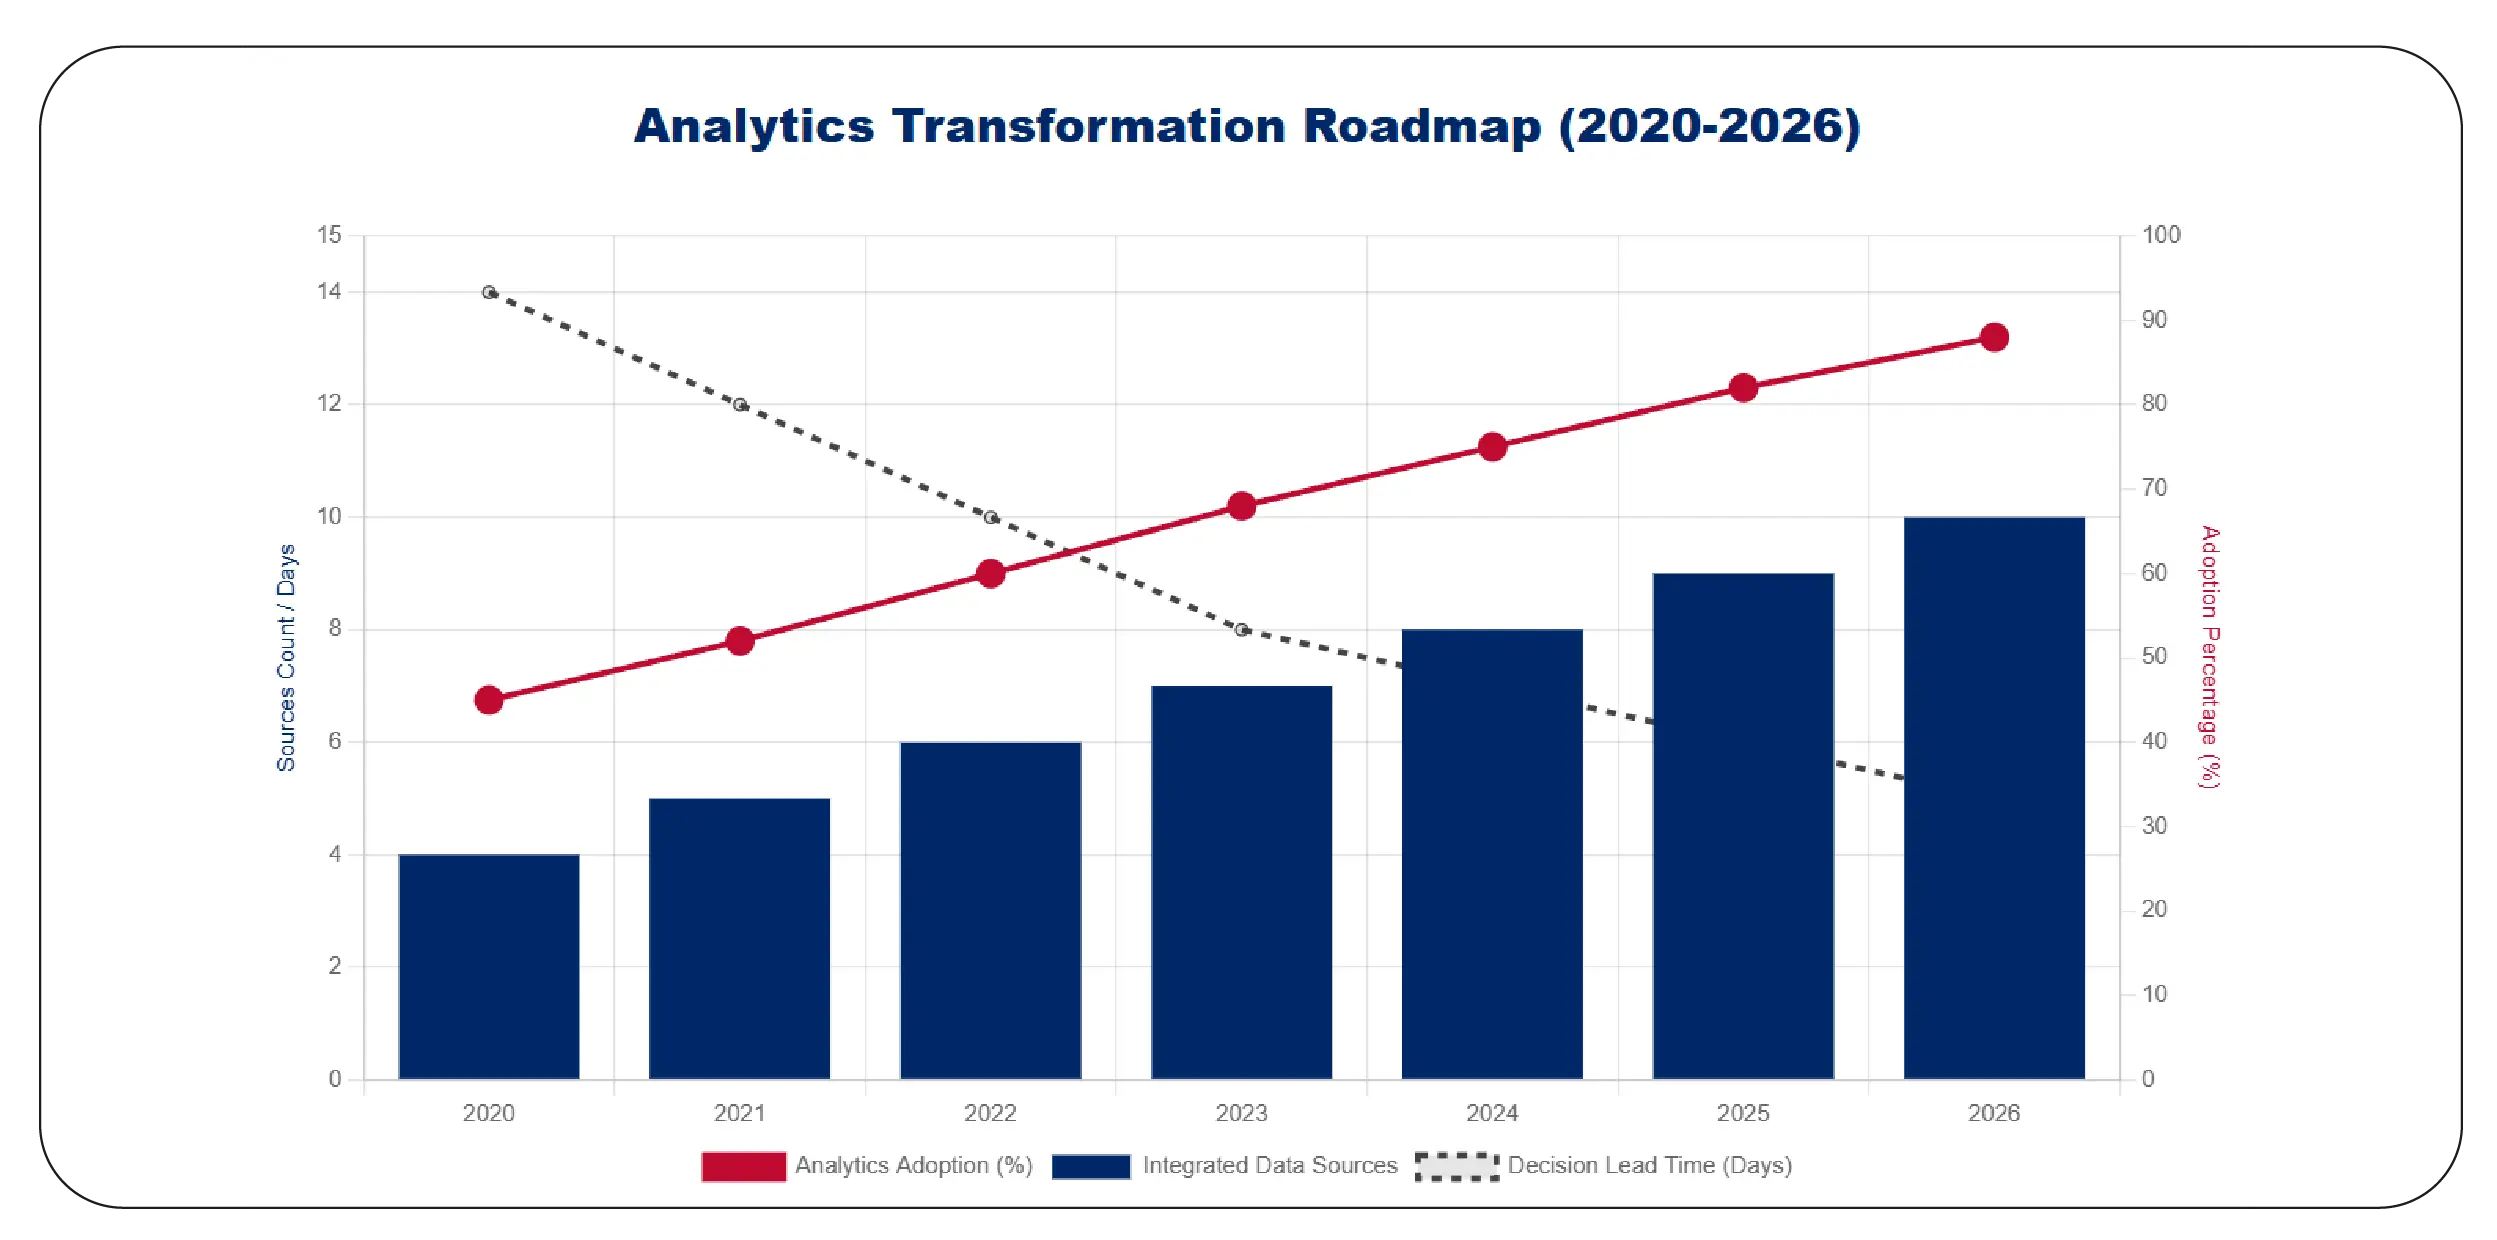
To scale analytics across functions, retailers consolidate scraped insights into a centralized us grocery market intelligence dataset. This unified layer integrates pricing, inventory, location, and promotional data to support forecasting for 2026 and beyond.
| Year |
Integrated Data Sources |
Analytics Adoption |
Decision Lead Time |
| 2020 |
4 |
45% |
14 days |
| 2021 |
5 |
52% |
12 days |
| 2022 |
6 |
60% |
10 days |
| 2023 |
7 |
68% |
8 days |
| 2024 |
8 |
75% |
7 days |
| 2025 |
9 |
82% |
6 days |
| 2026 |
10 |
88% |
5 days |
This consolidation enables faster, more confident decisions across pricing, inventory, and promotions.
Why Choose Product Data Scrape?
Retailers preparing for 2026 need partners that deliver accuracy, scale, and speed. Product Data Scrape supports advanced forecasting and planning by helping retailers Predict Holiday Demand Across U.S. Retail Chains using reliable, real-time scraped data. The platform enables automated collection, structured delivery, and seamless integration with analytics systems, reducing manual effort while improving forecast precision. With historical depth and real-time monitoring, grocery chains can anticipate demand surges, optimize promotions, and align inventory well ahead of peak seasons.
Conclusion
As grocery competition intensifies, predictive intelligence is becoming a strategic necessity rather than an advantage. Data scraping APIs allow retailers to move beyond historical reporting toward forward-looking insights. By leveraging structured datasets and advanced analytics, grocery chains can predict grocery shopping trends using data with higher confidence and agility.
Partner with Product Data Scrape to turn real-time grocery data into accurate demand forecasts and smarter retail strategies for 2026 and beyond.
FAQs
1. How does web scraping help grocery chains predict trends?
Web scraping captures real-time pricing, promotions, and availability data, enabling retailers to analyze patterns and forecast demand changes before they appear in sales reports.
2. What type of data is most valuable for grocery forecasting?
Product-level pricing, inventory status, promotions, and location-based data provide the strongest signals for predicting future grocery demand.
3. Can scraped data support regional grocery strategies?
Yes, location-level data enables retailers to customize pricing, assortments, and promotions based on local consumer behavior.
4. How far back should historical data be analyzed?
Most retailers benefit from at least three to five years of historical data to identify seasonal patterns and long-term trends.
5. Why use Product Data Scrape for grocery intelligence?
Product Data Scrape delivers scalable, compliant, and analytics-ready grocery datasets that support accurate forecasting and faster decision-making.


.webp)


