Introduction
Retailers, manufacturers, and consumer brands increasingly rely on data-driven intelligence to navigate evolving pricing strategies, changing customer demand, and competitive assortment planning. Costco has emerged as one of the world's leading warehouse retailers, offering a curated product selection, competitive pricing, and a strong private-label portfolio that consistently attracts loyal members. Understanding its pricing movements and assortment strategies enables businesses to optimize product placement, improve promotional planning, and strengthen competitive positioning.
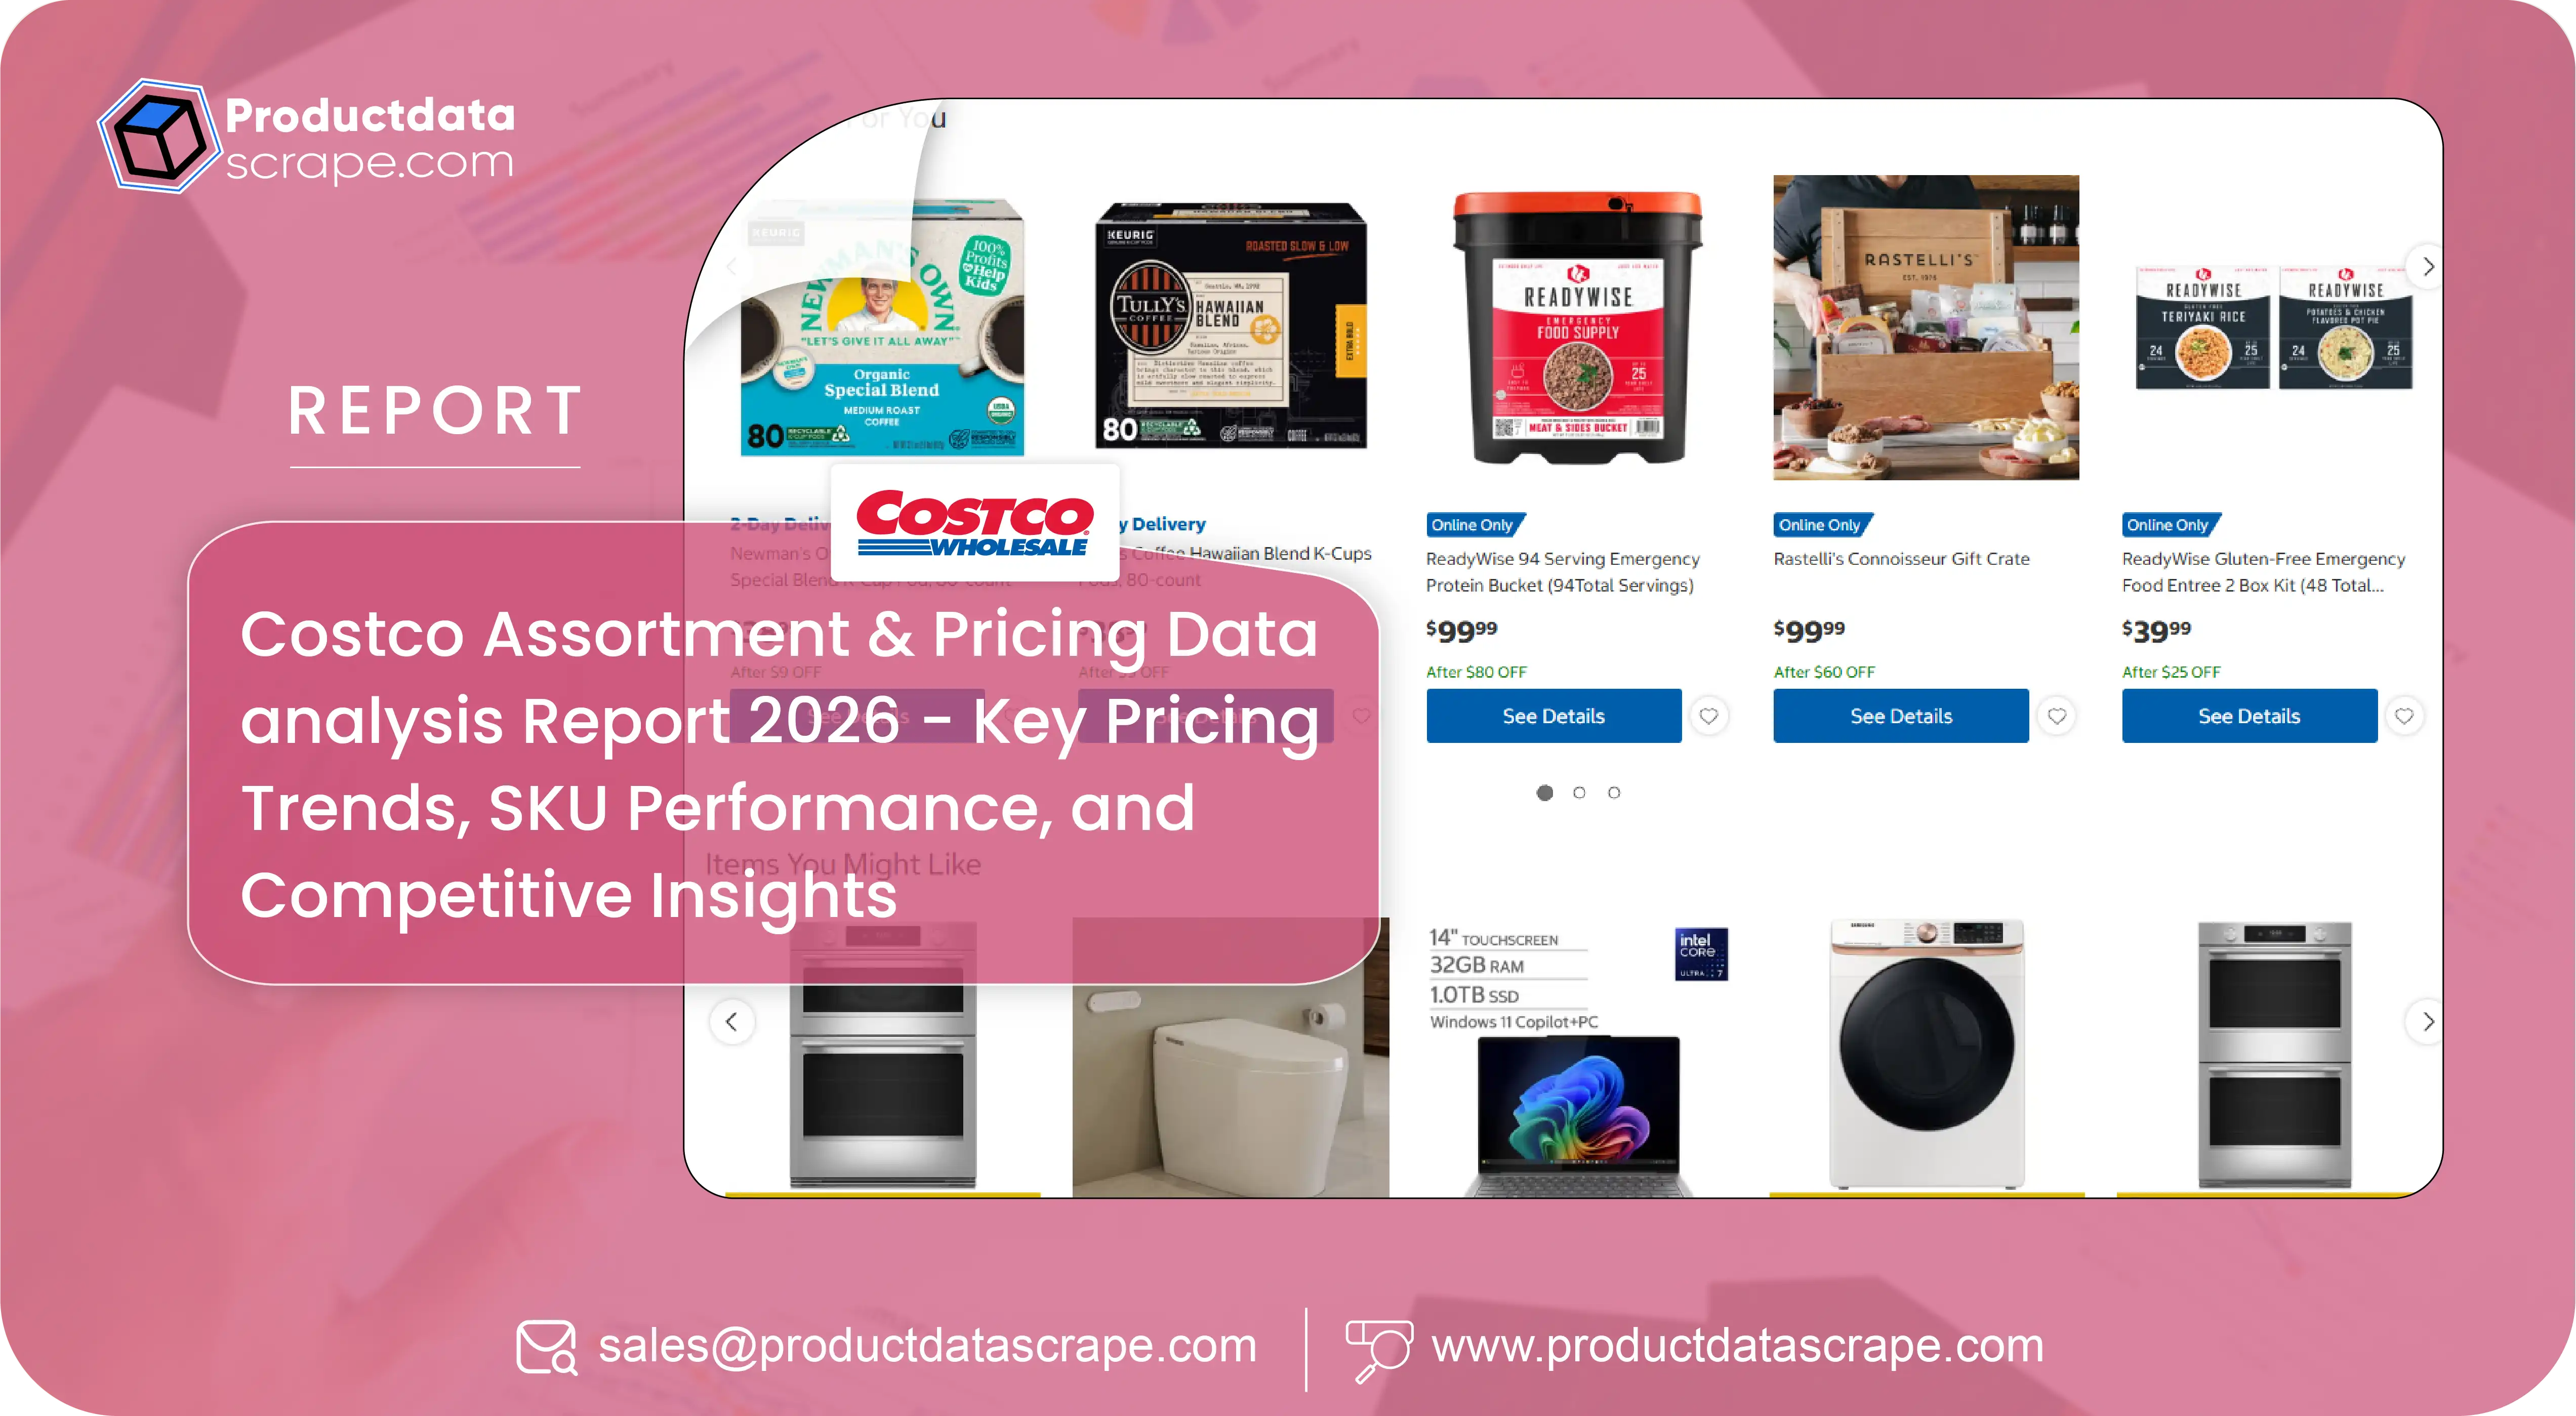
The Costco Assortment & Pricing Data analysis Report 2026 provides comprehensive insights into SKU availability, assortment changes, category expansion, promotional pricing, regional product variations, and inventory trends across Costco's retail ecosystem. Businesses looking to Extract Costco Data US can gain valuable intelligence on product lifecycle management, category performance, and pricing fluctuations that directly influence market competitiveness. This report examines historical pricing trends, assortment evolution, and SKU-level performance from 2020 through 2026, helping organizations make smarter merchandising, pricing, and supply chain decisions through reliable retail data intelligence.
Understanding Assortment Evolution Through Data Intelligence
Costco continues to differentiate itself through a highly selective assortment strategy that prioritizes value, operational efficiency, and strong supplier partnerships. Unlike traditional supermarkets offering tens of thousands of SKUs, Costco maintains a focused catalog that encourages higher inventory turnover while reducing operational complexity. Continuous monitoring of assortment and pricing helps brands understand product rotation, seasonal introductions, discontinued SKUs, and pricing adjustments across multiple categories.
Businesses leveraging Costco Assortment & Price Monitoring together with Product Price scraping can identify category expansion opportunities, evaluate promotional effectiveness, monitor competitor pricing, and improve forecasting accuracy. Historical analysis shows Costco has steadily increased its premium offerings while maintaining aggressive pricing on high-demand essentials, making ongoing assortment intelligence increasingly valuable.
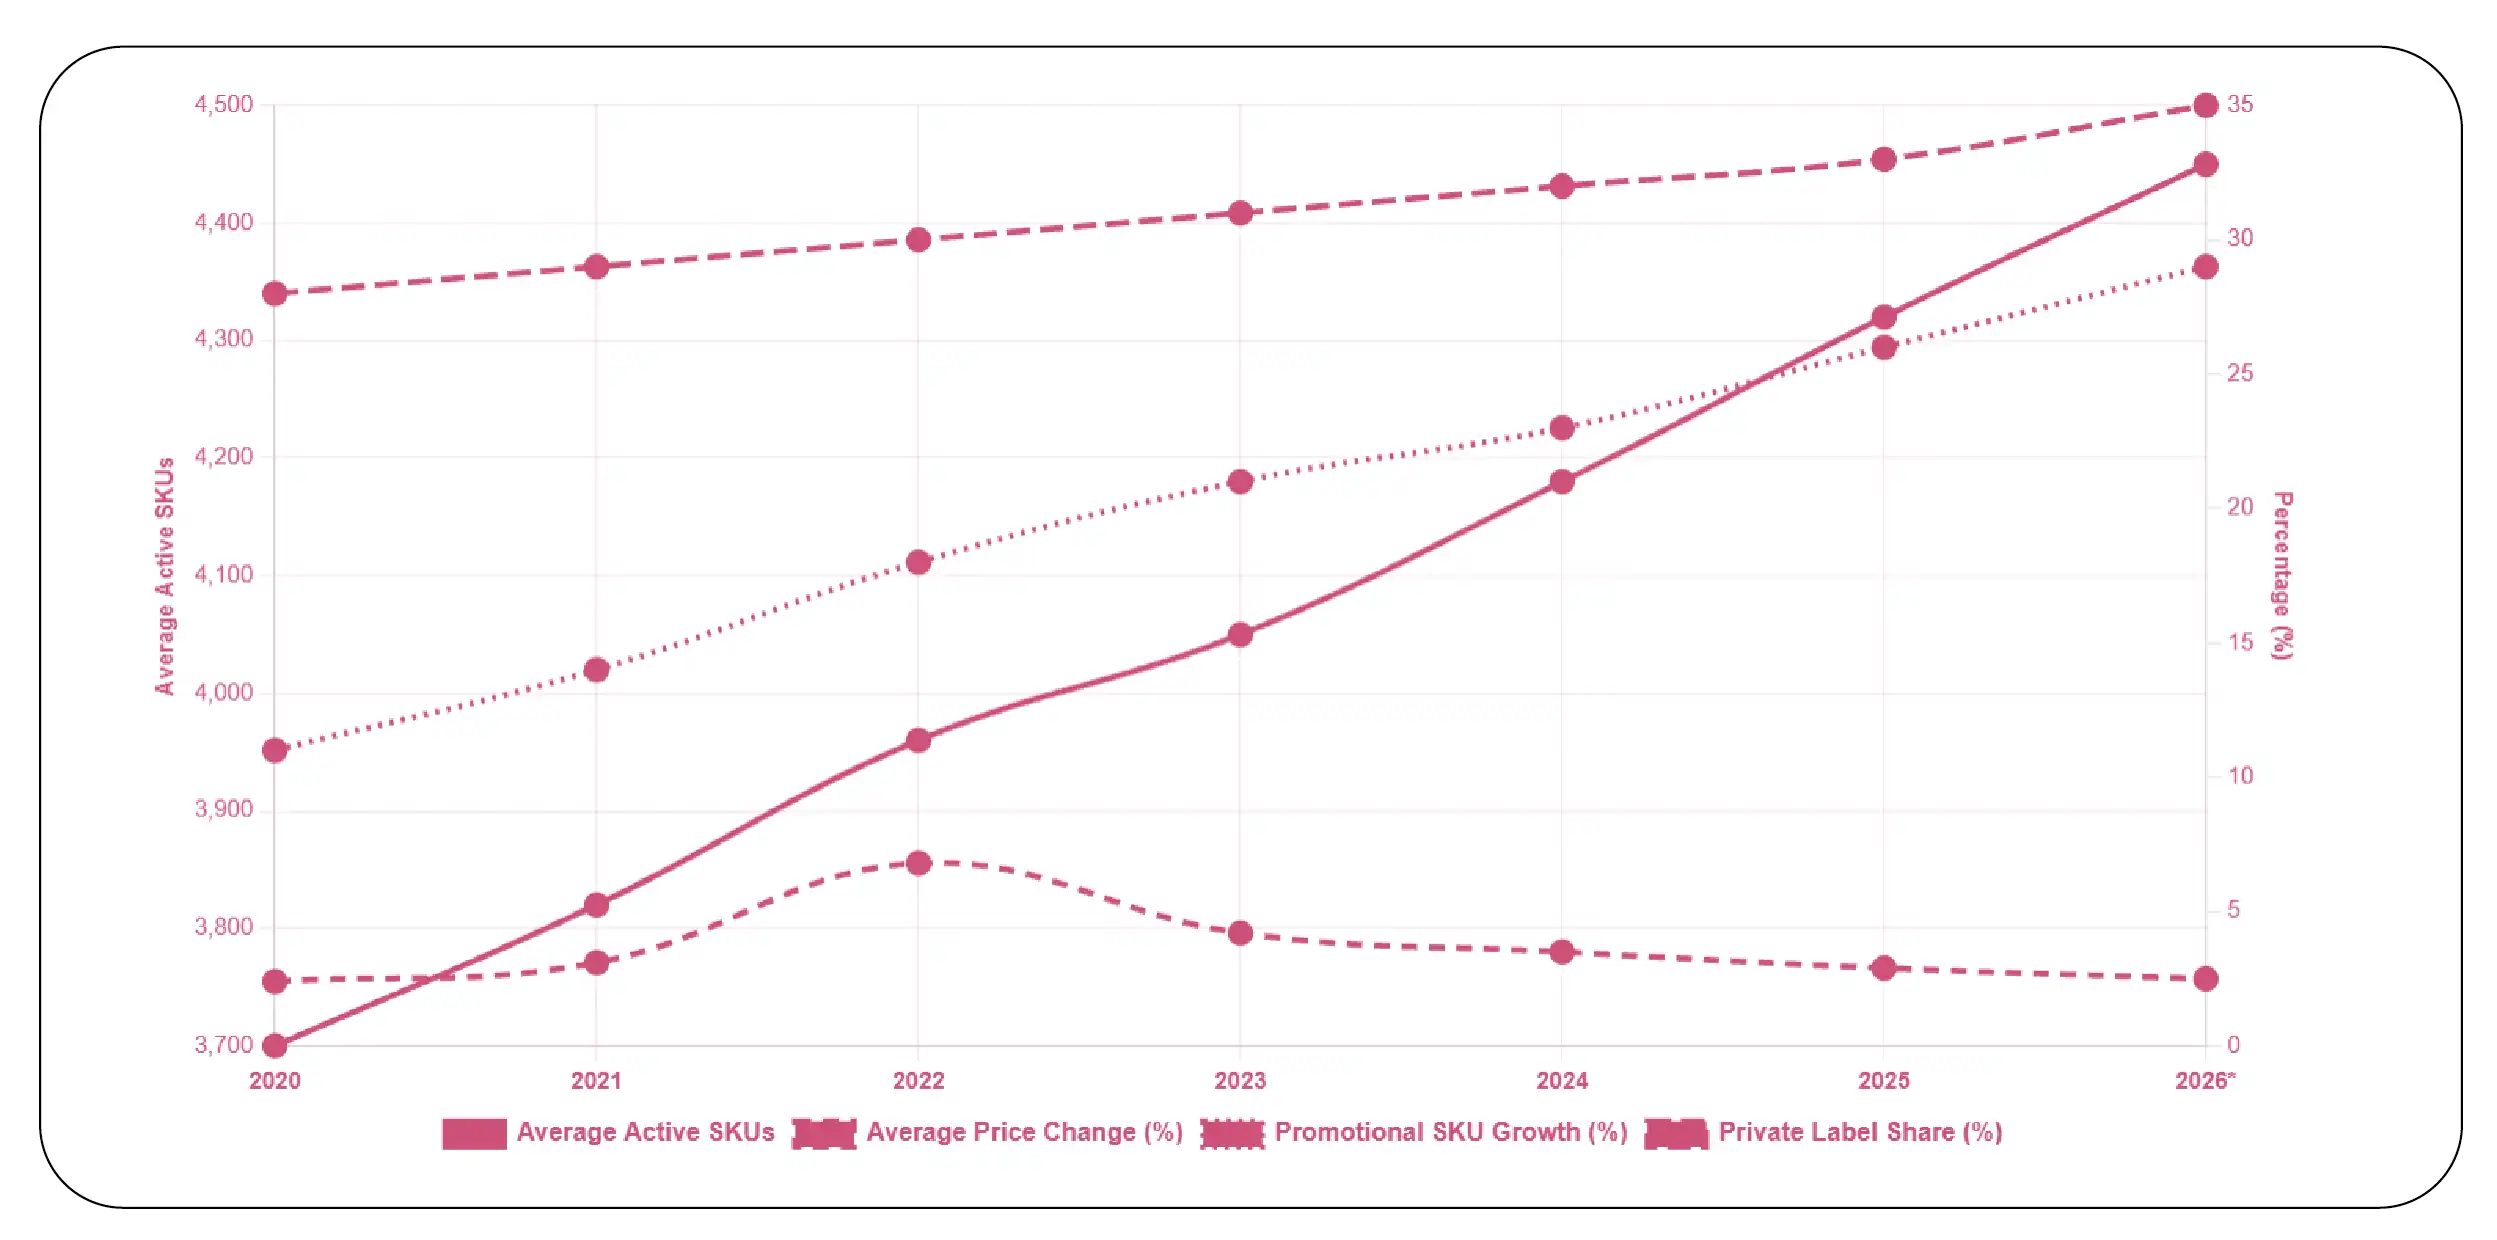
Costco Assortment & Pricing Trends (2020–2026)
| Year |
Average Active SKUs |
Average Price Change (%) |
Promotional SKU Growth (%) |
Private Label Share (%) |
| 2020 |
3,700 |
2.4 |
11 |
28 |
| 2021 |
3,820 |
3.1 |
14 |
29 |
| 2022 |
3,960 |
6.8 |
18 |
30 |
| 2023 |
4,050 |
4.2 |
21 |
31 |
| 2024 |
4,180 |
3.5 |
23 |
32 |
| 2025 |
4,320 |
2.9 |
26 |
33 |
| 2026* |
4,450 |
2.5 |
29 |
35 |
*Estimated market trends based on industry analysis.
Key Insights
- Costco's curated assortment has expanded by nearly 20% since 2020.
- Premium and organic categories continue gaining shelf space.
- Private-label penetration steadily increases each year.
- Promotional activity has become more targeted across seasonal categories.
- Price optimization balances value perception with inflationary pressures.
- Limited assortment continues driving higher inventory efficiency.
- Brands can identify product gaps through continuous assortment monitoring.
- Regional assortment differences are becoming more prominent.
- Data-driven pricing supports stronger competitive positioning.
- Retail intelligence improves demand forecasting and merchandising decisions.
Measuring Product Performance Across Categories
Monitoring individual product performance has become essential for brands seeking to optimize pricing, inventory planning, and assortment decisions. Costco's disciplined merchandising model emphasizes high-volume SKUs, creating significant opportunities for manufacturers that consistently deliver strong sales performance. Product-level visibility enables organizations to understand which categories experience sustained growth, how pricing impacts demand, and where promotional strategies generate the greatest returns.
Organizations using Costco Product Data Scraping alongside the Costco Assortment & Pricing Data analysis Report 2026 can analyze SKU movement across grocery, electronics, household essentials, health products, apparel, and seasonal merchandise. This intelligence supports category benchmarking, competitive pricing strategies, and inventory optimization while helping businesses identify emerging trends before competitors respond.
Category Performance Indicators (2020–2026)
| Year |
Grocery SKU Growth |
Electronics SKU Growth |
Seasonal Product Growth |
Average Discount Events |
| 2020 |
4% |
3% |
5% |
58 |
| 2021 |
5% |
4% |
7% |
66 |
| 2022 |
7% |
6% |
9% |
74 |
| 2023 |
8% |
7% |
10% |
82 |
| 2024 |
9% |
8% |
12% |
91 |
| 2025 |
10% |
9% |
13% |
98 |
| 2026* |
11% |
10% |
15% |
108 |
*Estimated market trends based on industry analysis.
Key Insights
- Grocery remains Costco's strongest-performing category.
- Electronics experience consistent year-over-year assortment expansion.
- Seasonal products generate significant promotional traffic.
- Discount events have increased substantially since 2020.
- SKU performance analysis supports better inventory planning.
- High-performing products remain available longer across warehouse locations.
- Data-driven assortment decisions improve category profitability.
- Manufacturers benefit from continuous monitoring of SKU performance.
- Competitive benchmarking identifies pricing opportunities across categories.
- Historical product intelligence enables more accurate demand forecasting.
Strengthening Competitive Visibility Through Digital Commerce Intelligence
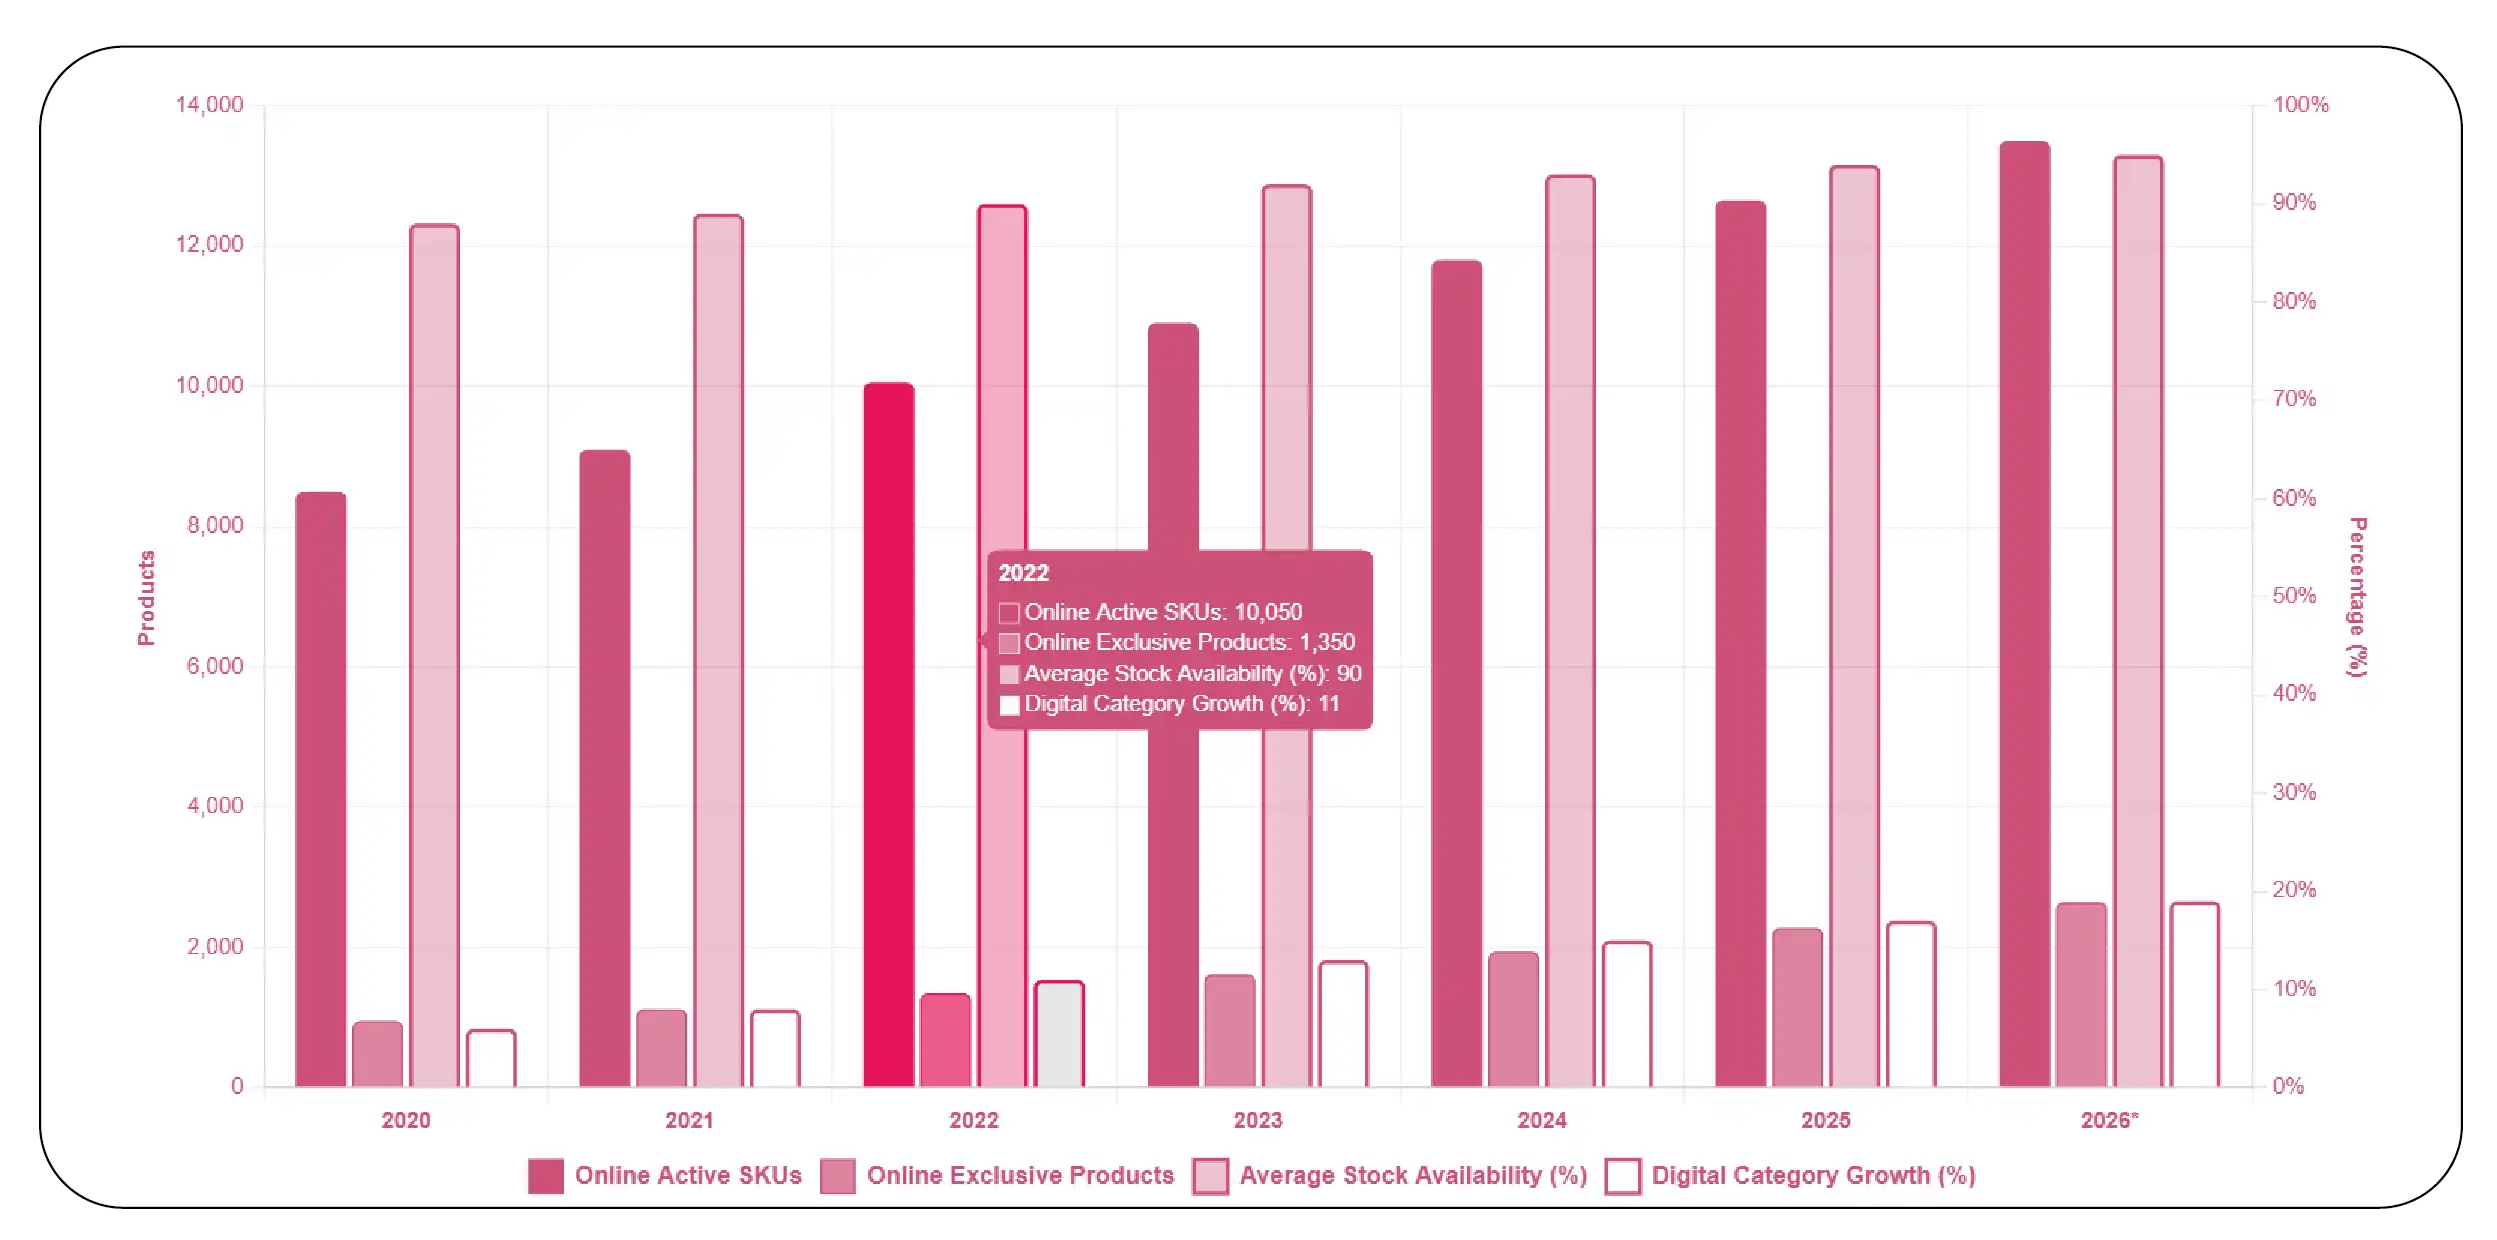
As omnichannel retail expands, brands require continuous visibility into online assortment changes, product availability, and pricing dynamics. Costco's digital ecosystem increasingly complements its warehouse operations by introducing exclusive online products, limited-time bundles, and region-specific inventory. Monitoring these changes helps manufacturers, distributors, and retailers understand consumer preferences while identifying assortment gaps before they impact sales performance.
Organizations implementing Costco product assortment monitoring together with E-commerce data scraping gain comprehensive intelligence into SKU introductions, discontinued products, stock availability, pricing consistency, customer demand patterns, and category expansion. Comparing historical assortment data from 2020–2026 reveals that Costco has steadily expanded online-exclusive offerings while improving digital merchandising strategies to support evolving customer expectations. These insights enable businesses to optimize product portfolios, improve replenishment planning, and benchmark digital shelf performance against competitors.
Digital Assortment Performance (2020–2026)
| Year |
Online Active SKUs |
Online Exclusive Products |
Average Stock Availability |
Digital Category Growth |
| 2020 |
8,500 |
950 |
88% |
6% |
| 2021 |
9,100 |
1,120 |
89% |
8% |
| 2022 |
10,050 |
1,350 |
90% |
11% |
| 2023 |
10,900 |
1,620 |
92% |
13% |
| 2024 |
11,800 |
1,940 |
93% |
15% |
| 2025 |
12,650 |
2,280 |
94% |
17% |
| 2026* |
13,500 |
2,650 |
95% |
19% |
*Estimated market trends based on industry analysis.
Key Insights
- Online-exclusive products continue expanding each year.
- Digital assortment has grown by nearly 60% since 2020.
- Inventory availability has steadily improved.
- Seasonal products receive stronger online merchandising support.
- Category expansion reflects changing consumer shopping behavior.
- Product discontinuation patterns help predict assortment shifts.
- Digital shelf monitoring supports proactive inventory planning.
- Regional online assortment differences continue increasing.
- E-commerce intelligence enhances promotional planning.
- Continuous monitoring strengthens competitive retail analysis.
Benchmarking Retail Performance for Smarter Decisions
Retail benchmarking has become an essential practice for brands seeking to understand how pricing strategies compare across warehouse clubs, supermarkets, and e-commerce marketplaces. Costco's reputation for maintaining consistent value pricing while limiting SKU complexity makes it an ideal benchmark for evaluating assortment efficiency and promotional effectiveness. Historical pricing comparisons reveal how Costco balances inflation, supplier negotiations, and consumer expectations without sacrificing customer loyalty.
Businesses utilizing Costco Assortment and Pricing Benchmarking can compare category pricing, private-label positioning, promotional frequency, and assortment depth against competing retailers. Benchmarking data between 2020 and 2026 indicates that Costco has maintained relatively stable pricing despite broader market volatility, enabling brands to identify opportunities for competitive differentiation and margin optimization.
Competitive Benchmark Indicators (2020–2026)
| Year |
Average Price Index* |
Promotional Frequency |
Private Label Growth |
Category Coverage |
| 2020 |
96 |
18% |
28% |
92% |
| 2021 |
97 |
20% |
29% |
93% |
| 2022 |
101 |
22% |
30% |
94% |
| 2023 |
99 |
24% |
31% |
95% |
| 2024 |
98 |
26% |
32% |
96% |
| 2025 |
97 |
28% |
33% |
97% |
| 2026* |
96 |
30% |
35% |
98% |
*Price Index (100 = Market Average)
Key Insights
- Costco consistently maintains prices below the broader retail average.
- Promotional campaigns have become increasingly targeted.
- Private-label expansion strengthens long-term competitiveness.
- Category coverage continues improving across high-demand segments.
- Benchmarking identifies pricing gaps across competing retailers.
- Historical comparisons improve strategic pricing decisions.
- Brands can evaluate assortment efficiency through category-level analysis.
- Promotional benchmarking supports campaign optimization.
- Retail intelligence enables stronger supplier negotiations.
- Data-backed benchmarking improves long-term profitability.
Unlocking SKU-Level Intelligence for Better Inventory Planning
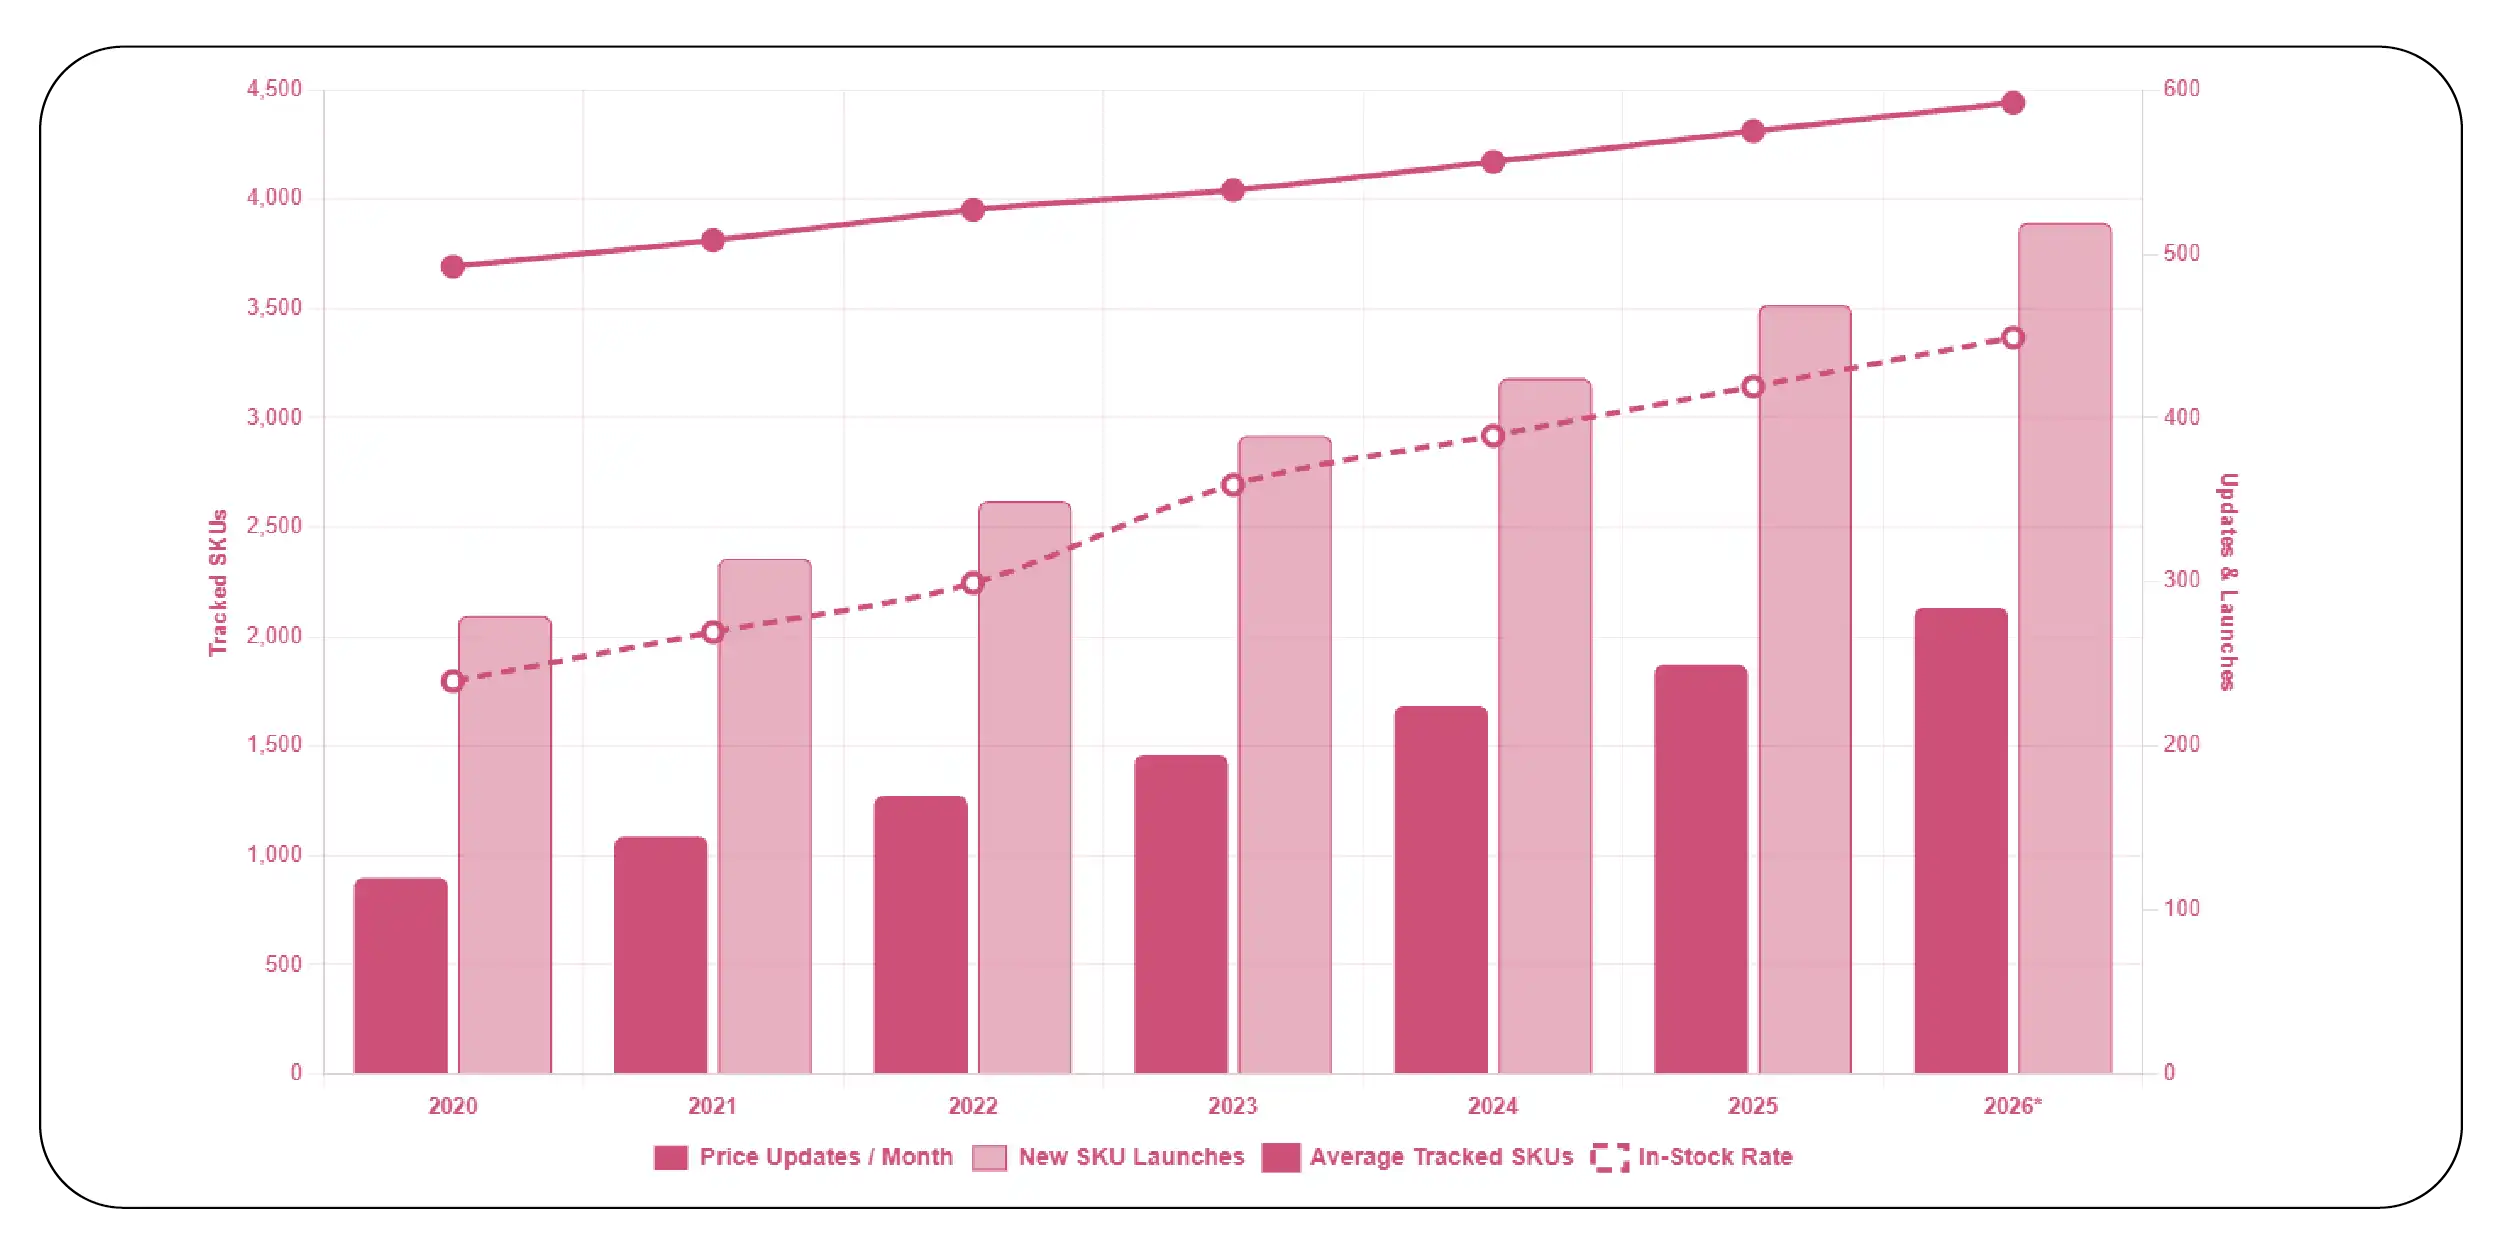
Granular SKU-level visibility has become critical for brands seeking to optimize inventory, pricing, and assortment decisions. Individual product tracking provides detailed insights into price movements, stock availability, assortment changes, promotional cycles, and category performance. Instead of relying solely on category-level analysis, businesses increasingly monitor SKU behavior to understand which products consistently drive revenue and customer engagement.
Using Costco SKU-level pricing data alongside Assortment and availability monitoring enables organizations to detect pricing fluctuations, regional inventory differences, stock replenishment cycles, and seasonal assortment adjustments. Between 2020 and 2026, SKU-level analysis shows increasing product availability, faster replenishment, and improved inventory efficiency across multiple merchandise categories. These insights empower brands to refine forecasting models, optimize procurement strategies, and enhance overall supply chain resilience.
SKU Performance & Availability (2020–2026)
| Year |
Average Tracked SKUs |
In-Stock Rate |
Price Updates/Month |
New SKU Launches |
| 2020 |
3,700 |
88% |
120 |
280 |
| 2021 |
3,820 |
89% |
145 |
315 |
| 2022 |
3,960 |
90% |
170 |
350 |
| 2023 |
4,050 |
92% |
195 |
390 |
| 2024 |
4,180 |
93% |
225 |
425 |
| 2025 |
4,320 |
94% |
250 |
470 |
| 2026* |
4,450 |
95% |
285 |
520 |
*Estimated market trends based on industry analysis.
Key Insights
- SKU-level tracking provides greater pricing accuracy.
- Product availability has steadily improved across years.
- Monthly price updates continue increasing.
- Faster replenishment reduces out-of-stock risks.
- New product launches support category growth.
- Historical SKU analysis improves demand forecasting.
- Availability monitoring strengthens inventory optimization.
- Regional SKU comparisons reveal assortment opportunities.
- Data-driven procurement minimizes operational risks.
- Continuous SKU intelligence enhances retail competitiveness.
Turning Retail Data into Strategic Growth Opportunities
Modern retail success depends on more than simply tracking prices—it requires understanding how assortment decisions influence demand, customer loyalty, and profitability. Costco's curated merchandising strategy creates a unique opportunity for brands to analyze product mix, identify category gaps, evaluate promotional effectiveness, and forecast future demand using historical retail intelligence. Businesses that continuously monitor assortment changes can respond faster to market shifts and optimize product portfolios before competitors react.
Leveraging Costco product assortment data analytics enables organizations to evaluate category growth, SKU lifecycle trends, supplier performance, regional assortment variations, and consumer purchasing behavior. Historical analysis from 2020–2026 demonstrates consistent expansion in premium categories, increased private-label penetration, and improved inventory efficiency. These insights help manufacturers, distributors, retailers, and market researchers develop smarter pricing models, optimize promotional campaigns, and strengthen long-term merchandising strategies through actionable retail intelligence.
Retail Intelligence Performance (2020–2026)
| Year |
Categories Analyzed |
SKU Coverage |
Assortment Accuracy |
Pricing Accuracy |
| 2020 |
18 |
3,700 |
91% |
93% |
| 2021 |
20 |
3,820 |
92% |
94% |
| 2022 |
22 |
3,960 |
93% |
95% |
| 2023 |
24 |
4,050 |
94% |
96% |
| 2024 |
25 |
4,180 |
95% |
97% |
| 2025 |
27 |
4,320 |
96% |
98% |
| 2026* |
30 |
4,450 |
97% |
99% |
*Estimated market trends based on industry analysis.
Key Insights
- Product assortment intelligence supports strategic merchandising.
- Category expansion reflects evolving consumer demand.
- Higher pricing accuracy improves competitive decision-making.
- Historical analytics strengthen inventory planning.
- SKU coverage continues expanding across retail categories.
- Data-driven assortment optimization improves profitability.
- Promotional planning becomes more precise with retail intelligence.
- Supplier performance evaluation enhances procurement efficiency.
- Continuous monitoring minimizes market uncertainty.
- Advanced analytics support sustainable retail growth.
Why Choose Product Data Scrape?
Retail intelligence is only as valuable as the quality, accuracy, and timeliness of the underlying data. Product Data Scrape delivers enterprise-grade retail data solutions that help brands, retailers, manufacturers, and market researchers monitor product assortments, pricing trends, inventory availability, promotional campaigns, and competitive positioning across leading e-commerce and omnichannel platforms.
Our solutions provide automated data collection, real-time monitoring, historical trend analysis, and customizable dashboards that transform raw retail data into actionable business intelligence. Whether organizations need SKU-level insights, category benchmarking, promotional tracking, or competitor intelligence, our scalable data extraction capabilities support faster and more informed decision-making.
With deep expertise in retail analytics and Assortment analytics, we enable businesses to:
- Monitor real-time product assortment changes across retail channels.
- Track SKU-level pricing and promotional activities with high accuracy.
- Compare competitor pricing across multiple categories and regions.
- Identify emerging product trends and category opportunities.
- Analyze historical pricing patterns to improve forecasting.
- Detect inventory fluctuations and reduce stock-related risks.
- Benchmark product portfolios against leading retailers.
- Deliver clean, structured datasets through automated pipelines.
- Support merchandising, procurement, and revenue optimization.
- Generate actionable insights using advanced retail analytics.
By combining automation, scalable infrastructure, and data accuracy, Product Data Scrape helps organizations convert retail data into measurable business value.
Conclusion
The retail landscape continues to evolve rapidly, making data-driven decision-making essential for sustainable growth. From pricing optimization and assortment planning to SKU-level monitoring and competitive benchmarking, businesses need continuous visibility into retail performance to remain competitive. Comprehensive retail intelligence enables organizations to identify new market opportunities, respond to changing consumer behavior, optimize inventory strategies, and improve profitability.
The Costco Assortment & Pricing Data analysis Report 2026 demonstrates how historical pricing trends, product assortment evolution, promotional strategies, and SKU performance can provide valuable competitive intelligence. Organizations leveraging these insights can make smarter merchandising decisions, strengthen supplier negotiations, improve forecasting accuracy, and optimize category performance in an increasingly dynamic marketplace.
Product Data Scrape delivers reliable retail intelligence solutions designed to help businesses transform complex retail data into strategic advantages through advanced Pricing strategy services.
Ready to unlock actionable Costco retail intelligence? Contact Product Data Scrape today to access customized assortment monitoring, SKU-level pricing insights, and competitive analytics that empower smarter business decisions and accelerate growth in 2026 and beyond!



 Singapore
 EMAIL
EMAIL
 PHONE
PHONE











.webp)