Executive Summary
Most competitive analysis on Flipkart is about price. This report is about something that usually matters more and gets measured less: the products you are not selling at all.
A price disadvantage costs you margin on a sale you still make. An assortment gap costs you the entire sale — silently, with no signal, because a SKU you do not list generates no data, no lost-sale alert, and no line in any dashboard. It simply is not there, and its absence is invisible precisely because it is an absence.
This report sets out a method for Flipkart assortment gap analysis — systematically identifying the SKUs, variants, and sub-categories your competitors list and you do not — and explains why the output is one of the highest-return, lowest-effort competitive datasets a category team can act on.
Three framing findings:
Assortment gaps are large and largely invisible. Across the panels we observe, the share of relevant SKUs a given brand does not list is consistently higher than the brand assumes.
The gaps concentrate in variants and the long tail — the sizes, colours, configurations, and pack formats that are easy to overlook one at a time and substantial in aggregate.
The gap is directly actionable. Unlike most competitive findings, an assortment gap converts into a specific listing action, not a strategy discussion.
This report is published by Product Data Scrape. Figures are representative of observed patterns and are illustrative rather than a market census.
Why Assortment Gaps Are Invisible
A price gap announces itself. Your SKU is listed, the competitor's is listed, the prices differ, and any price monitor surfaces it.
An assortment gap is the opposite. There is nothing to compare, because on your side there is nothing at all. The competitor lists a SKU; you do not; and because you do not, the SKU never enters your reporting. Your sell-through data cannot flag a product you never stocked. Your review monitoring cannot flag a listing you never created. The gap is invisible for the same reason it is expensive: the SKU is simply absent, and absence generates no signal.
The only way to see an assortment gap is to look at the market from the outside — to enumerate what exists on the platform in your categories, and subtract what you list. That is an external-data problem by definition. It cannot be answered from internal systems, because internal systems only know about products you have decided to sell.
Method: How Assortment Gap Analysis Works
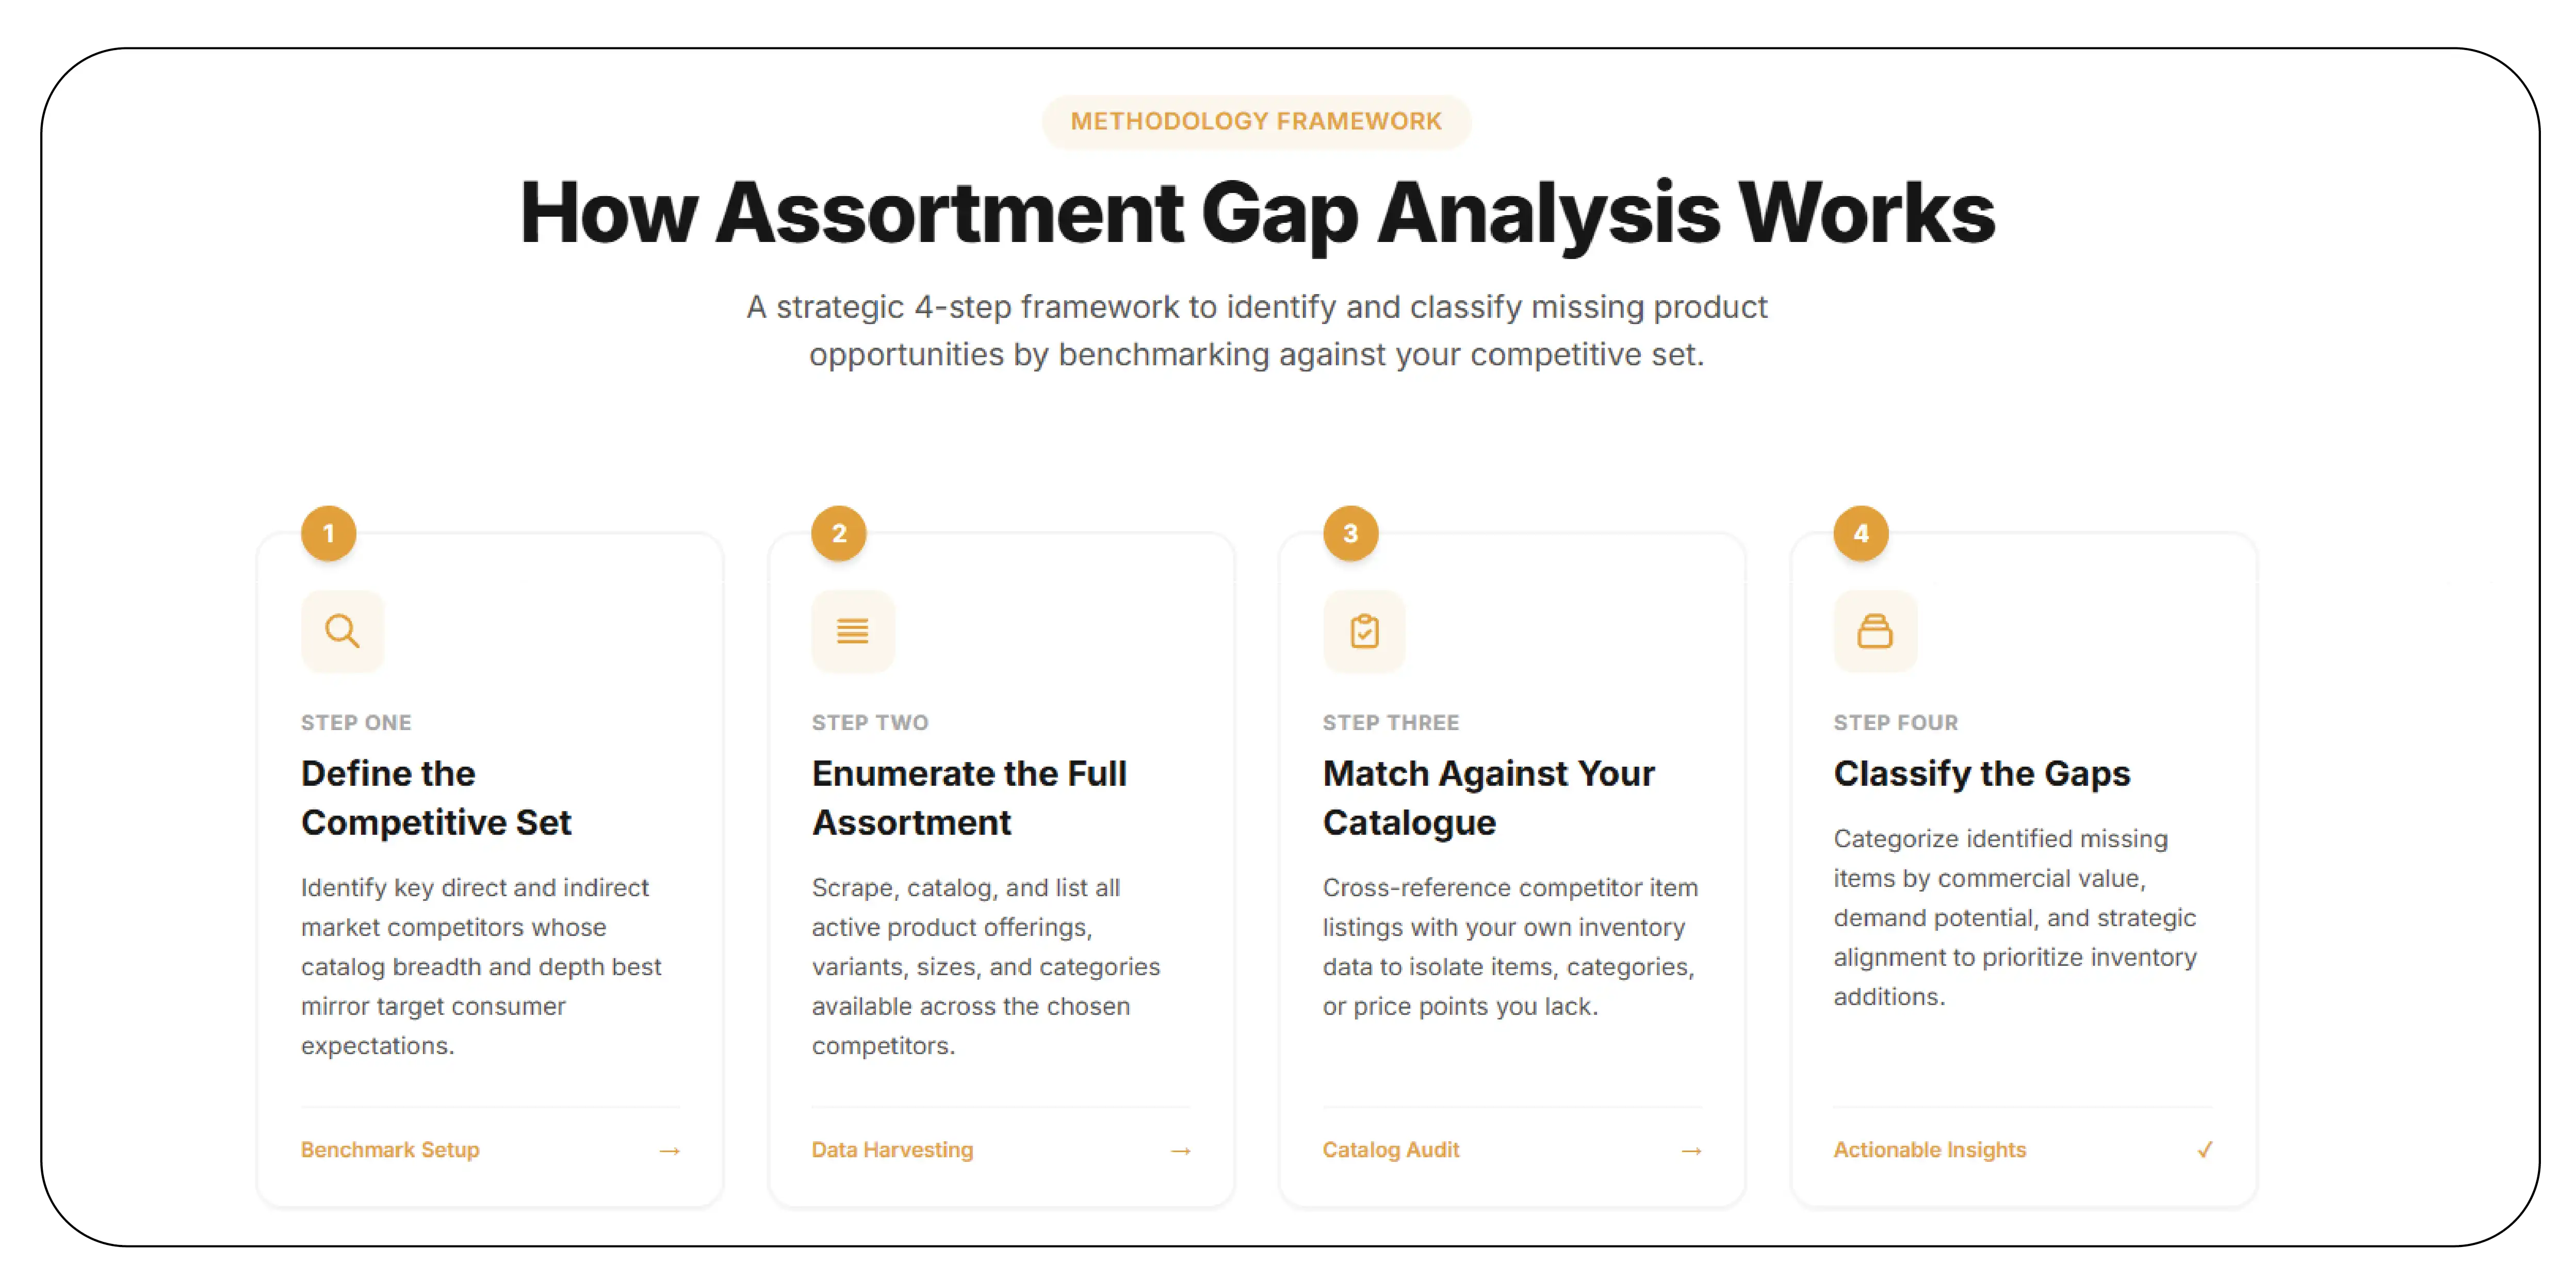
The analysis proceeds in four steps.
Step 1 — Define the competitive set. Identify the competitor brands and sellers whose assortment is relevant to yours. Assortment gaps are only meaningful against a defined reference.
Step 2 — Enumerate the full listed assortment. Capture every SKU the competitive set lists in the relevant categories — not a sample, the full enumeration, down to the variant level. Completeness is the whole game here: a sampled enumeration produces a sampled gap, which is worse than useless because it looks authoritative.
Step 3 — Match against your own catalogue. Match the enumerated competitor assortment against your own listed SKUs, at the variant level, on model and attribute identity rather than title string.
Step 4 — Classify the gaps. Everything the competitive set lists that you do not becomes a candidate gap, then classified: a SKU you do not sell at all; a SKU you sell but in fewer variants; a sub-category you are underrepresented in; or a deliberate exclusion you have already decided against.
The output is a prioritised list, not a number. The number ("you're missing 18% of the relevant assortment") gets attention in a meeting. The list ("here are the 240 specific variants, ranked") is what a merchandising team actually executes against.
Finding One: The Gaps Are Larger Than Brands Assume
| Category |
Median Share of Relevant Assortment a Brand Does Not List |
Where the Gap Concentrates |
| Fashion |
~24% |
Sizes and colourways of products already carried |
| Electronics accessories |
~19% |
Configurations and compatibility variants |
| Personal care |
~16% |
Pack sizes and bundle formats |
Illustrative figures.
The consistent surprise for brands is not that gaps exist — it is their size. A brand that believes it carries "essentially the full range" routinely discovers that a fifth of the relevant, actively-selling assortment in its own categories is listed by competitors and absent from its own catalogue.
Finding Two: The Gaps Hide in Variants
The most valuable finding in this analysis is where the gaps sit, and the answer is almost always the same: not in missing hero products, but in missing variants of products already carried.
A brand lists a garment in four of the six sizes a competitor offers. It lists a device in the 128 GB configuration but not the 256 GB. It lists a shampoo in the 340 ml bottle but not the 650 ml value pack. Each individual gap is tiny and easy to miss. In aggregate, across a catalogue, they are the majority of the total gap.
| Gap Type |
Share of Total Gaps (Illustrative) |
| Missing variant of a carried product |
~61% |
| Missing product entirely |
~22% |
| Underrepresented sub-category |
~17% |
Illustrative figures.
Implication: the highest-return listing actions are frequently the easiest ones — adding a size or a configuration of a product you already sell, source, and photograph. There is no new product to launch, no new supplier to onboard. The variant gap is, disproportionately, low-effort revenue that is invisible one SKU at a time and substantial in aggregate.
This is also why the analysis has to run at the variant level. A SKU-level gap analysis that treats "garment listed" as coverage misses 61% of the opportunity, because the gap is inside the SKU, not between SKUs.
Finding Three: Some Gaps Are Correct
Not every gap should be closed, and a serious analysis says so.
Some absences are deliberate and correct: products a brand has discontinued, variants that did not sell, formats that do not fit the brand's positioning, sub-categories it has chosen to stay out of. Closing those gaps would be a mistake, and an analysis that flags every absence as an opportunity is not doing the brand a service.
This is why the fourth step — classification — matters as much as the enumeration. The value is not "here is everything you don't list." The value is "here is everything you don't list, separated into what you've correctly excluded and what you've simply missed." The second bucket is the deliverable. The first is the noise, and keeping them apart is what makes the output usable rather than overwhelming.
Finding Four: Gaps Are a Time Series, Not a Snapshot
Assortment is not static. Competitors add SKUs continuously — new launches, new variants, seasonal ranges. A one-time gap analysis is accurate on the day it runs and decays from there.
The higher-value implementation is continuous: a standing feed that surfaces newly appearing competitor SKUs as they are listed, so the gap list stays current and new launches are caught within days rather than discovered a season later. A competitor's new variant is most worth matching when it is new — the brand that spots it within a week can respond inside the same selling season; the brand that finds it in an annual review has already ceded the window.
Implication: treat assortment gap analysis as monitoring, not as a project. The gap you close today reopens the next time a competitor extends its range, and the value of catching that extension decays quickly.
What Brands Should Do
Enumerate at the variant level. Most of the gap is inside SKUs, not between them. A SKU-level analysis misses the majority of the opportunity.
Classify, don't just list. Separate correct exclusions from genuine misses. The second bucket is the deliverable.
Start with the variant gaps. They are the highest return for the lowest effort — variants of products you already sell and source.
Run it continuously. Assortment moves; catch new competitor SKUs as they appear, while matching them still affects the current season.
Pair with pricing, but keep it separate. An assortment gap and a price gap are different problems with different owners and different remedies. Do not let the louder price conversation bury the more valuable assortment one.
Limitations
Findings reflect observed panels, not a platform census, and category composition materially affects every figure. Variant-level matching depends on attribute data quality and is imperfect where identity is ambiguous. The classification of a gap as "missed" versus "correctly excluded" ultimately depends on the brand's own strategy and cannot be fully automated. Figures are illustrative of observed patterns rather than audited statistics.
About the Data
This report was produced using assortment data collected by Product Data Scrape. We enumerate full competitor assortment on Flipkart at the variant level, match it against your catalogue, and classify the gaps — delivering a prioritised, deduplicated listing-opportunity list rather than a raw dump.
Delivered as JSON, CSV, via REST API, or pushed directly to cloud storage and data warehouses, with continuous new-SKU detection available as a standing feed.
Want your own assortment gaps mapped? Product Data Scrape will enumerate your competitive set's full Flipkart assortment, match it against yours at the variant level, and hand you the ranked list of SKUs your competitors sell that you don't.
Product Data Scrape — turning marketplace complexity into decision-ready data.



 Singapore
 EMAIL
EMAIL
 PHONE
PHONE











.webp)