Executive Summary
Most competitive pricing programmes on Flipkart track a single number per SKU. That number is the standard listed price — the one a non-member sees on the product page.
It is increasingly the wrong number to be tracking.
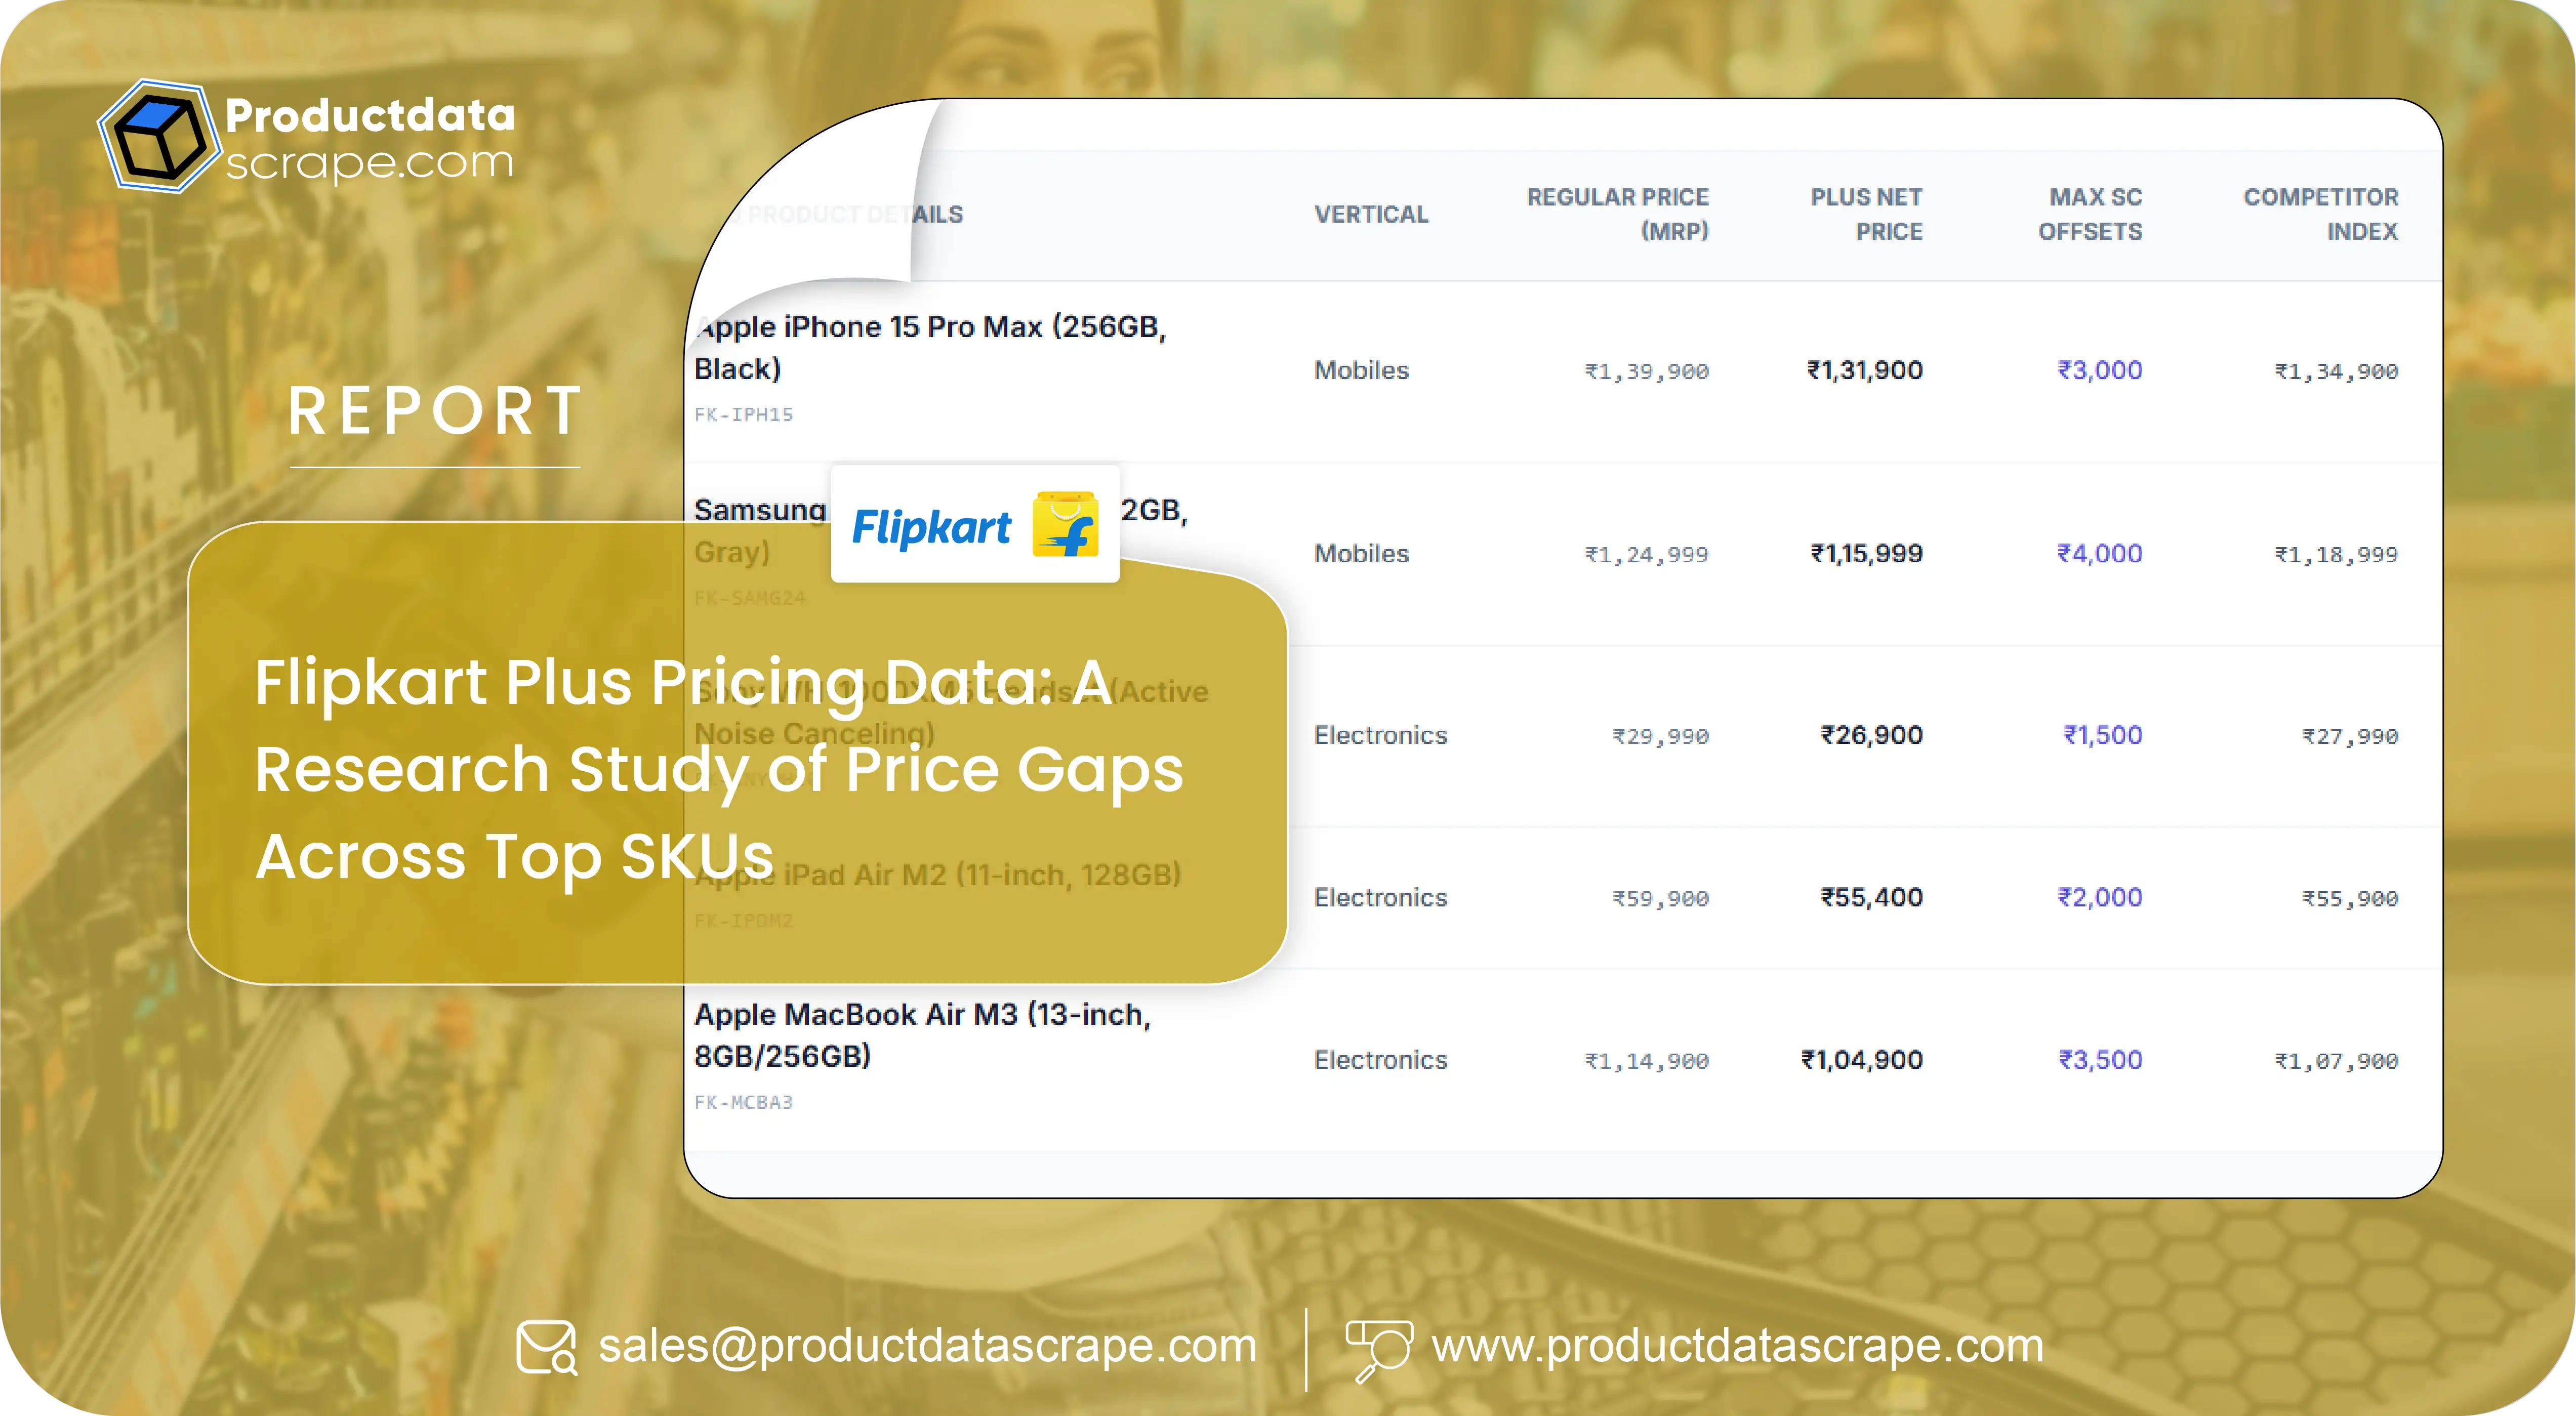
This study examines Flipkart Plus pricing data — the parallel price tier shown to Flipkart Plus members — across a monitored panel of high-velocity SKUs, and finds that the two price tiers do not move together. In several categories, the standard price stays close to flat while the Plus price is discounted repeatedly. A brand benchmarking only the standard price sees a stable competitor. The member sees a competitor who has cut prices four times in a month.
The headline finding: on the categories studied, roughly two-thirds of monitored SKUs showed a measurable Plus-tier price gap, and in the most competitive category that gap widened over the observation window while the standard-price gap did not.
This report is published by Product Data Scrape. Figures presented are representative of observed patterns across our Flipkart monitoring panel and are illustrative rather than a live market census.
1. Why Dual-Tier Pricing Breaks Standard Benchmarking
Flipkart Plus is Flipkart's loyalty programme. Members receive exclusive prices, early access to deals, and SuperCoin-based benefits. Structurally, this means a single SKU has at least two prices at any moment — and the platform decides which one to render based on the customer's membership state.
For a data pipeline, this creates a subtle and dangerous failure mode. A scraper that captures "the price" does not capture a wrong number in an obvious way. It captures a plausible number. It just captures a number that describes a customer segment the analyst did not intend to study — and it does so silently, with no error and no warning.
The result is a pricing programme that is confidently benchmarking against a price that a growing share of buyers never see.
2. Methodology
- Panel: A monitored set of high-velocity SKUs across three categories — Mobiles & Accessories, Small Appliances, and Personal Care & Grooming.
- Capture: Both standard_price and plus_exclusive_price captured on every record, alongside MRP, seller array, F-Assured status, and the offer stack.
- Frequency: Four captures daily per SKU.
- Geography: A pincode panel spanning metros and tier-2 cities.
- Window: A continuous multi-week observation window outside a major sale event, to isolate baseline behaviour from Big Billion Days distortion.
- Key metric: Plus Gap = (standard price − Plus exclusive price) ÷ standard price.
Records where no Plus price was rendered were retained and coded as zero-gap rather than dropped — dropping them would have inflated the average gap and produced exactly the kind of flattering-but-wrong finding this study exists to warn against.
3. Finding One: The Plus Gap Is Common, and It Is Category-Dependent
Across the panel, a majority of monitored SKUs carried a non-zero Plus gap.
| Category |
Share of SKUs with a Plus Gap |
Median Plus Gap |
Widest Observed Gap |
| Mobiles & Accessories |
~71% |
4.6% |
11.2% |
| Small Appliances |
~64% |
3.8% |
9.4% |
| Personal Care & Grooming |
~52% |
2.4% |
6.8% |
The pattern is intuitive once stated: the gap is widest where competition is fiercest and where the customer is most price-sensitive at the point of decision. Mobiles is the most contested category on the platform, and it carries the widest and most frequent member discounting.
Implication: the error introduced by single-price benchmarking is not uniform. It is largest exactly where pricing decisions matter most.
4. Finding Two: The Two Tiers Move Independently
This is the finding with the sharpest operational consequence.
For a representative mobile-accessory SKU over the observation window:
| Week |
Standard Price |
Plus Price |
Plus Gap |
| 1 |
2,999 |
2,899 |
3.3% |
| 2 |
2,999 |
2,849 |
5.0% |
| 3 |
2,999 |
2,799 |
6.7% |
| 4 |
2,949 |
2,699 |
8.5% |
A brand tracking only the standard price observed a competitor who moved once, by 50 rupees, in four weeks — a competitor comfortably described as "stable" in any pricing review.
A brand tracking Flipkart Plus pricing data observed a competitor who cut the member price three times, widening the effective gap from 3.3 percent to 8.5 percent. That is not a stable competitor. That is a sustained, targeted campaign aimed at the platform's highest-value buyers, executed entirely below the visibility threshold of conventional monitoring.
Implication: the Plus tier is being used as a low-visibility competitive lever. It is where price competition migrates when brands do not want to reset their headline price — and it is invisible to anyone not capturing it.
5. Finding Three: Stacking Offers Inverts the Ranking
Plus pricing does not exist in isolation. It sits inside an offer stack that includes bank discounts, no-cost EMI, exchange offers, and SuperCoin earn value. When the full stack is computed, competitive rankings frequently invert.
| SKU |
Standard Price |
Plus Price |
Best Bank Offer |
Effective Price (Non-member) |
Effective Price (Plus Member) |
| Brand A |
3,499 |
3,299 |
−250 |
3,249 |
3,049 |
| Brand B |
3,399 |
3,349 |
−100 |
3,299 |
3,249 |
On standard price, Brand B is cheaper. On effective price, in both tiers, Brand A is cheaper — by 50 rupees for a non-member and by 200 rupees for a Plus member. A pricing team benchmarking on listed price would conclude it was being undercut and respond with a discount it did not need.
Implication: any competitive price index built on listed price alone can produce not merely imprecise conclusions but directionally inverted ones.
6. Finding Four: F-Assured and Plus Pricing Cluster Together
Sellers offering Plus-exclusive pricing on a SKU were substantially more likely to also hold F-Assured status. The two signals travel together — both are markers of a seller operating inside Flipkart's trusted, high-investment tier.
The practical corollary is a brand-protection heuristic: a seller offering an unusually low price with no Plus tier and no F-Assured badge is the profile most worth investigating. In our monitoring work, that combination is the single most reliable early signal of an unauthorised listing.
7. What Brands Should Change
Capture both tiers on every record. This is a one-line schema change with outsized consequences. It cannot be backfilled — data not captured is gone.
Benchmark on effective price, not listed price. Compute the full stack: listed price, member price, bank offers, EMI value, exchange value, SuperCoin earn.
Report the Plus gap as a trend, not a snapshot. The gap's direction over time is the competitive signal. A single reading tells you almost nothing.
Alert on gap widening, not just price drops. A competitor holding the headline price while widening the member gap is escalating. Conventional monitoring will not fire an alert. It should.
Segment your own strategy by tier. If competitors are using the Plus tier as their primary competitive instrument, matching them on headline price is both expensive and beside the point.
8. Limitations
Findings reflect a monitored panel rather than a complete platform census. Category composition, sale-event timing, and pincode selection all influence observed gaps. The observation window deliberately excluded Big Billion Days; sale-period dynamics differ substantially and warrant separate study. Figures are illustrative of observed patterns, not audited market statistics.
9. About the Data
This report was produced using Flipkart Plus pricing data collected by Product Data Scrape. Our Flipkart datasets capture standard and Plus pricing on every record, alongside F-Assured status per seller, the full multi-seller array, per-variant pricing and stock, pincode-level pricing across India, bank offers and EMI terms, SuperCoin earn rates, and Big Billion Days deal flags.
Data is delivered as JSON, CSV, via REST API, or pushed directly to cloud storage and data warehouses.
Want this analysis run on your own category? Product Data Scrape will build a sample Flipkart Plus pricing dataset on your SKUs and your competitors' SKUs, and show you the gap you are not currently measuring.
Product Data Scrape — turning marketplace complexity into decision-ready data.



 Singapore
 EMAIL
EMAIL
 PHONE
PHONE











.webp)