Executive Summary
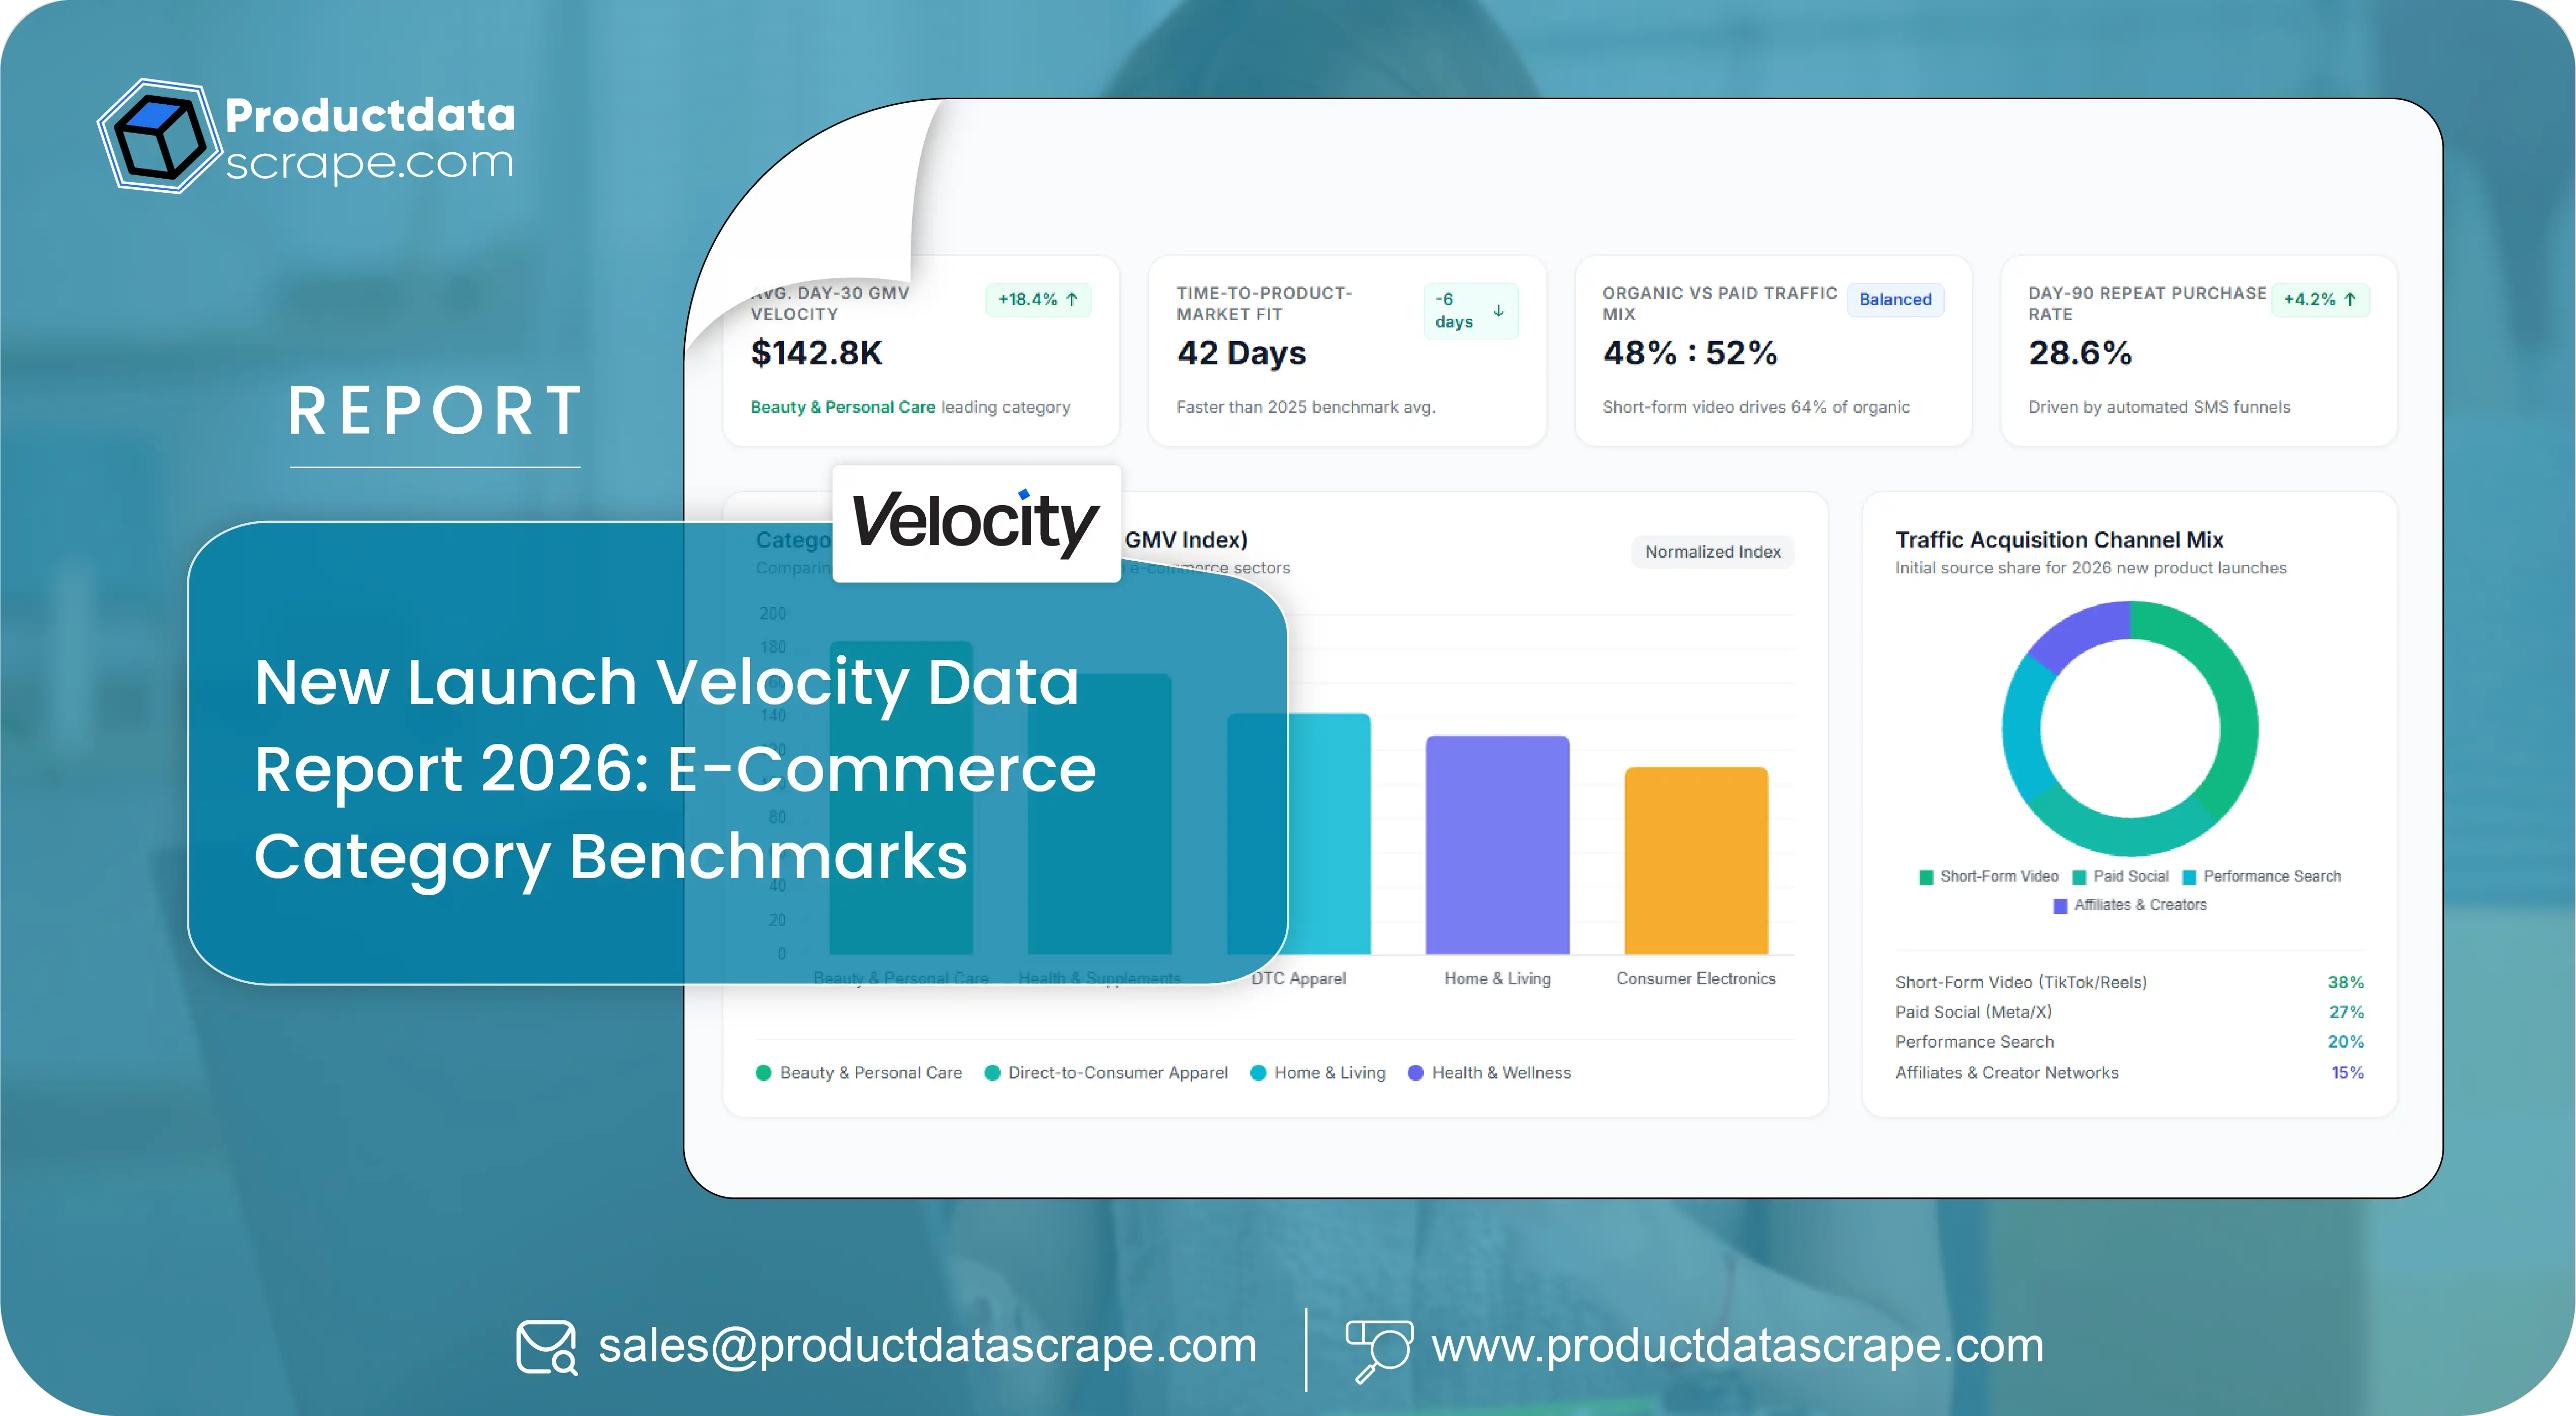
The pace of new product launches has become a competitive signal in its own right. In fast-moving categories, hundreds of new SKUs appear every month, a handful break out within weeks, and most quietly fade — and the brands that see this motion early are the ones that react to trends before they peak. This report from Product Data Scrape uses large-scale New Launch Velocity Data to measure how quickly products launch, gather reviews, and climb the rankings across major marketplaces in 2026.
The figures below are representative benchmarks drawn from Product Data Scrape's managed monitoring across leading platforms. They are designed to help brand, merchandising, and trend teams understand launch dynamics — not to replace a scoped audit of a specific category.
Why Launch Velocity Matters
Every new listing is a small bet on demand, and the aggregate rate of those bets tells you where a category is heating up. A sudden surge of new SKUs in a subcategory usually precedes a demand wave; a slowdown often signals saturation. Brands that track this motion can time their own launches, spot white space, and identify emerging competitors while they are still small.
Velocity also exposes how a market rewards speed. In trend-driven categories, the first movers to a new format or ingredient capture the early search interest and the review base that compounds into ranking. By the time a slower brand notices, the shelf position is already taken. New Launch Velocity Data turns this otherwise invisible motion into a measurable early-warning system.
What This Report Measures

For this study, Product Data Scrape tracked newly listed SKUs across beauty, electronics, home, and fashion on leading marketplaces, following each new product from first appearance through its early lifecycle. New listings are identified as they publish, so the dataset captures launches in near real time rather than in retrospect.
For every new SKU, the dataset records launch date, launch price, days to first review, review accumulation rate, category and keyword rank progression, and whether the product reaches a top-ranked position within its first weeks. Rolled up by category, these signals produce launch-volume trends, time-to-traction benchmarks, and break-out rates that show which categories reward new entrants and which punish them.
Key Findings
The 2026 monitoring data surfaces several consistent patterns across categories:
Launch volume is highly seasonal. New-SKU counts spike ahead of major sale events and festive windows, as brands time introductions to catch peak traffic.
Beauty launches fastest, saturates fastest. Beauty shows the highest new-SKU volume and the shortest time to first review, but also the steepest fade rate for products that miss early traction.
Early reviews decide the outcome. Products that gather their first cluster of reviews quickly are far more likely to reach a top-ranked position, confirming that early momentum is self-reinforcing.
Most launches never trend. Only a small share of new SKUs reach a top-100 category position, so break-out rate is a sharper success metric than raw launch count.
Price anchors the launch. Break-out products tend to launch at a deliberate, competitive price point rather than at a premium, using price to buy the early volume that seeds reviews.
Together, these findings show that launching is easy and breaking out is rare — and that the brands winning consistently are the ones engineering early momentum on purpose.
Sample Data: New Launch Tracking by Category
The value of New Launch Velocity Data is in the lifecycle record behind every launch. Below is a representative sample of the structured output Product Data Scrape delivers.
| Category |
New SKUs (30d) |
Avg Days to First Review |
Median Launch Price |
% Reaching Top 100 |
Marketplace |
Captured |
| Skincare |
1,240 |
6 |
₹549 |
7% |
Nykaa |
2026-07-14 |
| True Wireless Earbuds |
380 |
9 |
₹1,499 |
5% |
Amazon |
2026-07-14 |
| Kitchen Gadgets |
610 |
11 |
₹399 |
4% |
Flipkart |
2026-07-13 |
| Activewear |
920 |
8 |
₹899 |
6% |
Myntra |
2026-07-13 |
| Home Fragrance |
210 |
12 |
₹699 |
3% |
Amazon |
2026-07-12 |
Every row is timestamped and category-level, so merchandising teams can see where launch activity is accelerating and how long new products typically take to gain traction.
How Brands Use New Launch Velocity Data
Brands that monitor launch velocity use the data to move earlier and smarter. First, they detect emerging trends by watching for surges of new SKUs around a new ingredient, format, or feature, then move their own roadmap to meet the wave rather than chase it.
Second, they benchmark their own launches against category norms — if the typical break-out product gathers reviews in a week and theirs is lagging at three, they know to intervene with seeding, promotion, or content before the window closes. Third, they track competitor entry. A cluster of new listings from a rival, or a fast-rising unknown seller, becomes visible immediately instead of at the next quarterly review.
Retailers and trend forecasters use the same feed to spot categories on the rise and allocate assortment and inventory accordingly. Across all of these uses, the data converts the constant churn of new listings into a clear read on where a market is moving next.
What Changed in Launch Dynamics in 2026
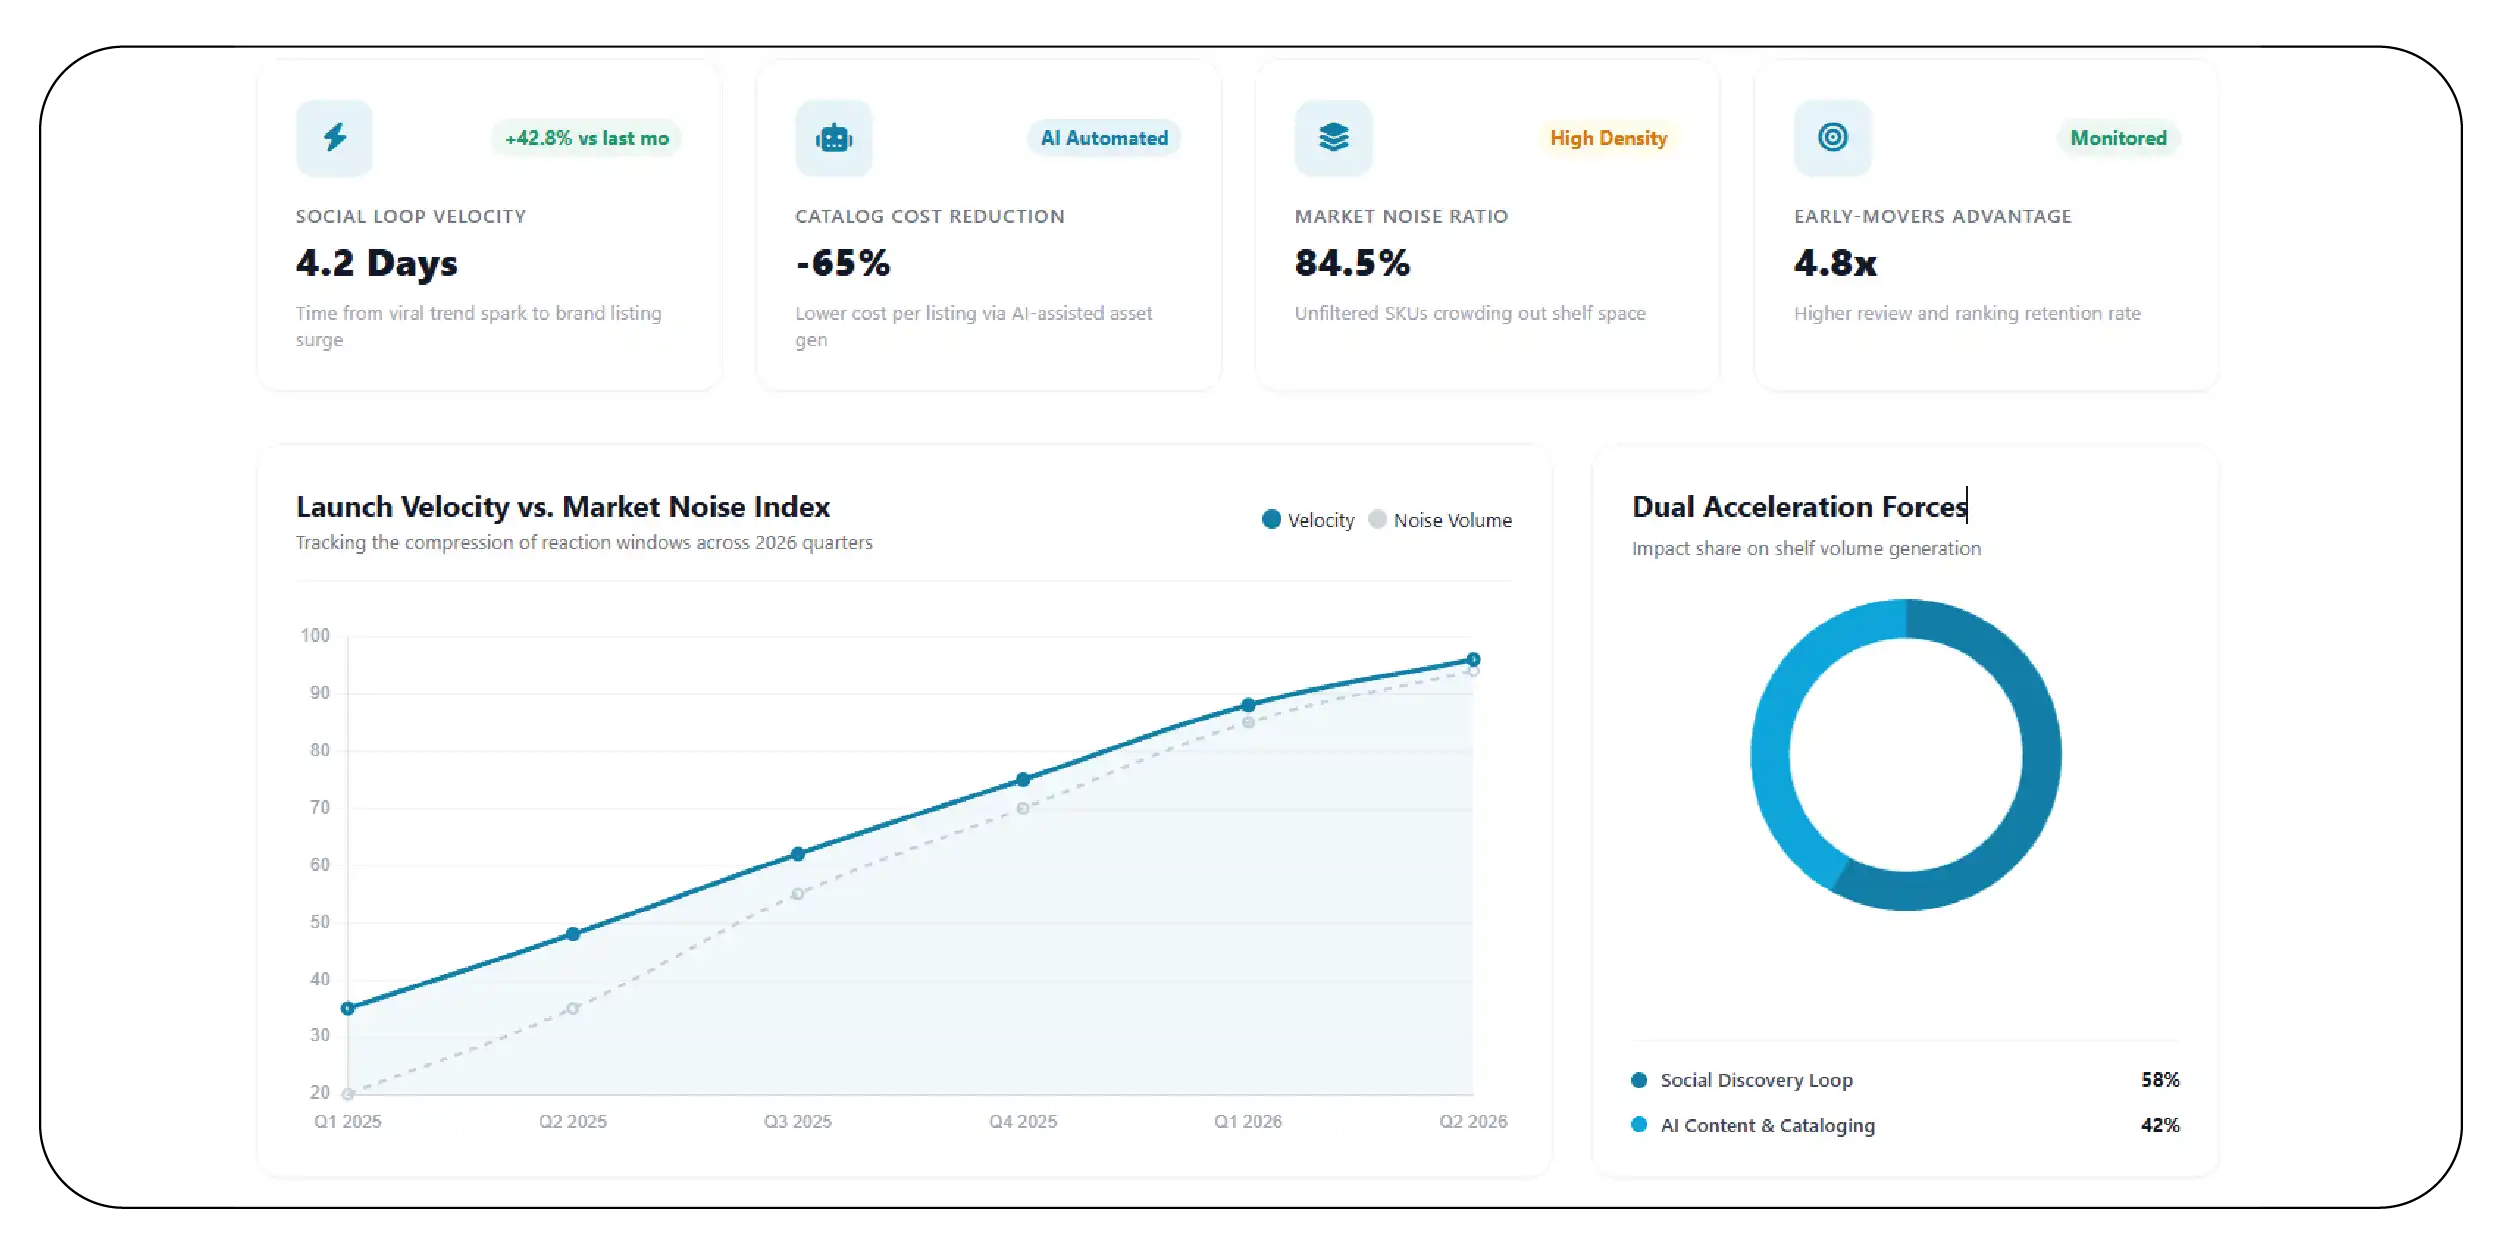
Two forces have accelerated launch velocity. Social commerce has turned discovery into a real-time loop, so a format that trends on social can trigger a wave of new listings within days as brands and sellers rush to meet the moment. And AI-assisted content and cataloging have lowered the cost of listing, so more SKUs reach the shelf faster than ever — which raises volume but also noise.
The practical consequence is that the window to react to a trend has narrowed. A brand that once had a season to respond to a new format now has weeks before the early movers lock in the reviews and ranking that decide the category. Launch velocity monitoring is what compresses a brand's own reaction time to match, surfacing the surge while there is still room to act. In a market where most launches fail and a few define the category, seeing the motion early is the difference between leading a trend and arriving after it has already been claimed.
New Launch Velocity Data FAQs
How do you detect a new launch? New listings are identified as they publish across monitored marketplaces, so launches are captured in near real time rather than discovered later.
What signals indicate a break-out early? A fast first cluster of reviews and quick rank progression are the strongest early indicators, often visible well before a product reaches a top position.
Can this track competitor launches? Yes. Clusters of new listings from a competitor or a fast-rising unknown seller surface immediately, giving early warning of new entrants.
Methodology and Data Quality
The findings in this report are built from listing-level data collected by Product Data Scrape's managed pipelines, not from surveys or estimates. Products are captured directly from live marketplace pages at scale, normalized into a consistent schema, and matched across platforms so that every comparison is genuinely like-for-like. Prices, availability, and other fields are recorded with a timestamp, which makes it possible to measure change over time rather than relying on a single snapshot that is out of date the moment it is taken.
Every dataset passes automated validation before it is used. Duplicate listings are removed, outliers are flagged for review, and records that fail consistency checks are re-collected rather than left to distort the results. Because the pipelines are monitored continuously, coverage adapts as marketplaces change their page structures, so the data stays reliable even as the sites underneath it evolve. This is what separates a defensible launch benchmark from a one-off manual scrape that cannot be repeated or trusted at scale.
Who This Report Is For
This report is written for brand and merchandising teams, trend and innovation leads, marketplace sellers timing their introductions, and analysts tracking category momentum. If your growth depends on launching the right products at the right moment, launch-velocity benchmarks belong in your planning cycle.
What You Get With Product Data Scrape
Product Data Scrape delivers New Launch Velocity Data as a managed service across leading marketplaces, so teams do not have to build or maintain scrapers in-house. Coverage detects new listings as they appear and follows each through its early lifecycle, capturing launch date, price, review accumulation, and rank progression.
Data is refreshed on a cadence you choose and delivered in the format your team already uses — CSV, JSON, API feed, or dashboard. Because the pipelines are custom-built and monitored, coverage extends to new categories and marketplaces as they grow, so your view of launch activity stays current.
Get Your Category Benchmarked
The figures in this report are representative; your real launch dynamics depend on the categories and marketplaces you operate in. Product Data Scrape will run a free sample dataset scoped to your category, so you can see the exact fields, accuracy, and launch benchmarks before committing to anything.
Request a sample to benchmark launch velocity in your category — and turn New Launch Velocity Data into an early-warning system that helps you launch on time, break out faster, and spot competitors before they scale.



 Singapore
 EMAIL
EMAIL
 PHONE
PHONE











.webp)