
Introduction
The U.S. grocery industry is experiencing rapid digital transformation, driven by evolving consumer expectations, omnichannel retailing, and increasingly competitive pricing strategies. As inflation, supply chain fluctuations, and changing shopping behaviors continue to influence purchasing decisions, retailers and brands require accurate, real-time market intelligence to stay ahead. Data scraping for the US market has become an essential solution for collecting structured information from leading grocery retailers, enabling organizations to monitor prices, promotions, inventory, and assortment trends efficiently.
This US Grocery Price-Comparison Coverage Report 2026 provides comprehensive insights into grocery pricing intelligence across major U.S. supermarket chains. The report highlights market developments, pricing patterns, promotional strategies, product availability, and competitive positioning from 2020 through 2026. By leveraging automated data collection, businesses can identify emerging pricing trends, benchmark competitors, optimize promotional campaigns, and make informed merchandising decisions.
From national supermarket chains to discount grocery stores, access to reliable pricing data empowers retailers, CPG brands, analytics firms, and market researchers to strengthen decision-making and maximize profitability. With structured datasets updated regularly, organizations gain the visibility needed to respond quickly to changing market conditions and consumer demand while maintaining a competitive advantage in the evolving U.S. grocery landscape.
Building Competitive Pricing Visibility
Understanding how grocery retailers position products across different price segments is essential for maintaining competitiveness. Businesses increasingly rely on automated intelligence to identify pricing gaps, promotional opportunities, and regional differences across leading supermarket chains. Modern data collection technologies enable organizations to monitor thousands of products daily while reducing manual effort and improving data accuracy.
Using US grocery price comparison across Albertsons & Aldi, businesses can evaluate pricing consistency, promotional frequency, private-label competitiveness, and category performance across two of the largest grocery retailers. Combined with a Grocery Web Scraping API, organizations receive structured, real-time pricing data that supports pricing optimization, assortment planning, and competitive benchmarking.
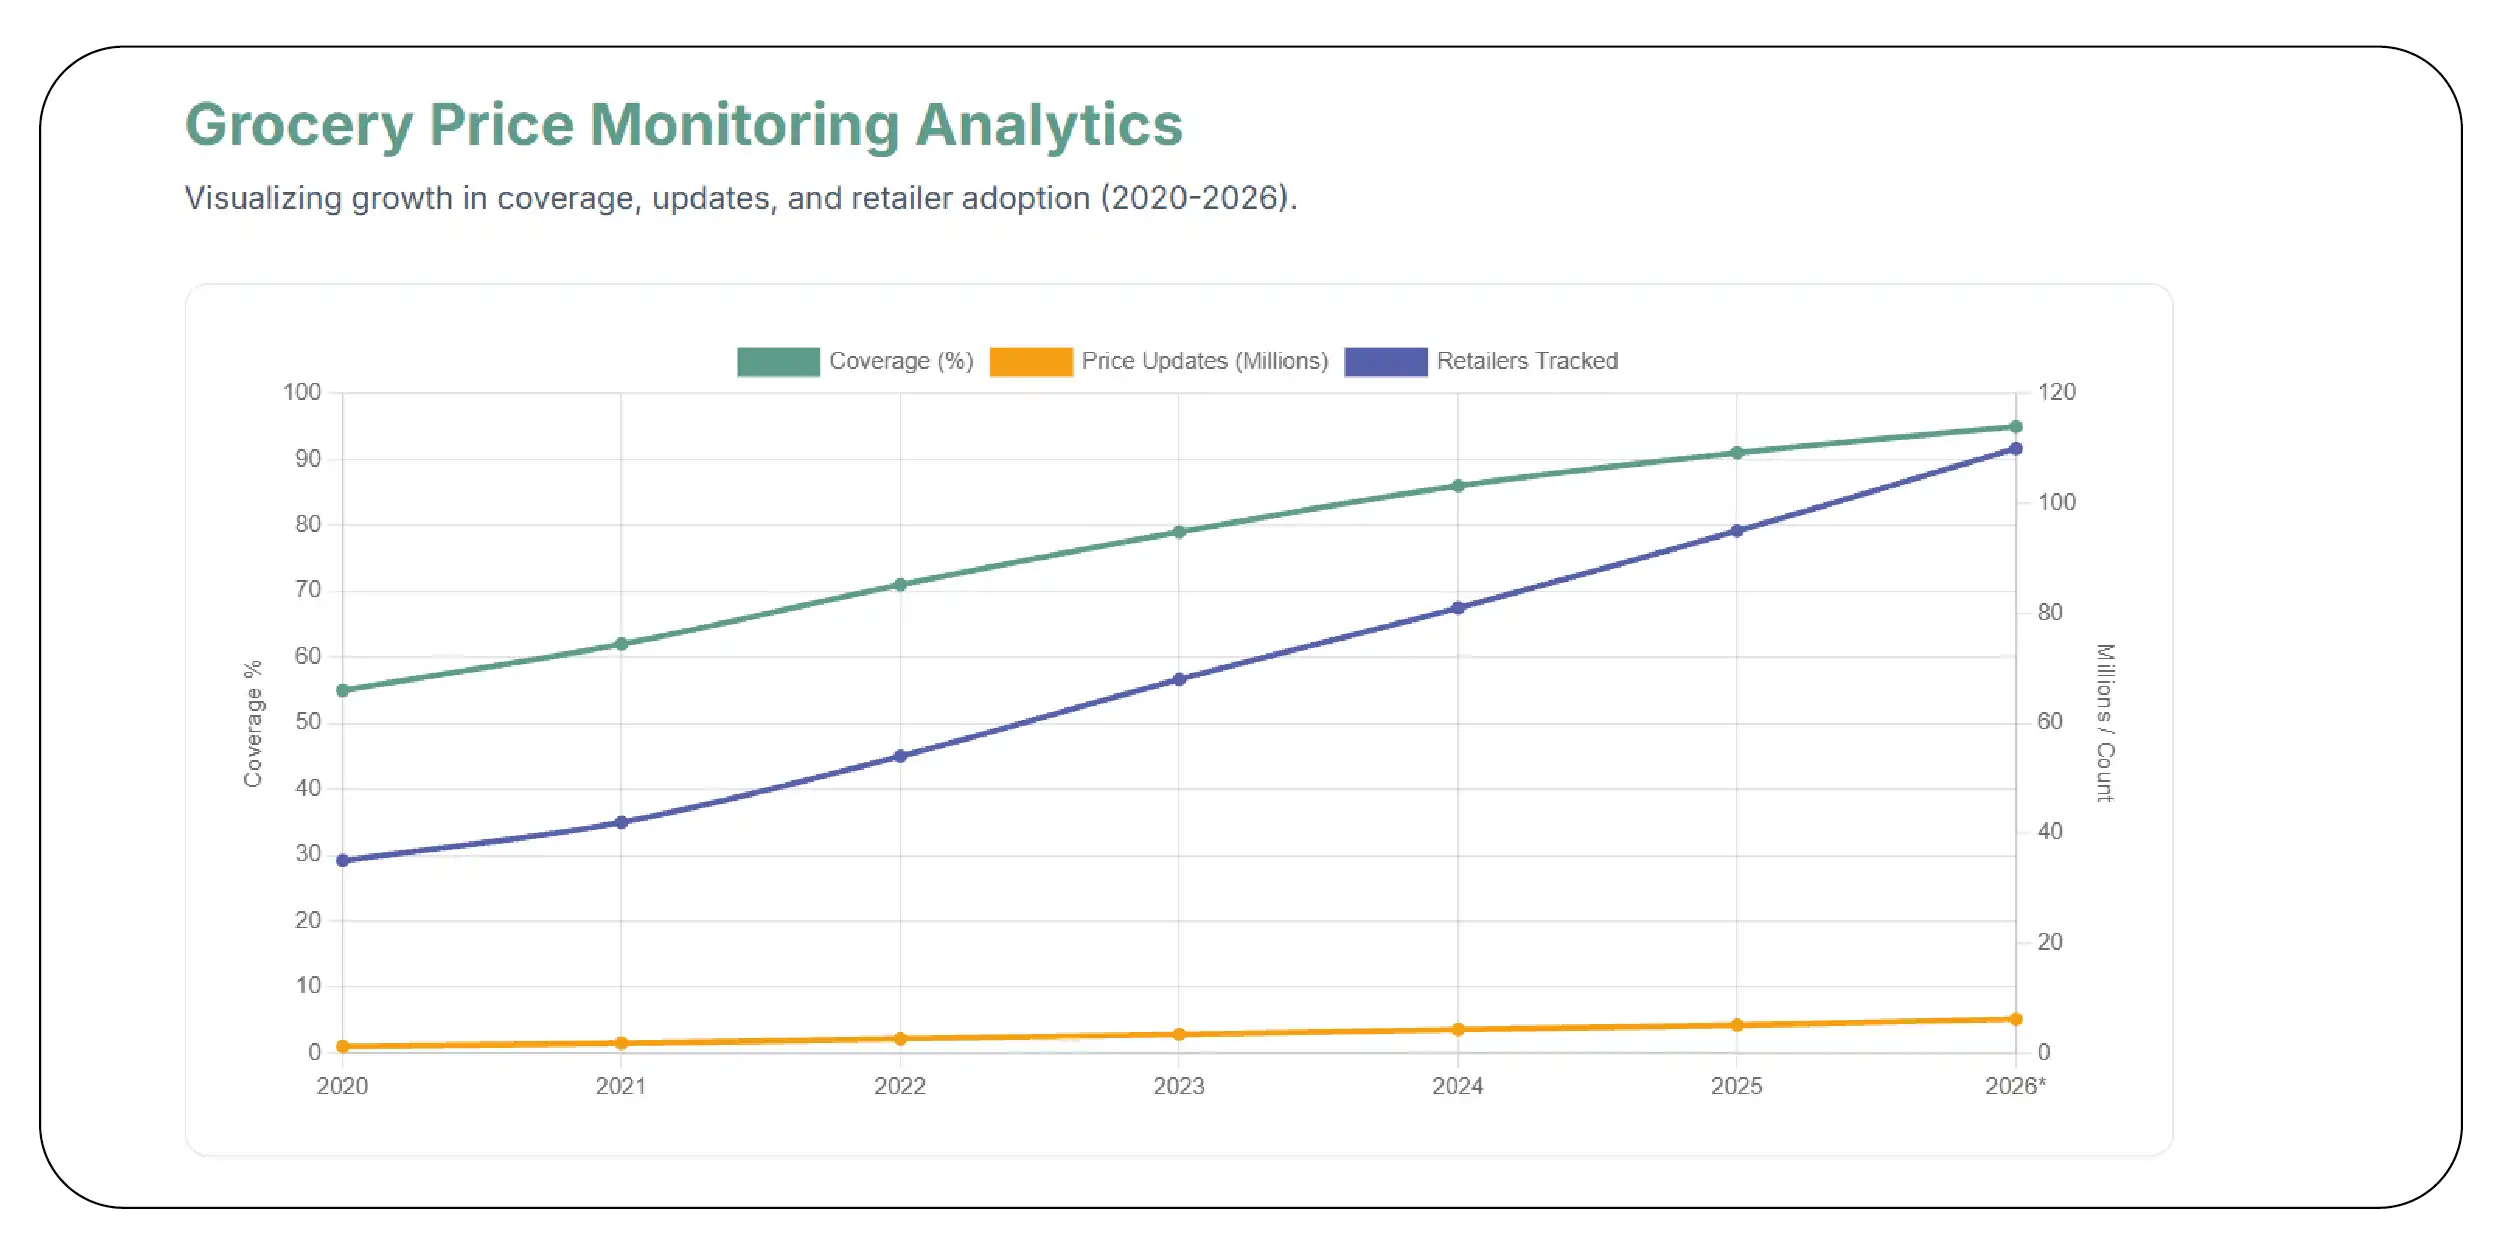
Grocery Pricing Intelligence Trends (2020–2026)
| Year |
Grocery Price Monitoring Coverage |
Daily Price Updates |
Retailers Tracked |
Business Adoption |
| 2020 |
55% |
1.2 Million |
35 |
Medium |
| 2021 |
62% |
1.8 Million |
42 |
Medium-High |
| 2022 |
71% |
2.6 Million |
54 |
High |
| 2023 |
79% |
3.4 Million |
68 |
High |
| 2024 |
86% |
4.3 Million |
81 |
Very High |
| 2025 |
91% |
5.1 Million |
95 |
Very High |
| 2026* |
95% |
6.2 Million |
110 |
Enterprise Scale |
*Projected estimates.
Organizations using automated grocery intelligence can quickly identify pricing changes, monitor seasonal discounts, evaluate promotional effectiveness, and benchmark product categories. Continuous market visibility also enables retailers to adjust prices dynamically, optimize inventory planning, and improve customer retention. As grocery competition intensifies, comprehensive pricing intelligence has become an indispensable resource for strategic retail decision-making.
Unlocking Advertising and Pricing Insights
Retail competition now extends beyond shelf pricing to include digital promotions, sponsored listings, loyalty discounts, and personalized offers. Monitoring these factors enables retailers and brands to understand how competitors influence customer purchasing decisions while maximizing campaign performance. Automated data extraction provides continuous access to promotional intelligence across multiple online grocery platforms.
Businesses that scrape grocery prices from Albertsons and Aldi gain valuable visibility into pricing movements, discount frequency, product positioning, and promotional timing. When integrated with Retail Media & Ad Intelligence, organizations can evaluate sponsored placements, banner campaigns, featured products, and advertising effectiveness alongside pricing trends to build more competitive marketing strategies.
Digital Grocery Promotion Trends (2020–2026)
| Year |
Online Promotions Tracked |
Sponsored Product Listings |
Digital Coupons |
Retail Media Investment Growth |
| 2020 |
180,000 |
28,000 |
95,000 |
12% |
| 2021 |
240,000 |
40,000 |
125,000 |
18% |
| 2022 |
330,000 |
58,000 |
170,000 |
24% |
| 2023 |
445,000 |
82,000 |
235,000 |
31% |
| 2024 |
570,000 |
110,000 |
310,000 |
37% |
| 2025 |
690,000 |
142,000 |
390,000 |
42% |
| 2026* |
820,000 |
175,000 |
470,000 |
48% |
*Projected estimates.
Integrated pricing and advertising intelligence helps businesses understand the relationship between promotions and customer demand. By tracking digital campaigns alongside product pricing, organizations can identify high-performing promotional strategies, optimize media investments, improve campaign ROI, and strengthen competitive positioning. Continuous access to pricing and advertising intelligence also supports more accurate forecasting, category management, and customer engagement initiatives across the rapidly evolving U.S. grocery retail ecosystem.
Enhancing Inventory Visibility Across Retailers
Effective assortment management is no longer limited to tracking product catalogs. Retailers and brands must continuously monitor product availability, stock levels, discontinued items, and new product launches across multiple grocery platforms. Automated data collection provides real-time visibility into assortment changes, helping organizations improve merchandising decisions and maintain a competitive edge.
Businesses that scrape supermarket prices across multiple US retailers gain a comprehensive understanding of pricing consistency while supporting Assortment and availability monitoring across diverse product categories. This approach enables retailers to identify out-of-stock products, compare SKU coverage, evaluate private-label expansion, and monitor seasonal assortment shifts. The resulting insights improve replenishment planning, supplier collaboration, and inventory optimization while reducing lost sales opportunities.
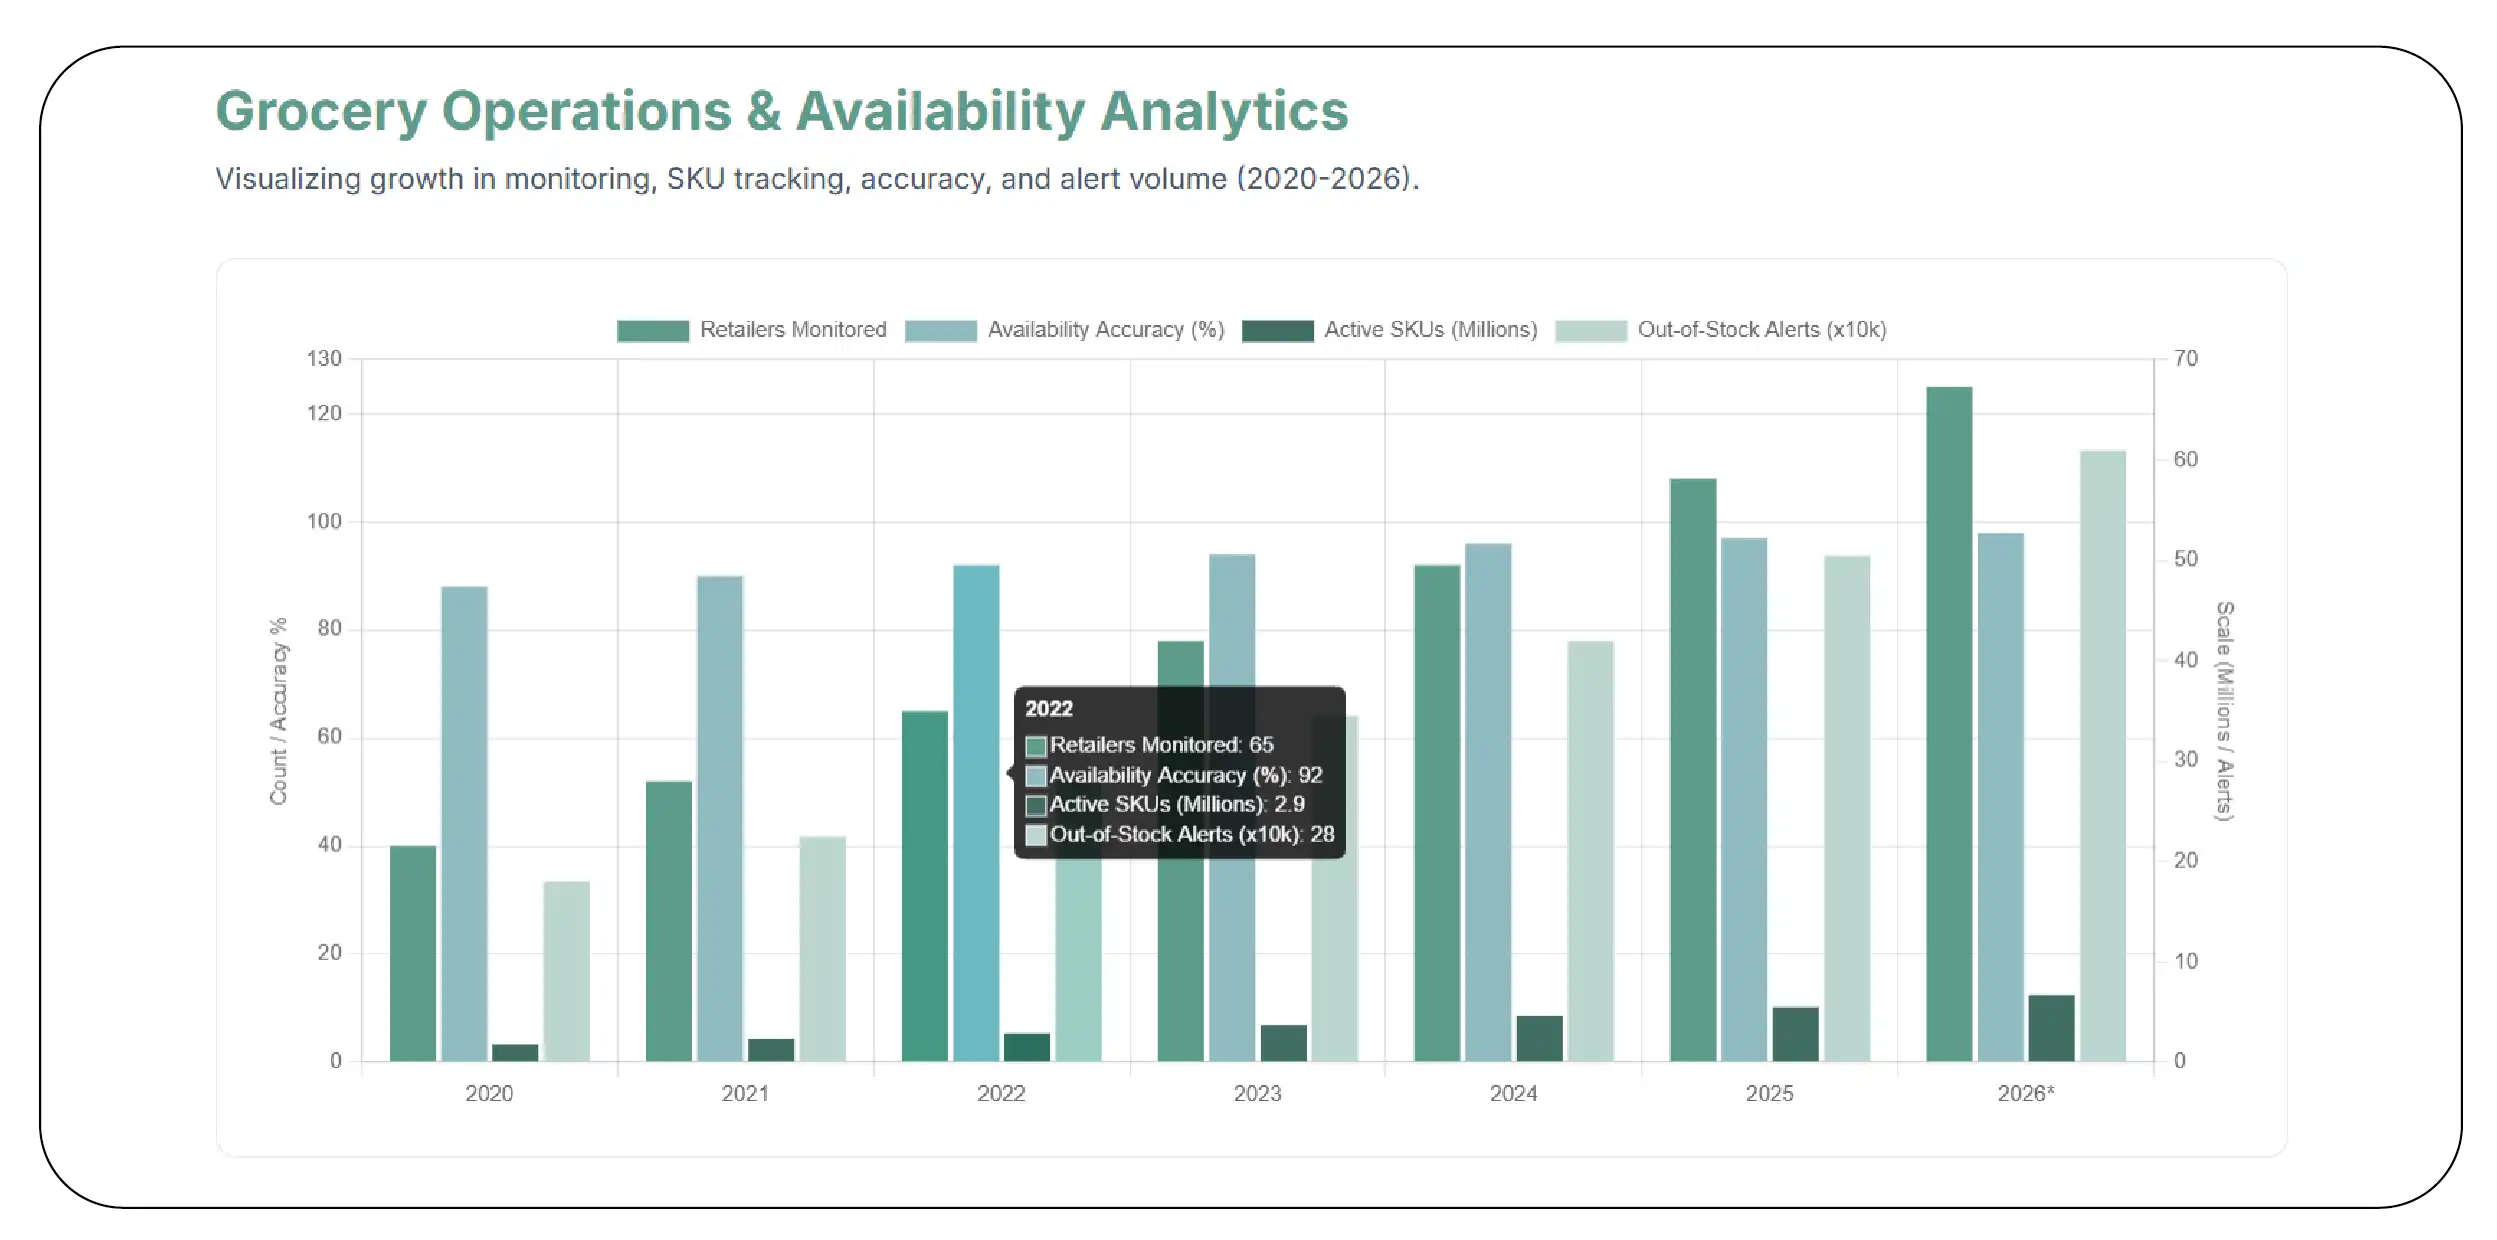
Multi-Retailer Assortment Monitoring Trends (2020–2026)
| Year |
Retailers Monitored |
Active SKUs Tracked |
Availability Accuracy |
Out-of-Stock Alerts |
| 2020 |
40 |
1.8 Million |
88% |
180,000 |
| 2021 |
52 |
2.3 Million |
90% |
225,000 |
| 2022 |
65 |
2.9 Million |
92% |
280,000 |
| 2023 |
78 |
3.7 Million |
94% |
345,000 |
| 2024 |
92 |
4.6 Million |
96% |
420,000 |
| 2025 |
108 |
5.5 Million |
97% |
505,000 |
| 2026* |
125 |
6.7 Million |
98% |
610,000 |
*Projected estimates.
Comprehensive assortment intelligence allows businesses to identify category gaps, analyze product lifecycle trends, and improve demand forecasting. Continuous monitoring also supports faster responses to supply chain disruptions, enabling retailers to maintain product availability and deliver better customer experiences. As grocery competition intensifies, real-time assortment visibility becomes a key differentiator for operational efficiency and long-term profitability.
Expanding Competitive Benchmarking Capabilities
Modern grocery businesses require broader competitive intelligence than single-retailer comparisons. Monitoring pricing across multiple retailer websites enables organizations to evaluate regional pricing strategies, promotional differences, and product positioning more effectively. Automated web data extraction significantly reduces manual research while increasing the frequency and accuracy of competitive analysis.
Organizations can compare grocery prices across Albertsons Aldi and custom websites to create customized competitive benchmarks tailored to specific markets, product categories, or business objectives. Combined with advanced Price scraping, this approach delivers structured pricing data across national chains, regional supermarkets, specialty grocery stores, and independent retailers. Businesses can use these insights to optimize pricing strategies, monitor promotional activity, and identify emerging market opportunities.
Competitive Price Intelligence Growth (2020–2026)
| Year |
Websites Compared |
Products Benchmarked |
Daily Price Changes Captured |
Competitive Insights Generated |
| 2020 |
30 |
900,000 |
140,000 |
Medium |
| 2021 |
42 |
1.3 Million |
210,000 |
Medium-High |
| 2022 |
58 |
1.9 Million |
320,000 |
High |
| 2023 |
74 |
2.7 Million |
470,000 |
High |
| 2024 |
90 |
3.5 Million |
620,000 |
Very High |
| 2025 |
108 |
4.4 Million |
810,000 |
Very High |
| 2026* |
130 |
5.6 Million |
1.05 Million |
Enterprise Scale |
*Projected estimates.
With broader competitive coverage, retailers can evaluate market positioning more accurately, detect pricing anomalies, and improve category performance. These insights support strategic pricing decisions, promotional planning, supplier negotiations, and long-term revenue growth while ensuring businesses remain competitive across increasingly dynamic grocery markets.
Accelerating Enterprise Pricing Automation
As grocery catalogs continue expanding, manually monitoring thousands of products across multiple retailer websites becomes increasingly impractical. Automation enables organizations to collect pricing data continuously, ensuring timely insights for pricing optimization, promotional planning, and market analysis. Scalable automation also reduces operational costs while improving data consistency and reporting accuracy.
Businesses that automate grocery price comparison across retailer websites gain continuous visibility into changing market conditions without relying on time-consuming manual research. Automated workflows can capture price updates, promotional offers, product availability, and assortment changes several times a day, enabling near real-time competitive intelligence. These capabilities support dynamic pricing strategies, faster business decisions, and more effective category management.
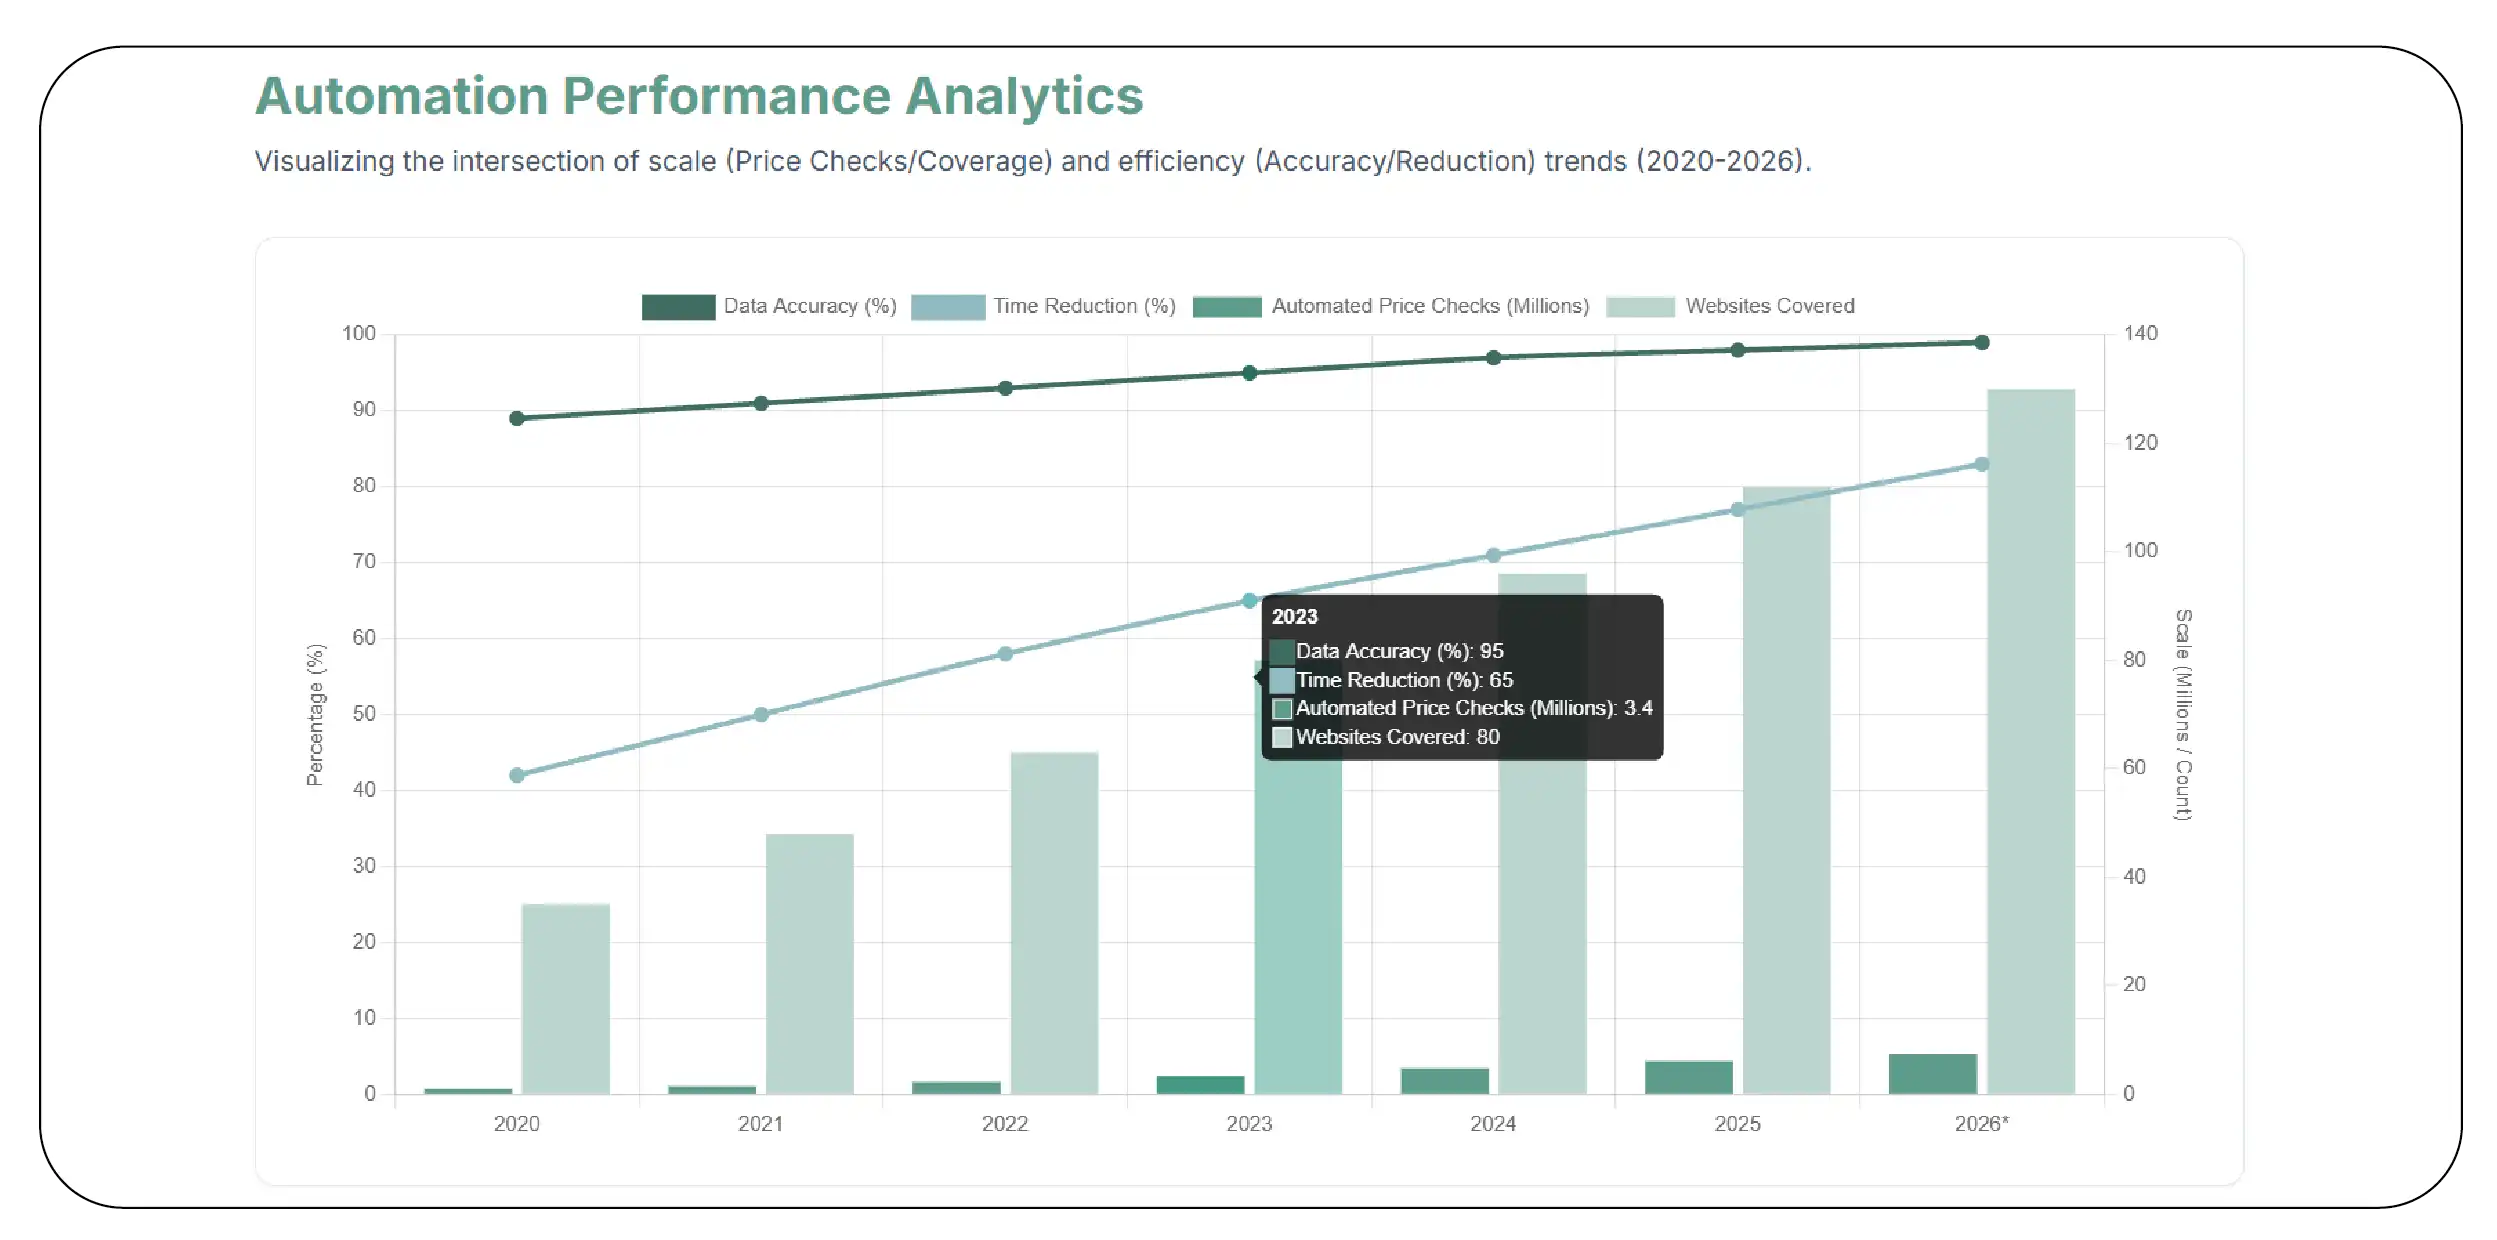
Grocery Price Automation Trends (2020–2026)
| Year |
Automated Price Checks |
Websites Covered |
Data Accuracy |
Processing Time Reduction |
| 2020 |
950,000 |
35 |
89% |
42% |
| 2021 |
1.5 Million |
48 |
91% |
50% |
| 2022 |
2.3 Million |
63 |
93% |
58% |
| 2023 |
3.4 Million |
80 |
95% |
65% |
| 2024 |
4.8 Million |
96 |
97% |
71% |
| 2025 |
6.1 Million |
112 |
98% |
77% |
| 2026* |
7.5 Million |
130 |
99% |
83% |
*Projected estimates.
Automated grocery pricing intelligence empowers retailers, CPG brands, and market research firms to react quickly to pricing fluctuations and competitive activity. By integrating automated data collection into business workflows, organizations improve operational efficiency, enhance forecasting accuracy, and strengthen decision-making across merchandising, marketing, and supply chain operations. As the grocery industry becomes increasingly data-driven, automation serves as the foundation for sustainable competitive advantage.
Driving Smarter Decisions with Continuous Market Intelligence
Maintaining visibility into grocery price fluctuations is critical for retailers, brands, and market analysts operating in today's competitive landscape. Consumer demand, inflation, promotional campaigns, and supply chain disruptions can influence prices multiple times within a single day. Businesses require continuous monitoring to identify these changes early and make informed pricing, inventory, and merchandising decisions.
Implementing US grocery price tracking enables organizations to monitor real-time pricing movements across major supermarket chains, identify regional price differences, and evaluate promotional effectiveness. Continuous tracking also supports demand forecasting, margin optimization, competitive benchmarking, and category management. Instead of relying on periodic manual audits, automated monitoring provides timely insights that improve strategic planning and operational efficiency.
Grocery Price Tracking Trends (2020–2026)
| Year |
Daily Price Records Captured |
Retailers Monitored |
Pricing Accuracy |
Businesses Using Continuous Tracking |
| 2020 |
1.1 Million |
38 |
89% |
44% |
| 2021 |
1.8 Million |
50 |
91% |
52% |
| 2022 |
2.7 Million |
66 |
93% |
61% |
| 2023 |
3.9 Million |
82 |
95% |
70% |
| 2024 |
5.2 Million |
98 |
97% |
79% |
| 2025 |
6.6 Million |
116 |
98% |
87% |
| 2026* |
8.1 Million |
135 |
99% |
93% |
*Projected estimates.
Continuous price tracking empowers organizations to detect pricing anomalies, respond to competitor actions, and optimize promotional strategies faster than ever before. As digital grocery commerce continues to expand, organizations leveraging real-time pricing intelligence will be better positioned to enhance customer satisfaction, protect margins, and improve long-term business performance.
Why Choose Product Data Scrape?
Product Data Scrape delivers enterprise-grade Grocery data scraping solutions designed to help retailers, CPG brands, distributors, market research firms, and analytics providers transform raw online grocery information into actionable business intelligence. Our advanced scraping infrastructure captures accurate data from leading supermarket websites, including product prices, promotional offers, inventory availability, category hierarchies, product specifications, ratings, and assortment updates.
Backed by the insights presented in this US Grocery Price-Comparison Coverage Report 2026, our solutions empower businesses to monitor competitive pricing, benchmark retailer performance, analyze promotional effectiveness, and identify emerging market trends with confidence. We deliver structured, high-quality datasets in multiple formats through secure APIs, scheduled exports, and customized reporting workflows.
Our scalable platform supports real-time monitoring, automated updates, enterprise integration, and high data accuracy while complying with industry best practices. Whether your objective is pricing optimization, competitive intelligence, assortment analysis, demand forecasting, or retail media analytics, Product Data Scrape provides reliable, scalable, and cost-effective data solutions that enable faster decisions and measurable business growth.
Conclusion
The grocery retail industry is becoming increasingly data-driven, making reliable pricing intelligence an essential competitive asset. As demonstrated throughout this US Grocery Price-Comparison Coverage Report 2026, businesses that leverage automated market intelligence can better understand pricing trends, monitor competitor strategies, optimize promotions, improve assortment planning, and respond rapidly to changing consumer demand.
By combining advanced automation with Scraper as a Service, organizations gain continuous access to accurate, structured grocery data without the complexity of managing large-scale data collection infrastructure internally. This enables retailers, brands, and market researchers to focus on strategic decision-making while maintaining comprehensive visibility into the evolving grocery marketplace.
Ready to transform your grocery pricing strategy? Partner with Product Data Scrape today to access scalable Scraper as a Service solutions and unlock the full potential of the US Grocery Price-Comparison Coverage Report 2026 for smarter, faster, and data-driven business decisions!


.webp)


