
Introduction
The global activewear and sportswear industry has evolved into one of the most competitive and data-driven digital commerce ecosystems. Brands are no longer competing only on product quality or marketing campaigns—they are competing on pricing intelligence, personalization, and direct-to-consumer (D2C) digital performance. This research report on Gymshark.com vs Lululemon.com vs Nike D2C Data Scraping provides an in-depth analysis of how leading global brands such as Gymshark, Lululemon, Nike Online, and Adidas.com are leveraging digital commerce strategies to influence consumer behavior and optimize pricing models.
The rise of D2C channels has transformed how brands interact with customers. Instead of relying heavily on retail intermediaries, companies now control their own digital storefronts, allowing them to collect rich behavioral data and optimize product positioning. The GymsharkE-commerce Product Dataset plays a crucial role in understanding how Gen Z and millennial consumers interact with fitness apparel across markets like the USA, UK, and Australia. These datasets provide structured insights into product demand, pricing variations, seasonal spikes, and conversion trends.
Between 2020 and 2026, the global activewear market has witnessed strong growth fueled by fitness awareness, athleisure fashion trends, and the rise of social media-driven purchasing behavior. Brands like Gymshark have disrupted traditional retail models, while established giants like Nike and Adidas have strengthened their digital ecosystems. Meanwhile, Lululemon continues to dominate the premium performance-wear segment. This report explores how data scraping, analytics, and competitive intelligence are reshaping decision-making in the activewear industry.
Market Intelligence and Digital Transformation in Activewear
The activewear market is undergoing rapid digital transformation driven by advanced analytics and automation. Using E-Commerce D2C Activewear Market Intelligence, businesses can evaluate global demand patterns, pricing strategies, and competitive positioning across multiple regions. This intelligence becomes even more powerful when combined with Lululemon E-commerce Product Dataset, which provides deep insights into premium consumer behavior, and Web Scraping API Services, which enable scalable data extraction from global e-commerce platforms.
From 2020 to 2026, the activewear industry has experienced consistent double-digit growth. This expansion is driven by increasing health consciousness, rising gym culture, influencer marketing, and the widespread adoption of online shopping. Digital-first brands like Gymshark have leveraged influencer ecosystems, while Nike and Adidas have focused on omnichannel integration.
Market Growth Overview (2020–2026)
| Year |
Market Size (USD Billion) |
Growth Rate |
| 2020 |
155 |
8% |
| 2021 |
172 |
9% |
| 2022 |
210 |
10% |
| 2023 |
245 |
11% |
| 2024 |
280 |
12% |
| 2025 |
320 |
13% |
| 2026 |
360 (Projected) |
14% |
Nike continues to dominate global scale, Lululemon maintains leadership in premium pricing, and Gymshark shows the fastest growth in digital-native consumer engagement. Adidas remains strong in performance-driven categories but is gradually expanding its D2C footprint.
Competitive Scraping and Cross-Brand Performance Analysis
Competitive intelligence plays a key role in understanding how brands position themselves in the digital marketplace. Using Scrape Gymshark vs Lululemon vs Nike D2C data, businesses can analyze pricing strategies, discount behavior, and product lifecycle performance across multiple regions. Additionally, Nike E-commerce Product Dataset provides structured insights into Nike’s product ecosystem, enabling deeper benchmarking.
From 2020 to 2026, the competitive landscape has shifted significantly. While Nike remains the global leader in sportswear, Gymshark has rapidly gained traction among younger audiences due to its strong social media presence and influencer-led marketing strategy.
Brand Market Share Evolution
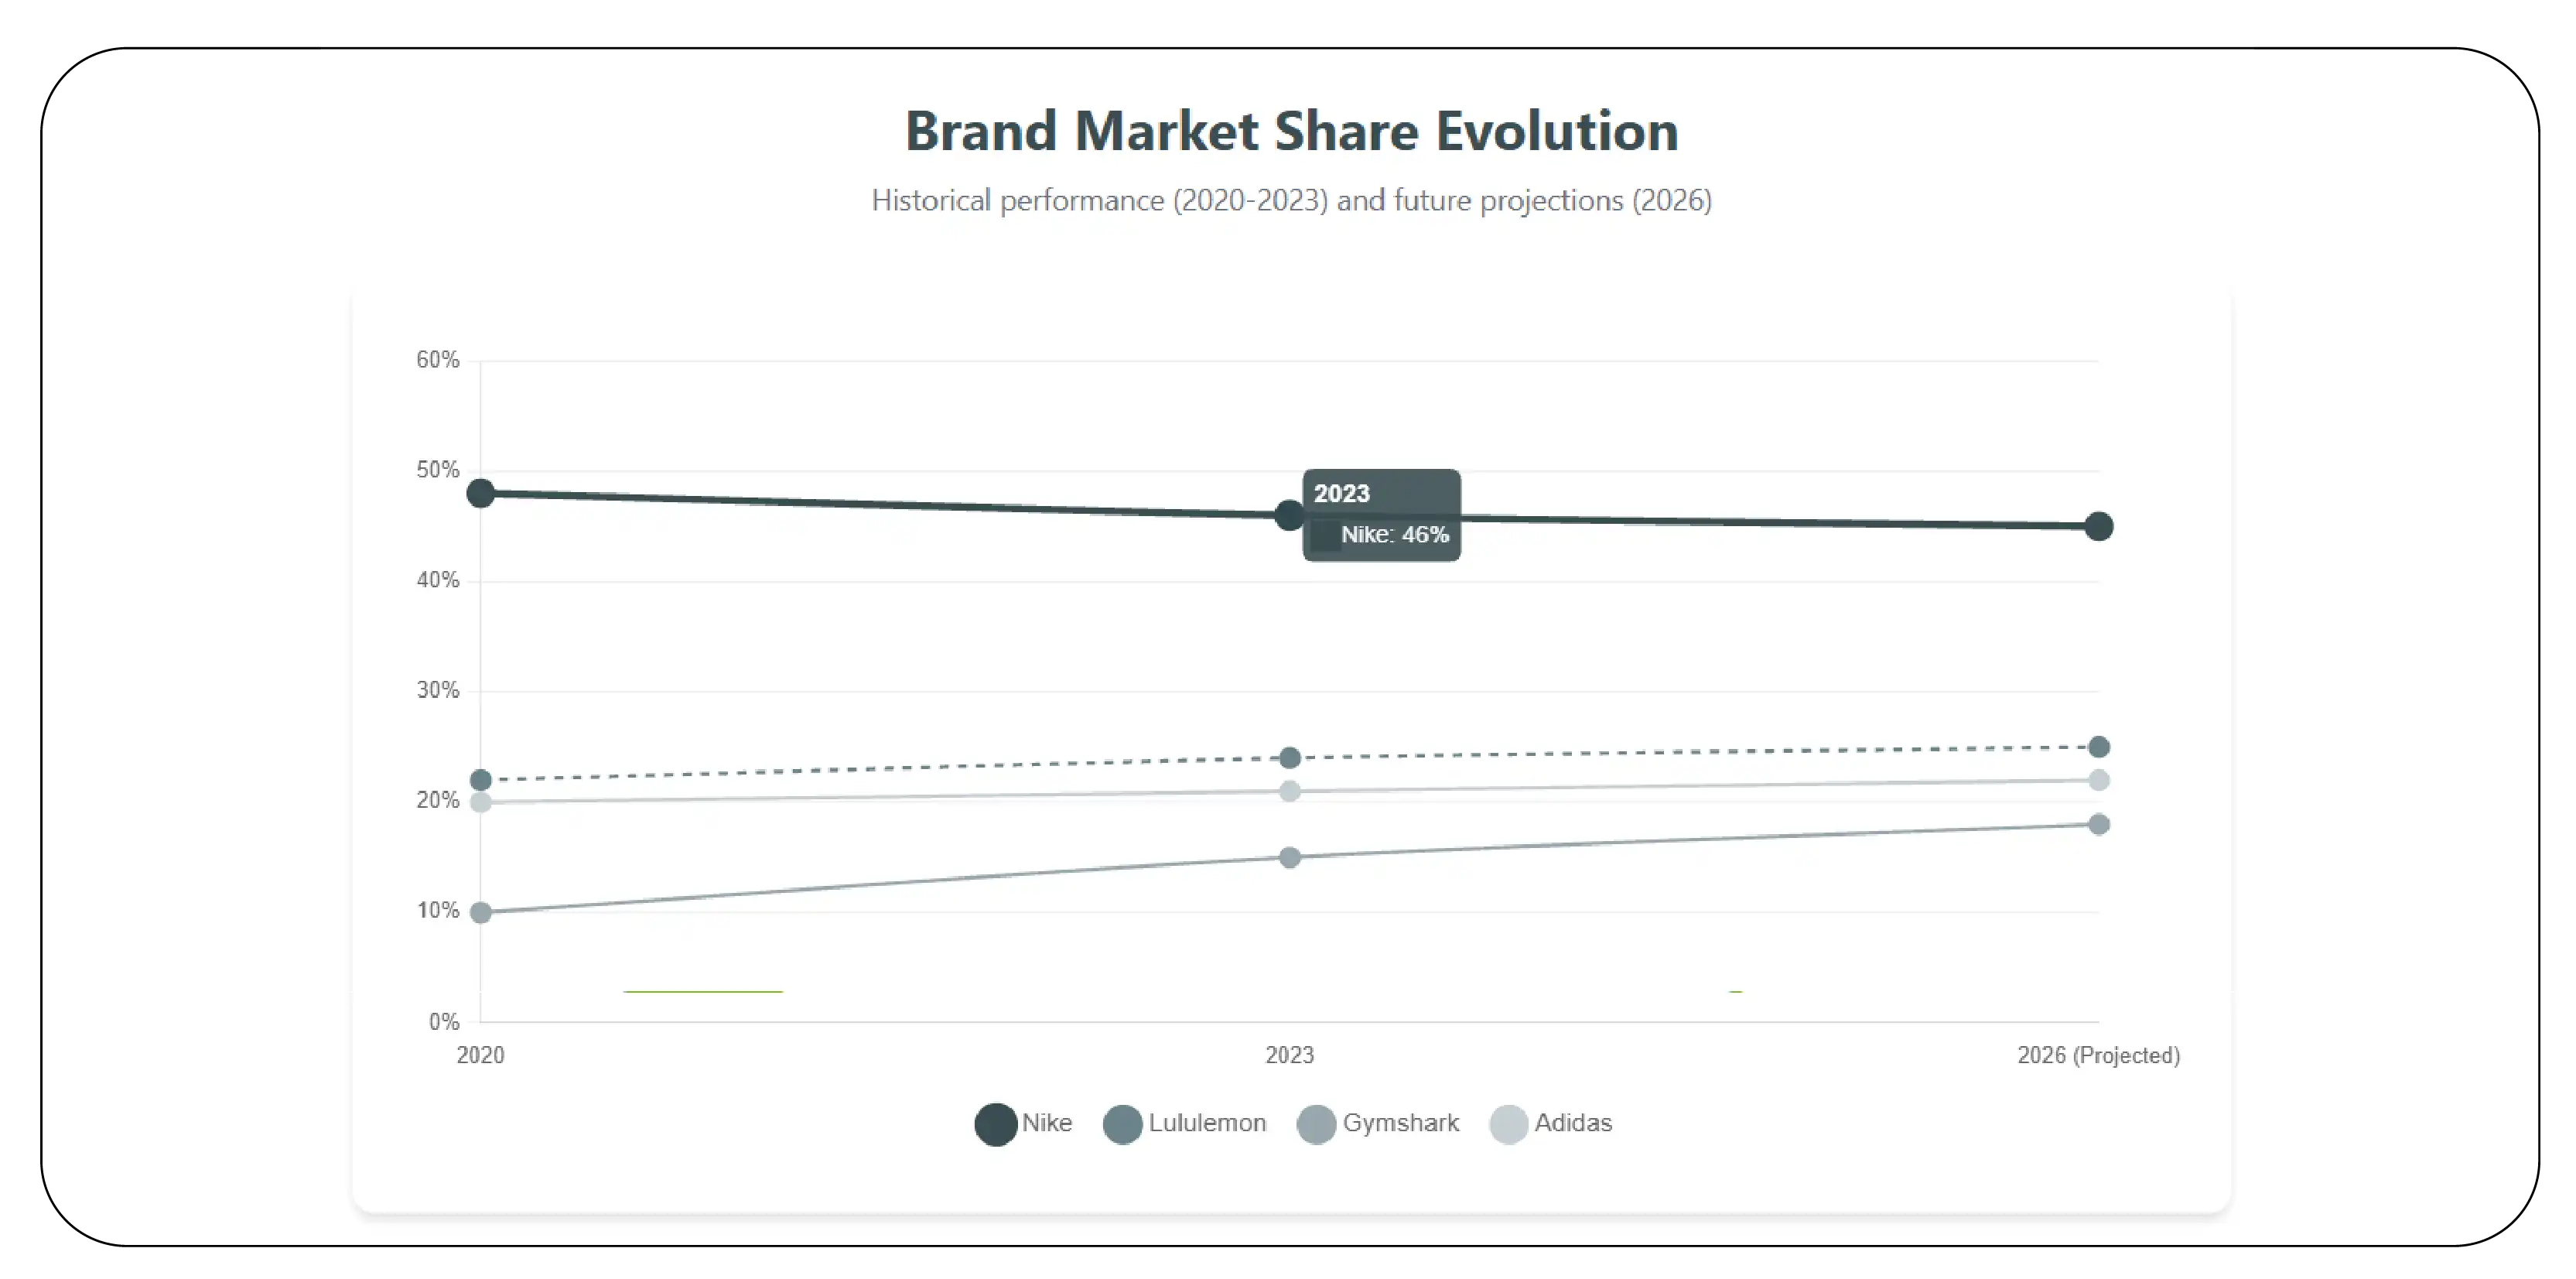
Nike continues to lead in global recognition, but Gymshark’s rapid digital expansion highlights the growing importance of D2C-native strategies.
Product-Level Insights and Apparel Performance
Understanding product-level performance is essential for optimizing inventory and marketing strategies. Using Gymshark vs Lululemon vs Nike ecommerce analysis, businesses can evaluate SKU performance across categories, while Extract Gymshark Fashion & Apparel Data enables detailed analysis of Gymshark’s product ecosystem.
From 2020 to 2026, leggings, sports bras, and training apparel have consistently dominated sales across all three brands.
Product Category Demand Trends
| Category |
Demand Growth |
| Leggings |
65% |
| Sports Bras |
55% |
| Hoodies |
50% |
| Training Wear |
60% |
| Running Gear |
45% |
Gymshark leads in youth-focused gym apparel, Lululemon dominates premium yoga and athleisure, and Nike maintains strong cross-category dominance across performance wear and lifestyle segments.
Gymshark Digital Growth and Consumer Behavior Insights
Gymshark’s growth is one of the most remarkable success stories in modern D2C retail. Using Gymshark ecommerce data intelligence, businesses can analyze engagement metrics, conversion funnels, and customer retention patterns. Combined with Extract Lululemon Fashion & Apparel Data, this enables comparative analysis between premium and fast-growing digital-first brands.
Between 2020 and 2026, Gymshark has significantly expanded its presence in the USA, UK, and Australia, driven by influencer marketing and community-driven branding strategies.
Regional Engagement Growth
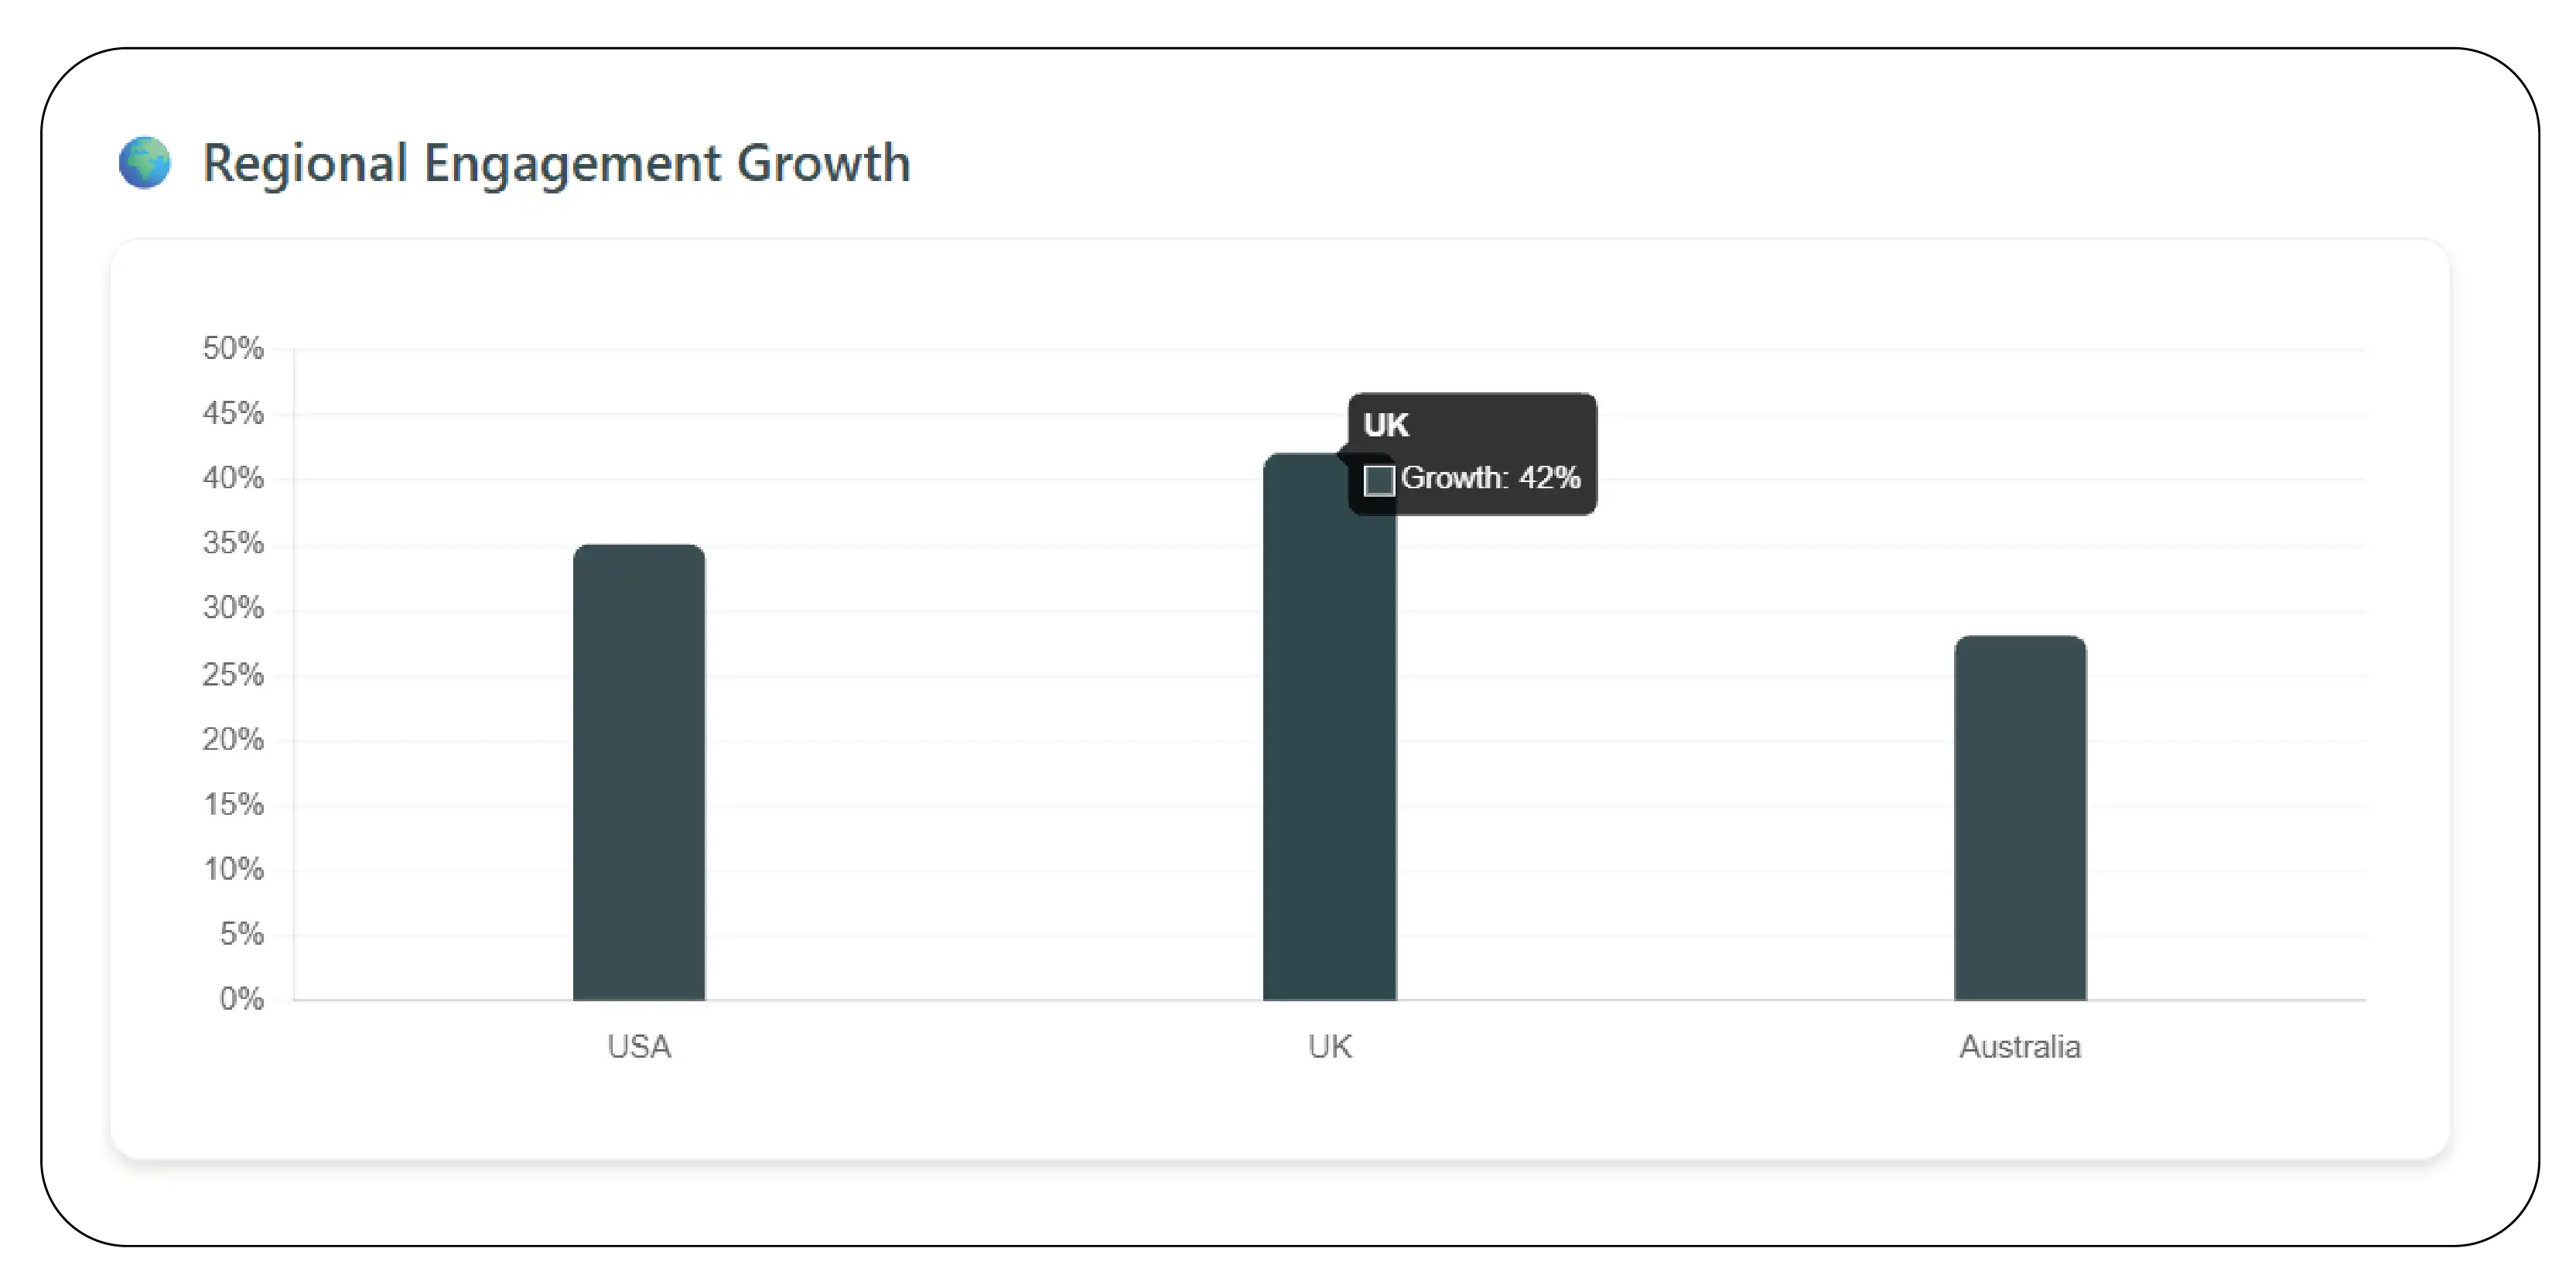
Gymshark’s direct engagement model allows it to outperform traditional brands in digital interaction metrics, even if its global scale remains smaller than Nike or Adidas.
Pricing Strategy and Competitive Benchmarking
Pricing is one of the most critical factors influencing consumer behavior in the activewear industry. Using Lululemon pricing analytics, businesses can evaluate premium pricing models, while Extract Nike Fashion & Apparel Data provides insights into global pricing consistency across regions.
From 2020 to 2026, activewear prices have increased by 15–25% due to inflation, supply chain costs, and brand premiumization strategies.
Average Product Pricing Comparison (USD)
| Product Type |
Nike |
Lululemon |
Gymshark |
| Leggings |
$85 |
$110 |
$65 |
| Hoodies |
$90 |
$120 |
$70 |
| Sports Bras |
$55 |
$75 |
$45 |
| Shorts |
$50 |
$68 |
$40 |
Lululemon maintains the highest premium positioning, Nike balances performance and brand value, while Gymshark focuses on affordability and accessibility for younger consumers.
Nike Ecommerce Benchmarking and Market Leadership
Nike continues to lead the global activewear industry through strong brand equity, innovation, and digital transformation. Using Nike ecommerce benchmarking, businesses can evaluate product performance across global markets, while Ecommerce Website Data Scraping provides structured insights into competitor pricing and product availability. Combined with Price Monitoring, brands can respond dynamically to market fluctuations.
From 2020 to 2026, Nike has strengthened its D2C channel significantly, contributing to nearly half of its total revenue.
D2C Growth Contribution
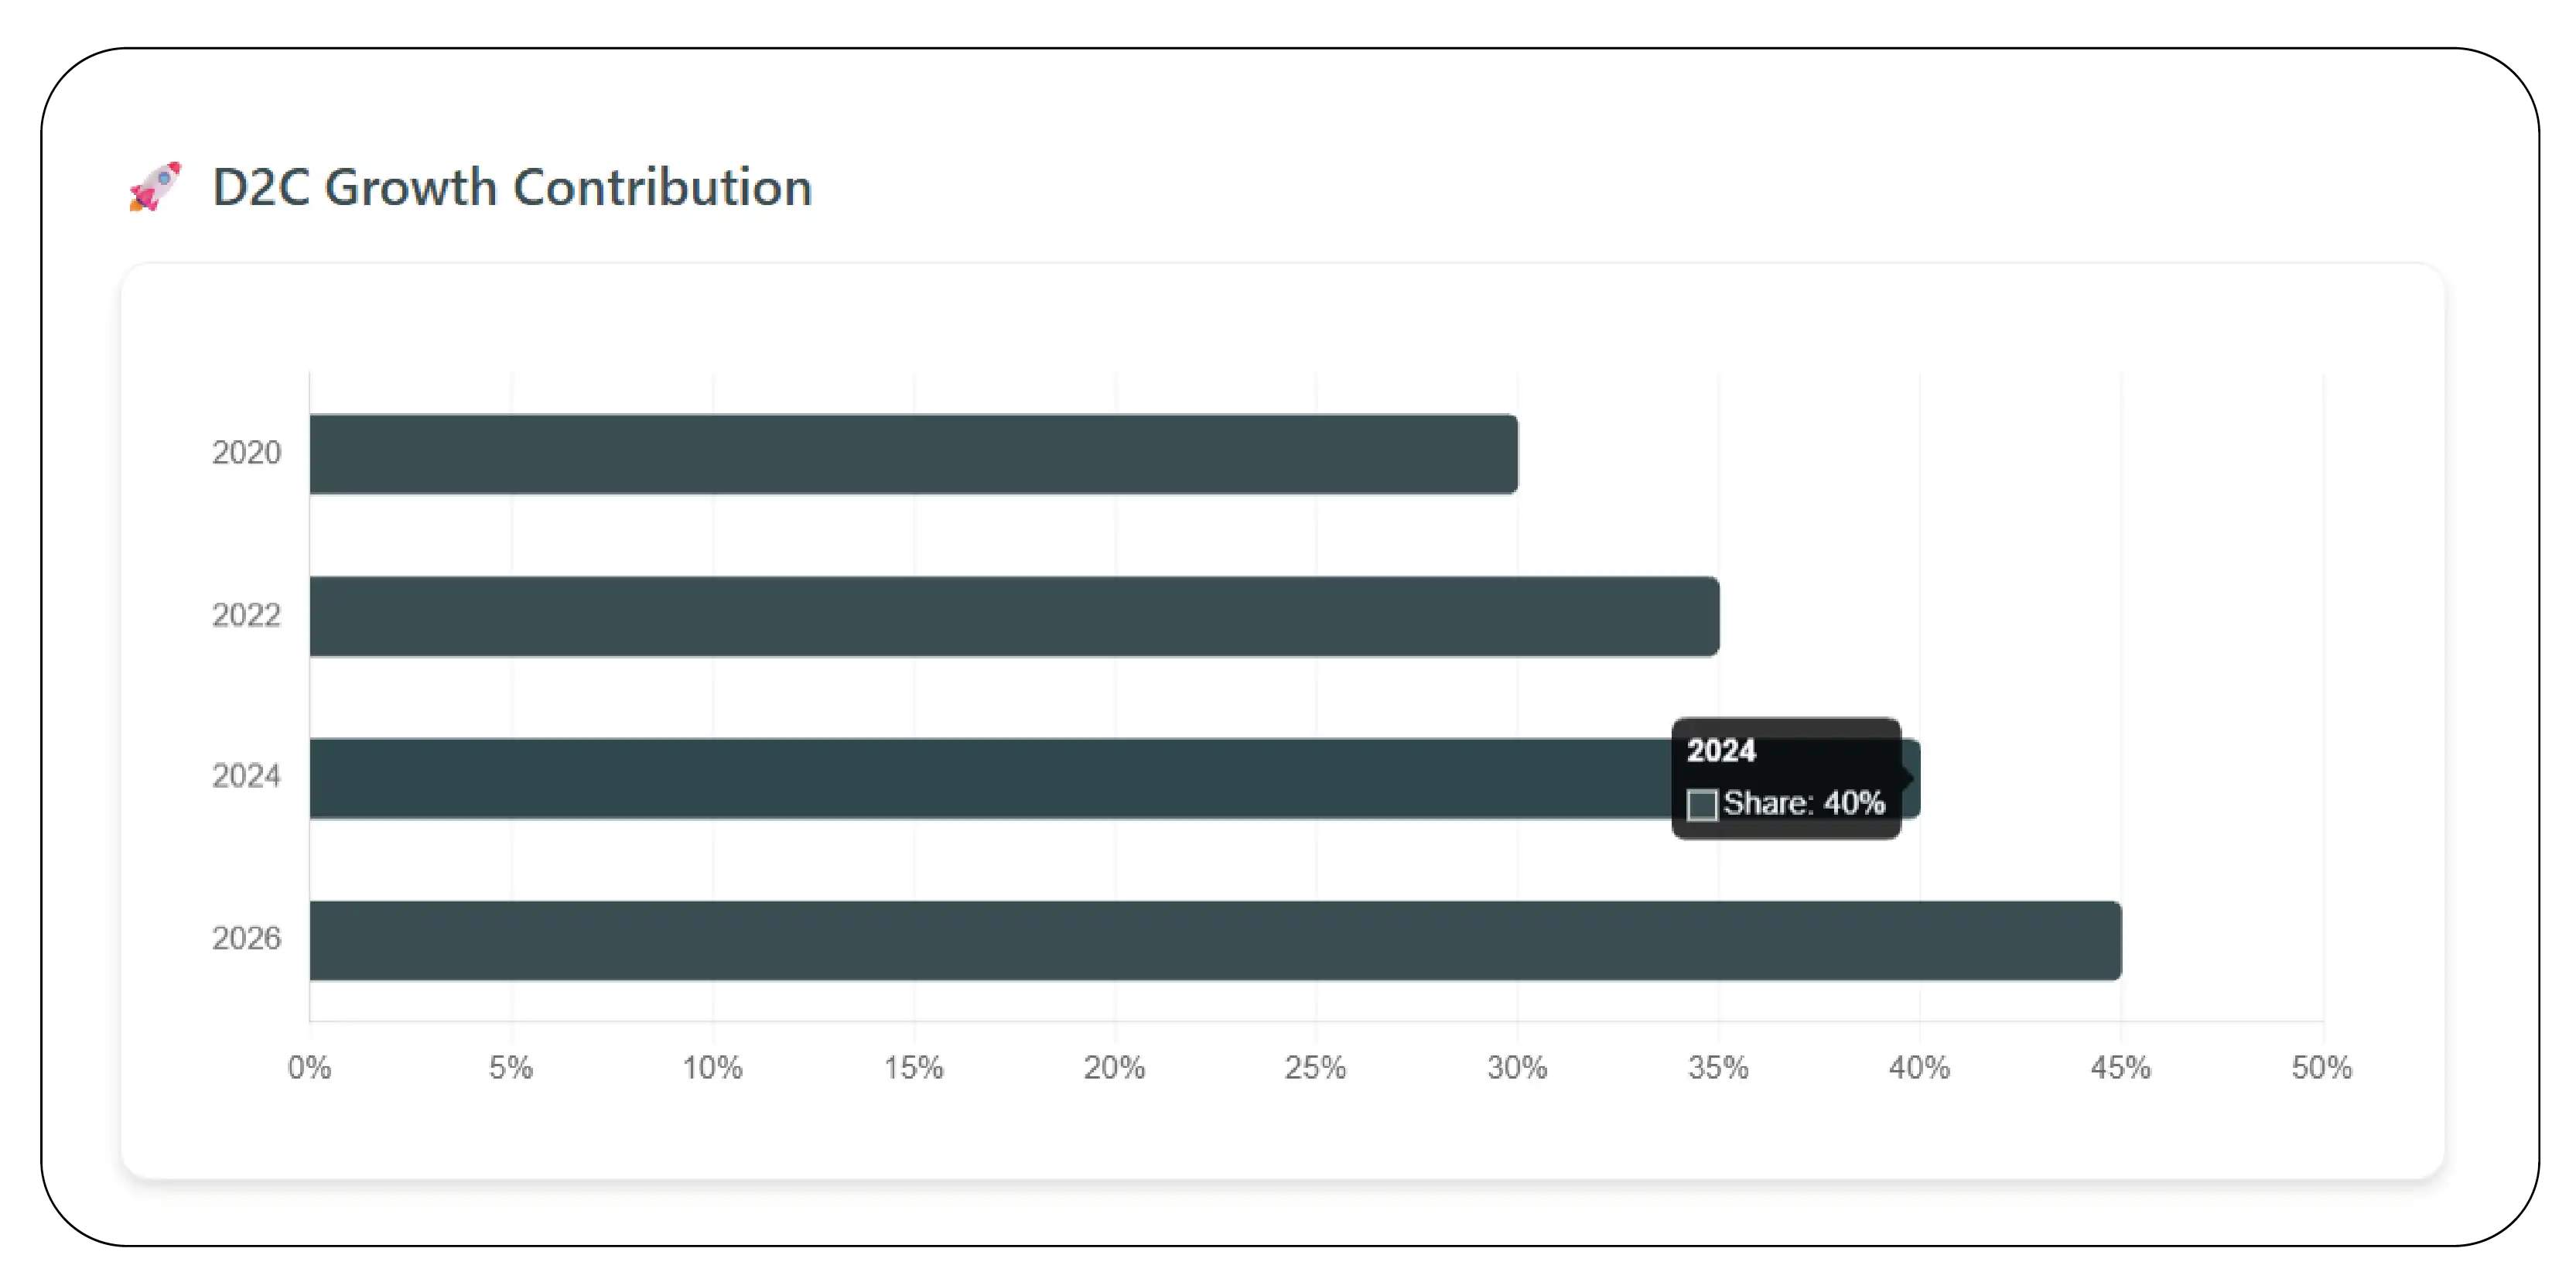
Nike’s strength lies in its global scale, strong product innovation pipeline, and advanced personalization strategies.
Why Choose Product Data Scrape?
Product Data Scrape is a leading provider of advanced data intelligence solutions for the fashion and activewear industry. We specialize in pricing and promotion analysis activewear brands, enabling businesses to track competitor pricing, monitor product performance, and optimize marketing strategies across global e-commerce platforms.
Our solutions help businesses extract structured insights from large-scale datasets, improve decision-making, and enhance competitive positioning in highly dynamic markets. With expertise in real-time data scraping and analytics, we support brands in building scalable digital intelligence systems.
We also provide Extract Fashion & Apparel Data solutions that empower businesses to understand customer behavior, optimize inventory planning, and enhance revenue performance.
Conclusion
The activewear industry is rapidly evolving into a highly competitive digital ecosystem where data intelligence determines market leadership. Through D2C activewear ecommerce competitive analysis Report, businesses can understand how Gymshark, Lululemon, Nike Online, and Adidas.com compete across pricing, product strategy, and consumer engagement.
The integration of E-commerce Product Dataset into business intelligence systems enables brands to gain deeper insights into customer behavior, optimize pricing strategies, and improve product performance across regions.
Product Data Scrape empowers businesses with advanced data-driven solutions to transform raw e-commerce data into actionable insights for growth, efficiency, and competitive advantage. Connect with us today to elevate your digital commerce strategy!
You can also reach us for all your mobile app scraping, data collection, web scraping, and instant data scraper service requirements!


.webp)


