Quick Overview
Retailers need consistent product information to evaluate assortment, compare prices, and identify gaps in competitive grocery markets. This case study outlines how Product Data Scrape can structure product observations from Walmart and Whole Foods Market for retail research. The proposed workflow focuses on product identification, price monitoring, availability observations, and historical comparisons to support Pricing intelligence. Retailer information confirms that product selection, prices, and availability can vary by location and purchasing channel. No named client, project duration, or verified performance results have been provided for this engagement. Therefore, Product Data collection from Walmart & Wholefoods is presented as a data research approach, with success measured through documented data-quality and coverage metrics.
Client Name / Industry: Client identity not publicly verified; grocery and grocery retail analytics.
Service / Duration: Product data collection and assortment analysis; project duration not disclosed.
Key Impact Metrics: Product coverage, valid-record rate, and weekly price-change detection. No client-specific results have been verified.
The Client
Grocery retail operates across multiple product categories, brands, pack sizes, and purchasing channels. For an grocery business, maintaining an accurate understanding of available products can support category planning, competitive research, and assortment decisions.
Walmart provides online grocery shopping through its website, with product details and local fulfilment options dependent on location and inventory. Its official guidance explains that customers can browse food categories, compare product sizes, and select location-specific pickup or delivery options. Source: Walmart Food.
Whole Foods Market also offers an online product catalogue, including categories such as produce, dairy and eggs, meat, prepared foods, pantry essentials, frozen foods, and beverages. Its official website states that prices and availability may vary by location and can change without notice. Source: Whole Foods Market product catalogue.
For an grocery research team, these differences create a need to distinguish between comparable products, channels, and locations. A product available online may not necessarily be available at a selected physical store, and online prices may differ from in-store prices.
A structured Walmart Whole Foods Grocery Data Extraction workflow can organise accessible product information into consistent records. This supports Assortment analytics by allowing researchers to examine product categories, brand representation, pack sizes, and observed availability.
The actual client's existing processes, internal challenges, and reasons for commissioning the service have not been publicly verified. Accordingly, this section describes the relevant retail market context rather than attributing undocumented problems to a specific business.
Goals & Objectives
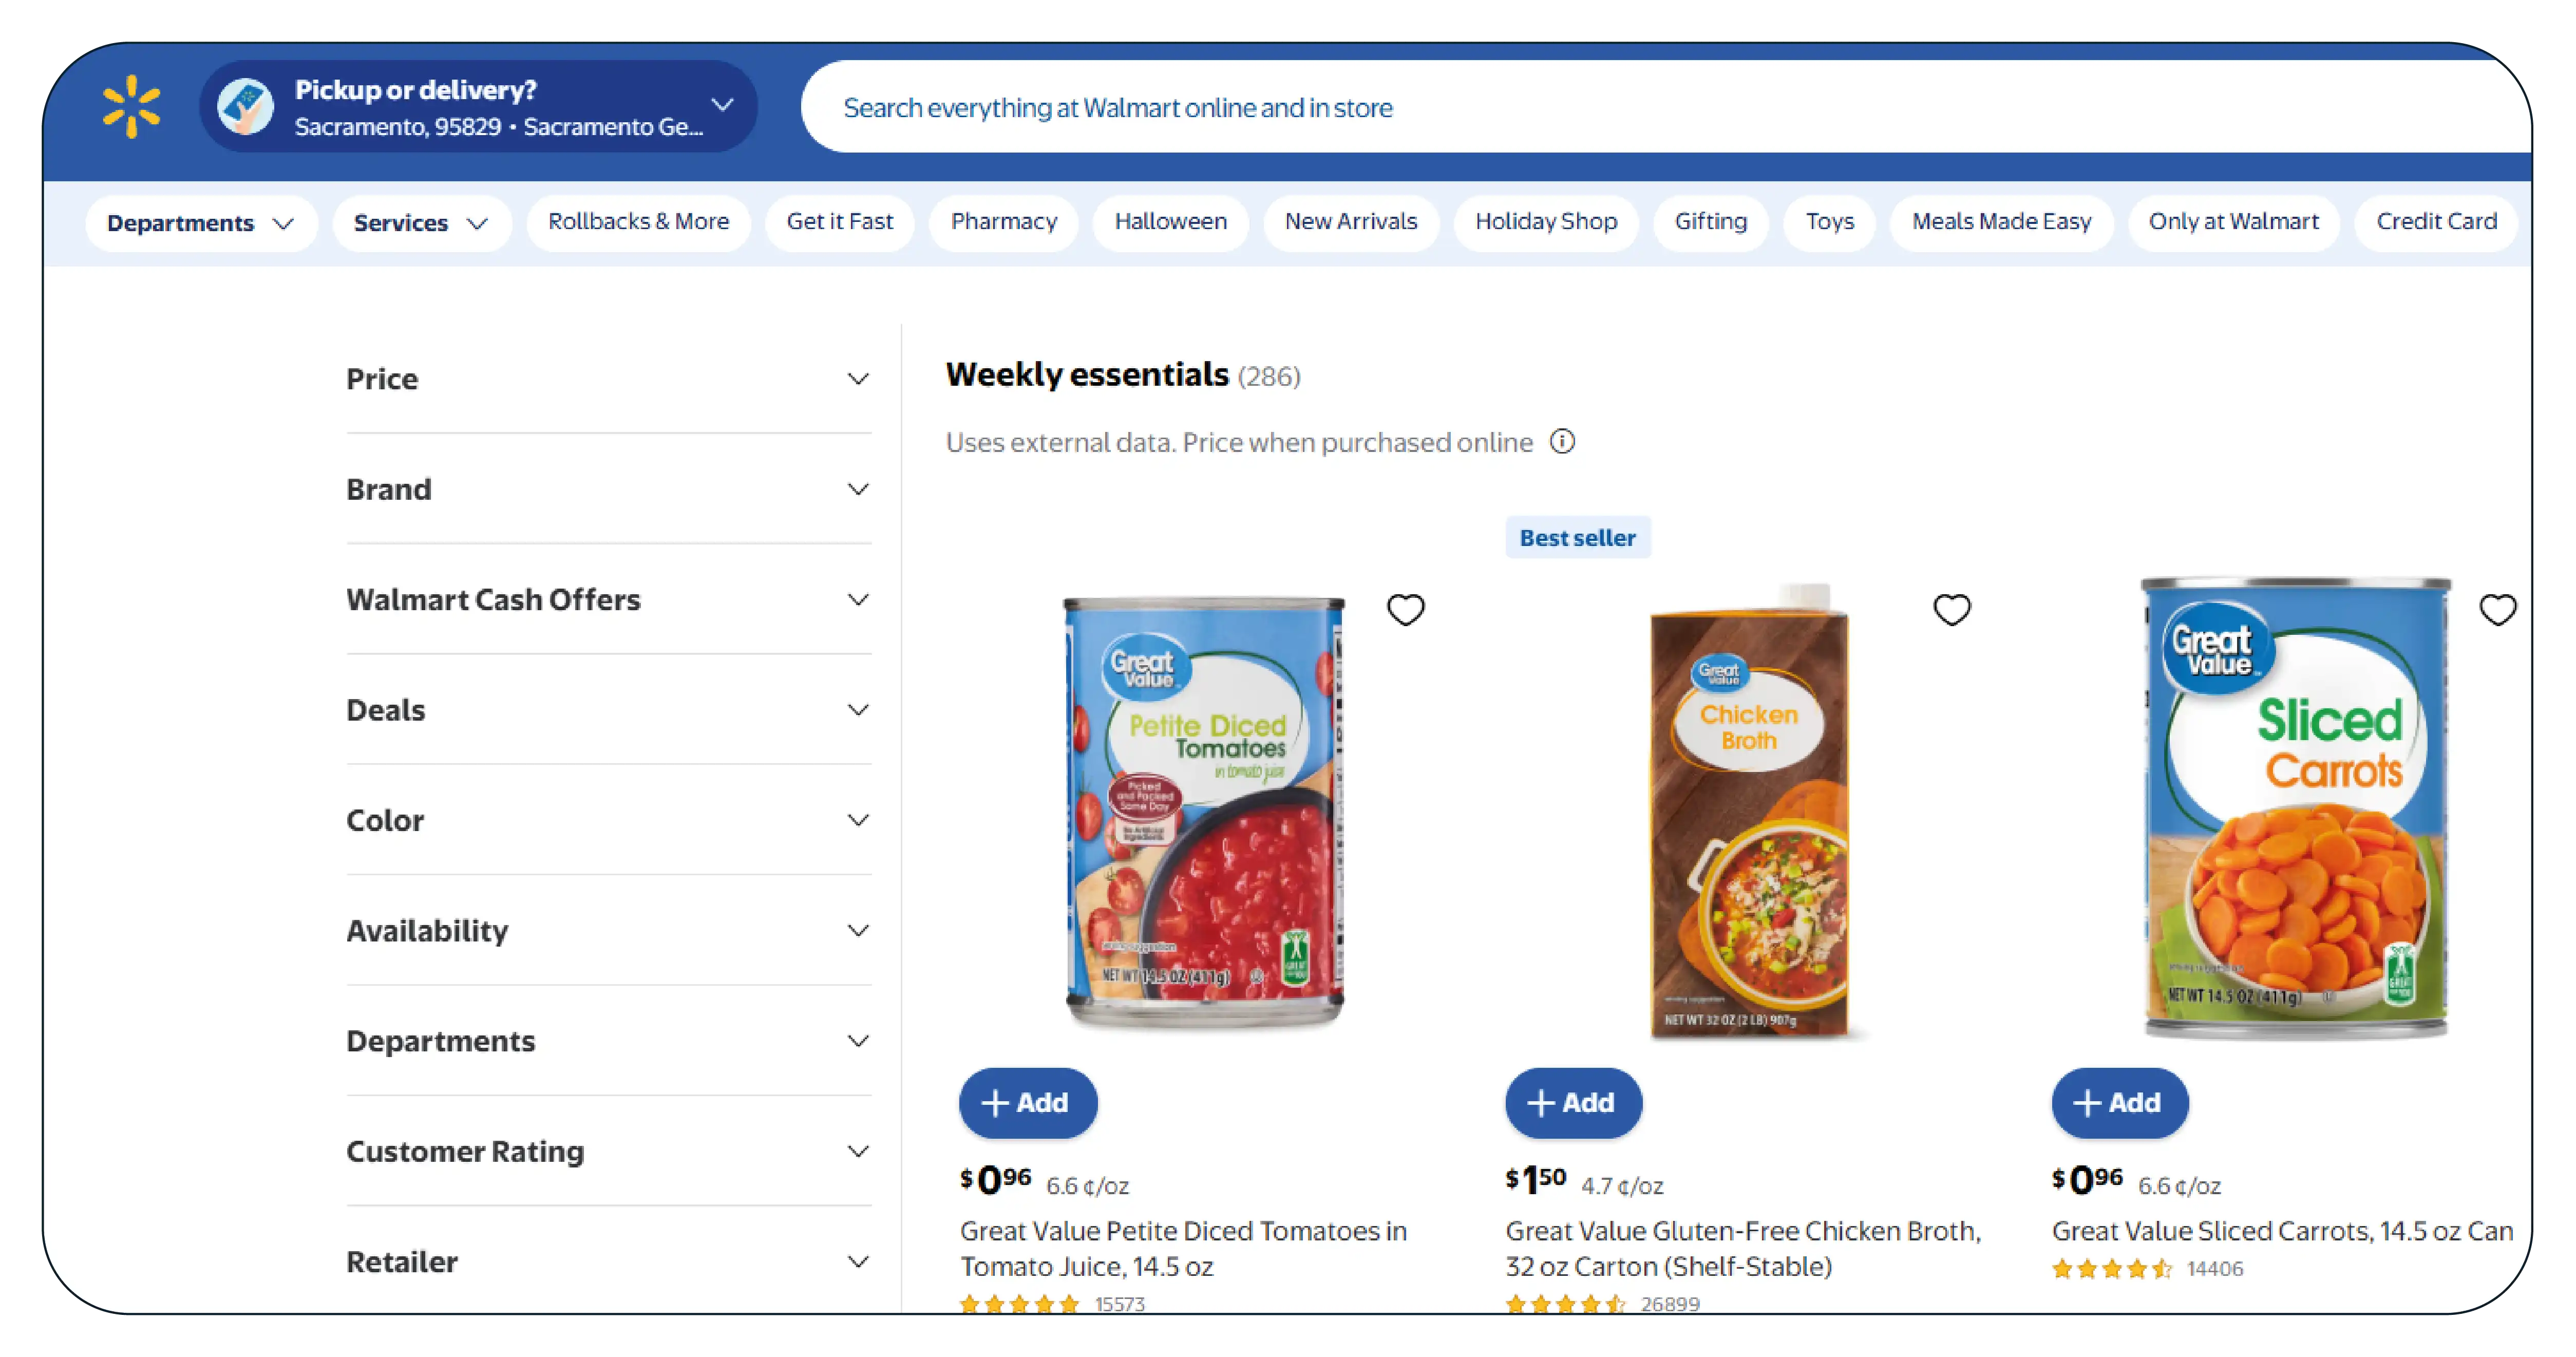
The primary goal is to establish a consistent product-level view of selected grocery categories across Walmart and Whole Foods Market. The research should help analysts understand assortment differences and compare equivalent products without confusing variations in brand, size, flavour, or packaging.
A second goal is to make product observations reusable across reporting periods. Historical records can help analysts identify changes in listings, displayed prices, and availability without relying solely on isolated snapshots.
The technical workflow should prioritise repeatability, accuracy, and integration with existing reporting systems.
Establish a clearly defined product list with identifiers, brand names, variants, and source URLs.
Collect accessible product attributes and displayed prices on a consistent schedule.
Standardise units, currencies, timestamps, and product identifiers.
Store historical snapshots rather than overwriting earlier observations.
Validate records and flag missing fields, duplicates, and unexpected changes.
Integrate accepted records into a database, spreadsheet, or analytics dashboard.
Provide reporting that distinguishes online observations from store-specific information.
Extract Whole Foods Product Data should follow the same product-matching and validation principles used for other tracked sources. The collection schedule can be adjusted to the business's reporting needs and the availability of permitted data access.
Success should be assessed against a documented baseline, using measurable indicators rather than unsupported improvement claims.
Product coverage: Percentage of the approved product list successfully observed.
Valid-record rate: Percentage of collected records that pass data-quality checks.
Price-change detection: Number of tracked products with validated changes between observations.
Field completeness: Percentage of records containing all required attributes.
Reporting timeliness: Percentage of scheduled collections completed within the agreed reporting window.
These measures provide a consistent way to evaluate whether Product Data collection from Walmart & Wholefoods meets the business's defined requirements.
The Core Challenge
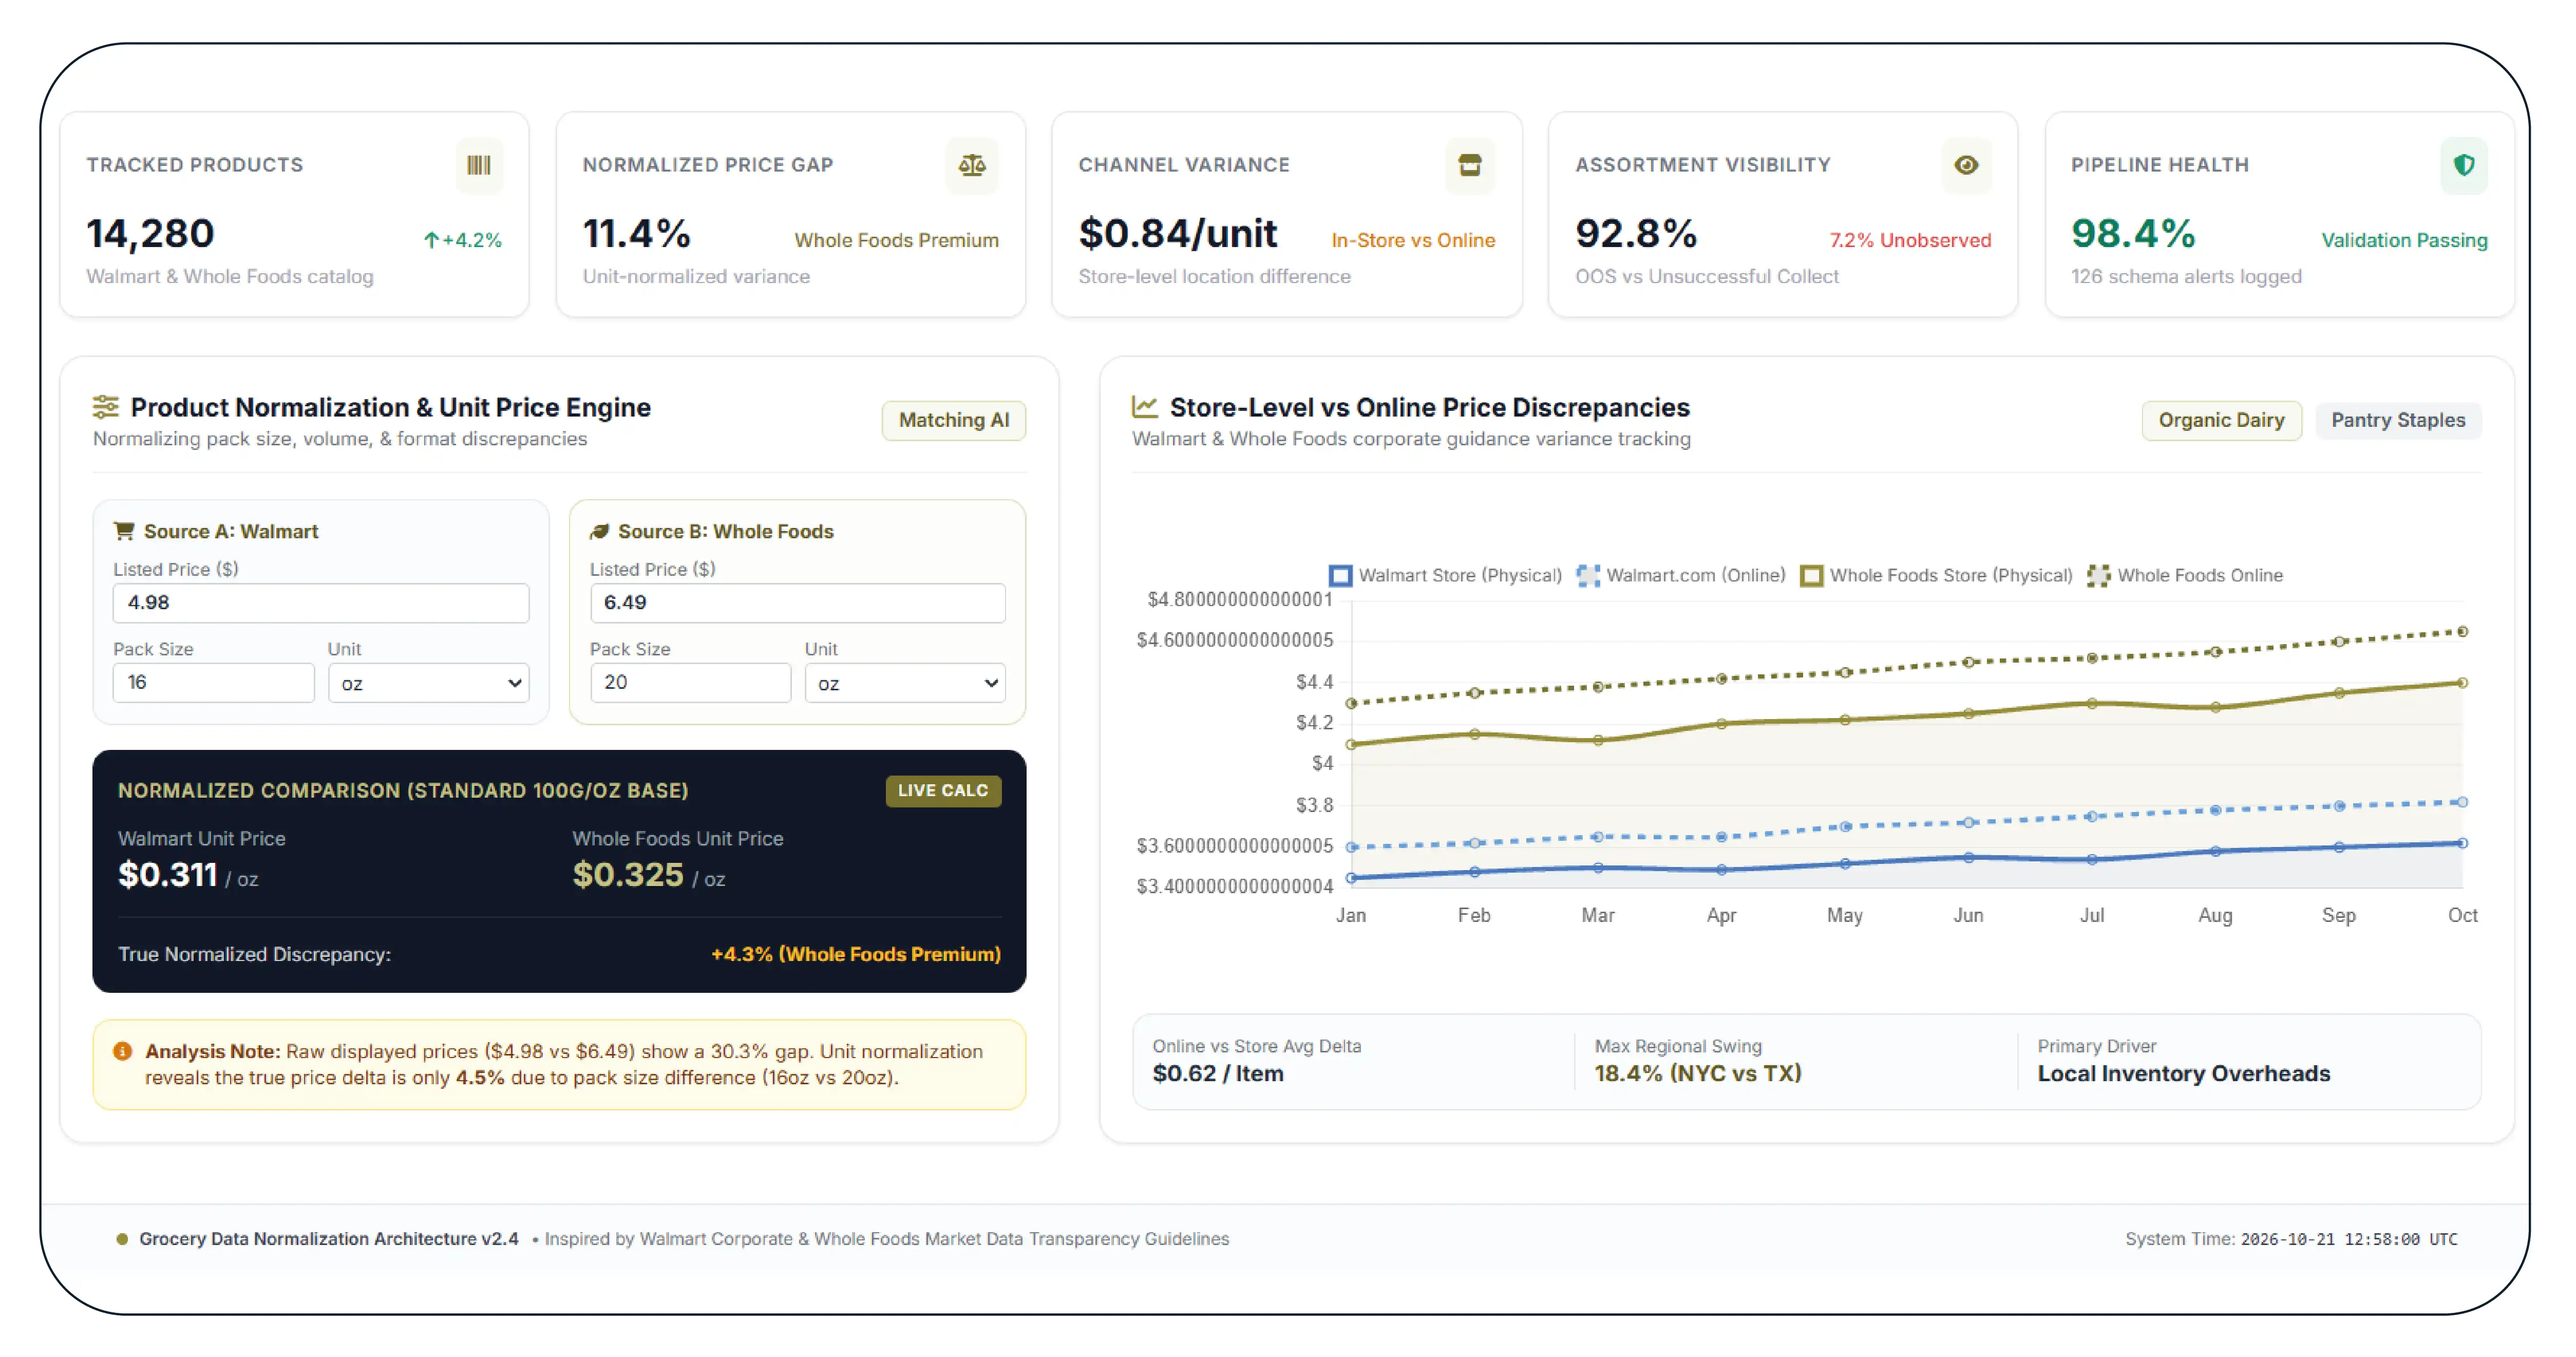
Grocery product analysis can become unreliable when product information is collected from different retail sources without a consistent data structure.
The first challenge is product matching. Two listings may represent the same brand but differ in pack size, quantity, flavour, or product format. Comparing their displayed prices without normalising these differences can lead to misleading conclusions.
The second challenge is changing prices. Walmart explains that store prices can differ because individual stores manage their own inventory and local pricing. Its guidance also distinguishes online merchandise and pricing from what is available in physical stores. Source: Walmart corporate FAQs.
Whole Foods Market similarly states that online prices may differ from in-store prices and that product availability can vary by location. Source: Whole Foods Market terms.
A third challenge is assortment visibility. A missing listing, unavailable item, or unsuccessful collection does not automatically mean a product has been discontinued. Analysts must preserve the distinction between confirmed observations and incomplete information.
A Scrape Whole Foods Grocery Pricing Data workflow should therefore capture the displayed price, product identity, source, timestamp, and relevant location information whenever accessible. Records should also indicate whether a field was unavailable or failed validation.
Other technical risks include duplicate listings, changing page structures, inconsistent units, and incomplete collection runs. These issues can affect downstream analysis if not identified early.
The solution is to combine controlled product matching, data validation, historical storage, and transparent exception reporting. Walmart Whole Foods SKU Stock Tracking can help organise product-level availability observations and support consistent comparisons over time. This creates a stronger foundation for research without assuming that every listing or location can be observed continuously.
Our Solution
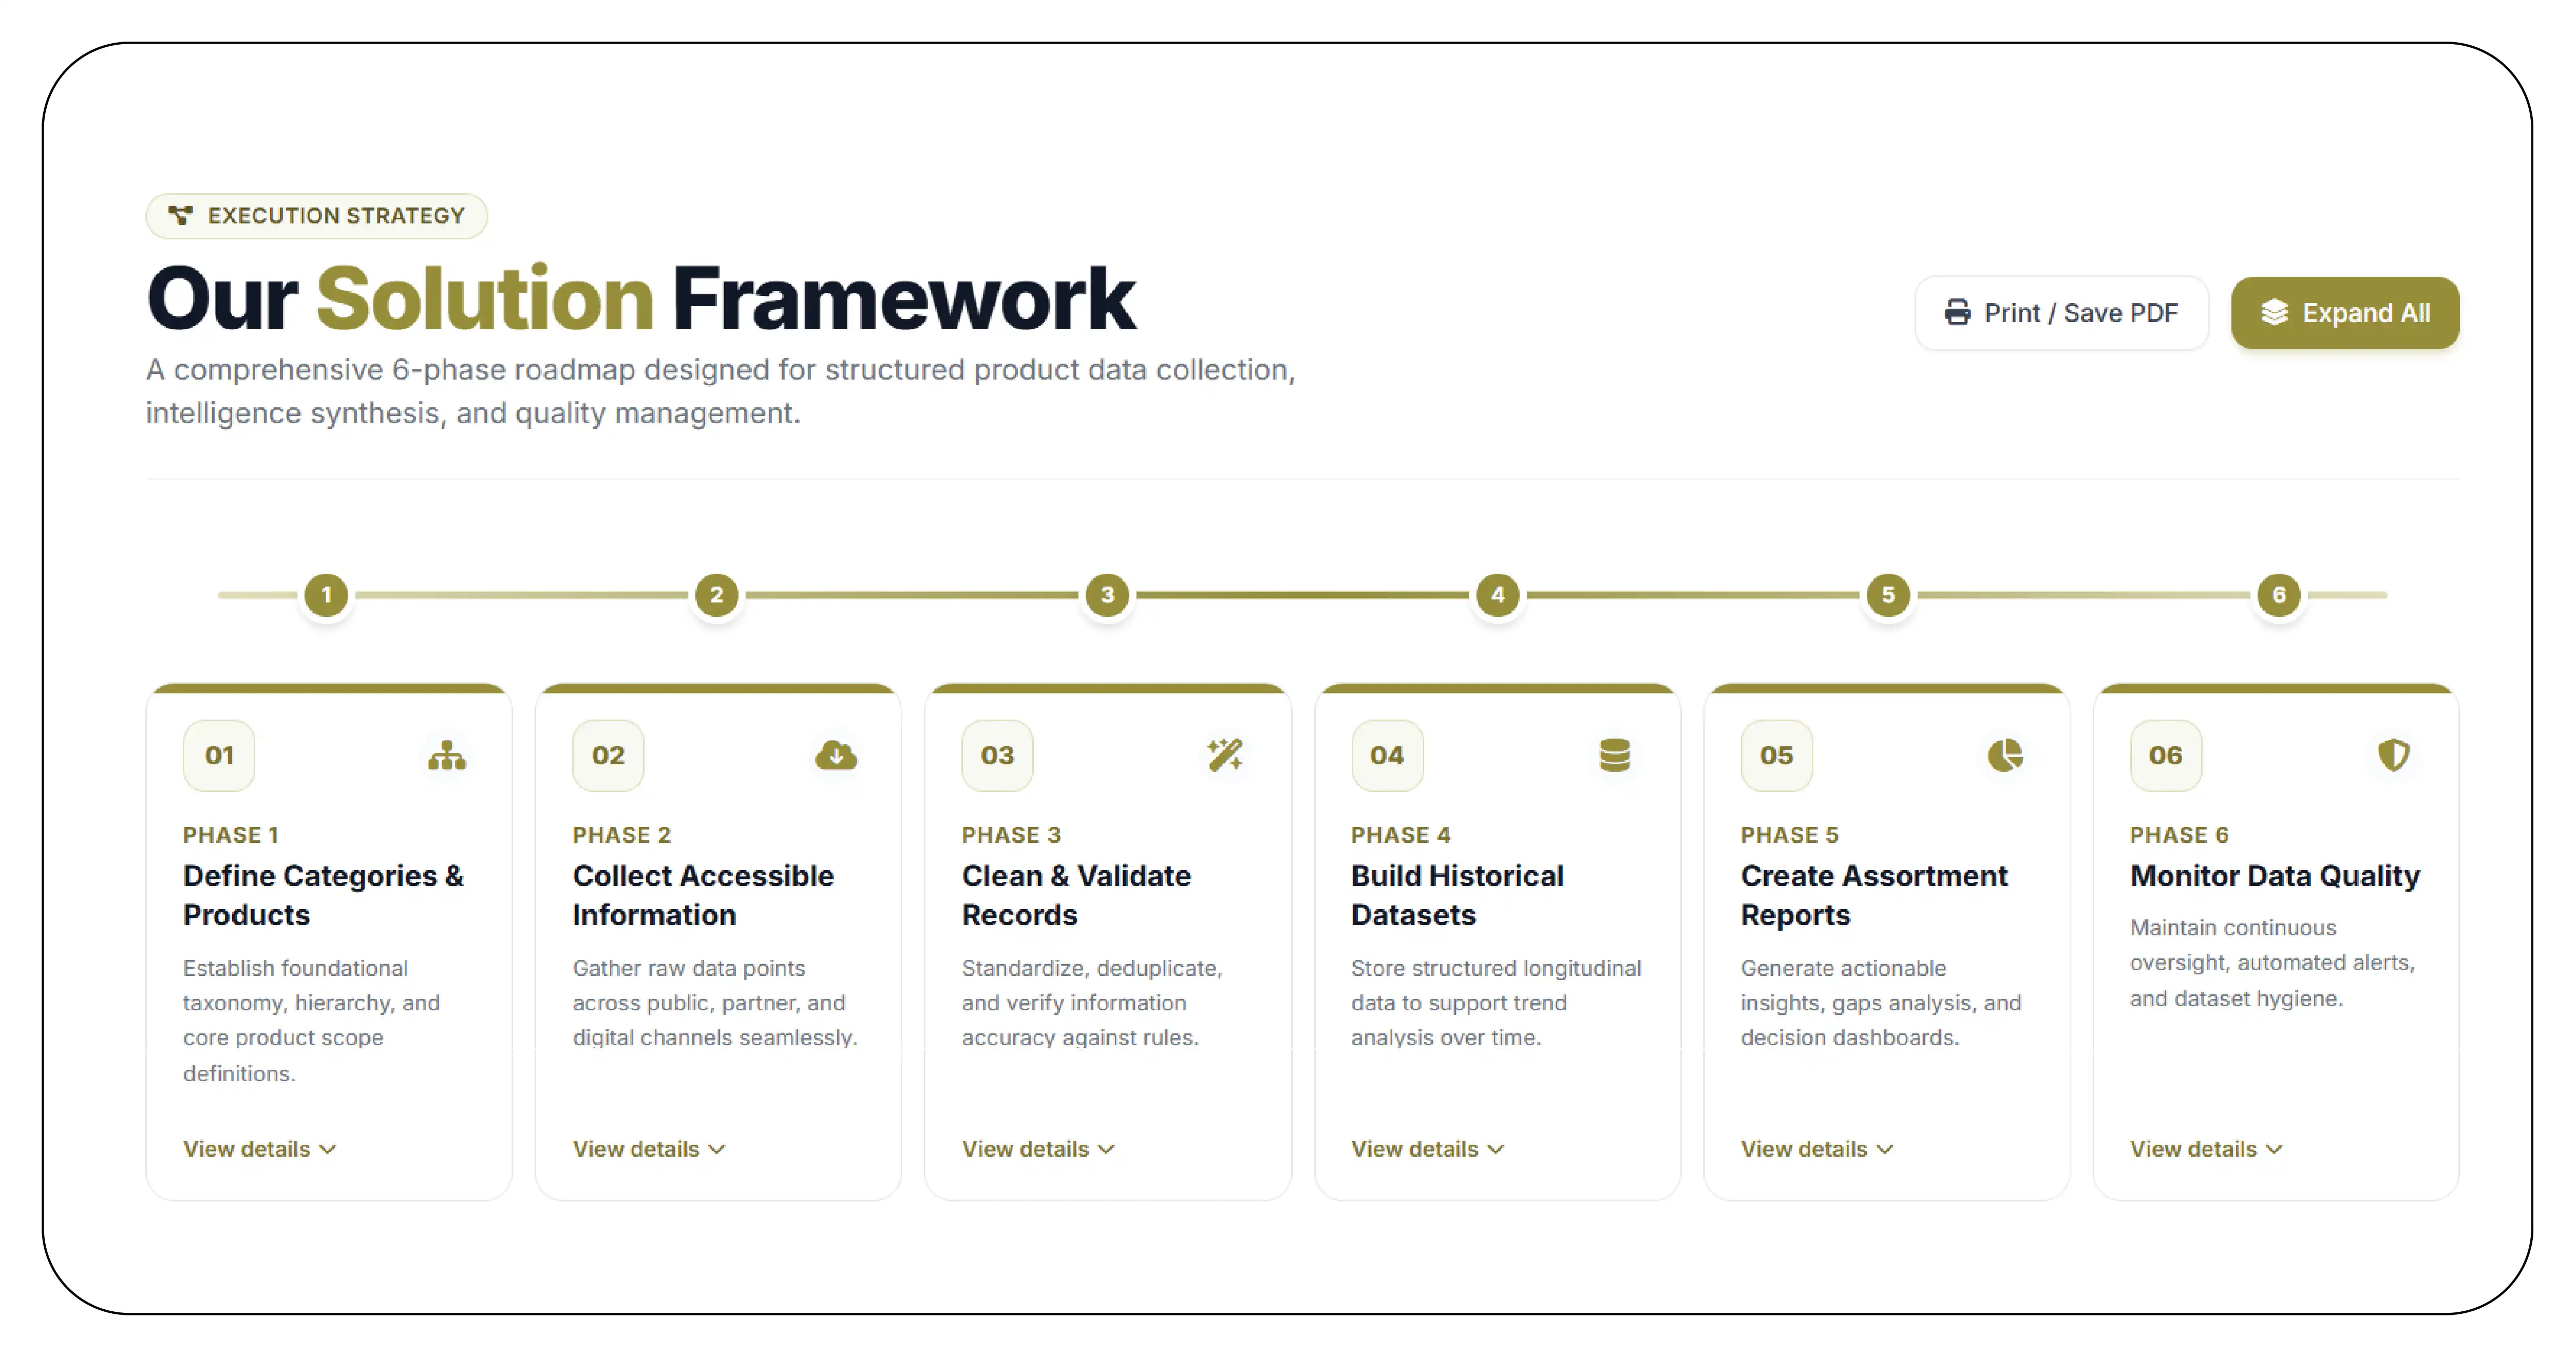
Product Data Scrape can organise the proposed workflow into phases that support consistent grocery product research. The process below describes an implementation framework, not a verified record of completed work for a named client.
Phase 1: Define categories and products
Start by identifying the product categories relevant to the business. These might include dairy, packaged foods, beverages, snacks, produce, and pantry essentials, all of which appear in Whole Foods Market's published category catalogue. Create a tracking list containing available product identifiers, brand names, descriptions, pack sizes, and source URLs. Record the retailer and selected location or channel so that comparisons remain traceable.
Phase 2: Collect accessible product information
The Walmart Whole Foods Market Intelligence Data workflow should collect only the fields that are accessible through approved methods. Depending on the source, these may include product titles, brands, pack sizes, displayed prices, categories, product URLs, and availability observations. The collection schedule should be defined according to reporting requirements. Weekly snapshots are useful for periodic comparisons, but they should not be described as continuous or real-time monitoring.
Phase 3: Clean and validate records
Standardise units, currency formats, timestamps, and product identifiers. Apply matching rules to distinguish equivalent products from similar but non-identical variants. Flag records with missing prices, duplicate identifiers, unexpected unit changes, or incomplete descriptions. Where a price is shown per unit of weight, preserve the original unit and normalise it only when the underlying quantity supports a valid comparison.
Phase 4: Build historical datasets
Store each accepted observation as a dated record. Preserve previous snapshots so analysts can compare changes in prices, product descriptions, and observed availability over time. Use a consistent schema for both retailers while retaining the original source fields. This enables cross-retailer analysis without erasing meaningful differences in how each platform presents products.
Phase 5: Create assortment reports
Generate reports grouped by category, brand, product, and location where the data supports those distinctions. Useful views include products observed at both retailers, assortment differences, price movements for matched products, and records requiring further review.
Phase 6: Monitor data quality
Track collection completion, valid-record rates, missing fields, and product-matching exceptions. Automated alerts can help analysts investigate collection failures before they affect reporting. The objective of Product Data collection from Walmart & Wholefoods is to create a repeatable, auditable process for retail analysis. Any production deployment should comply with applicable website terms, access restrictions, privacy requirements, and permitted data-use conditions.
Results & Key Metrics
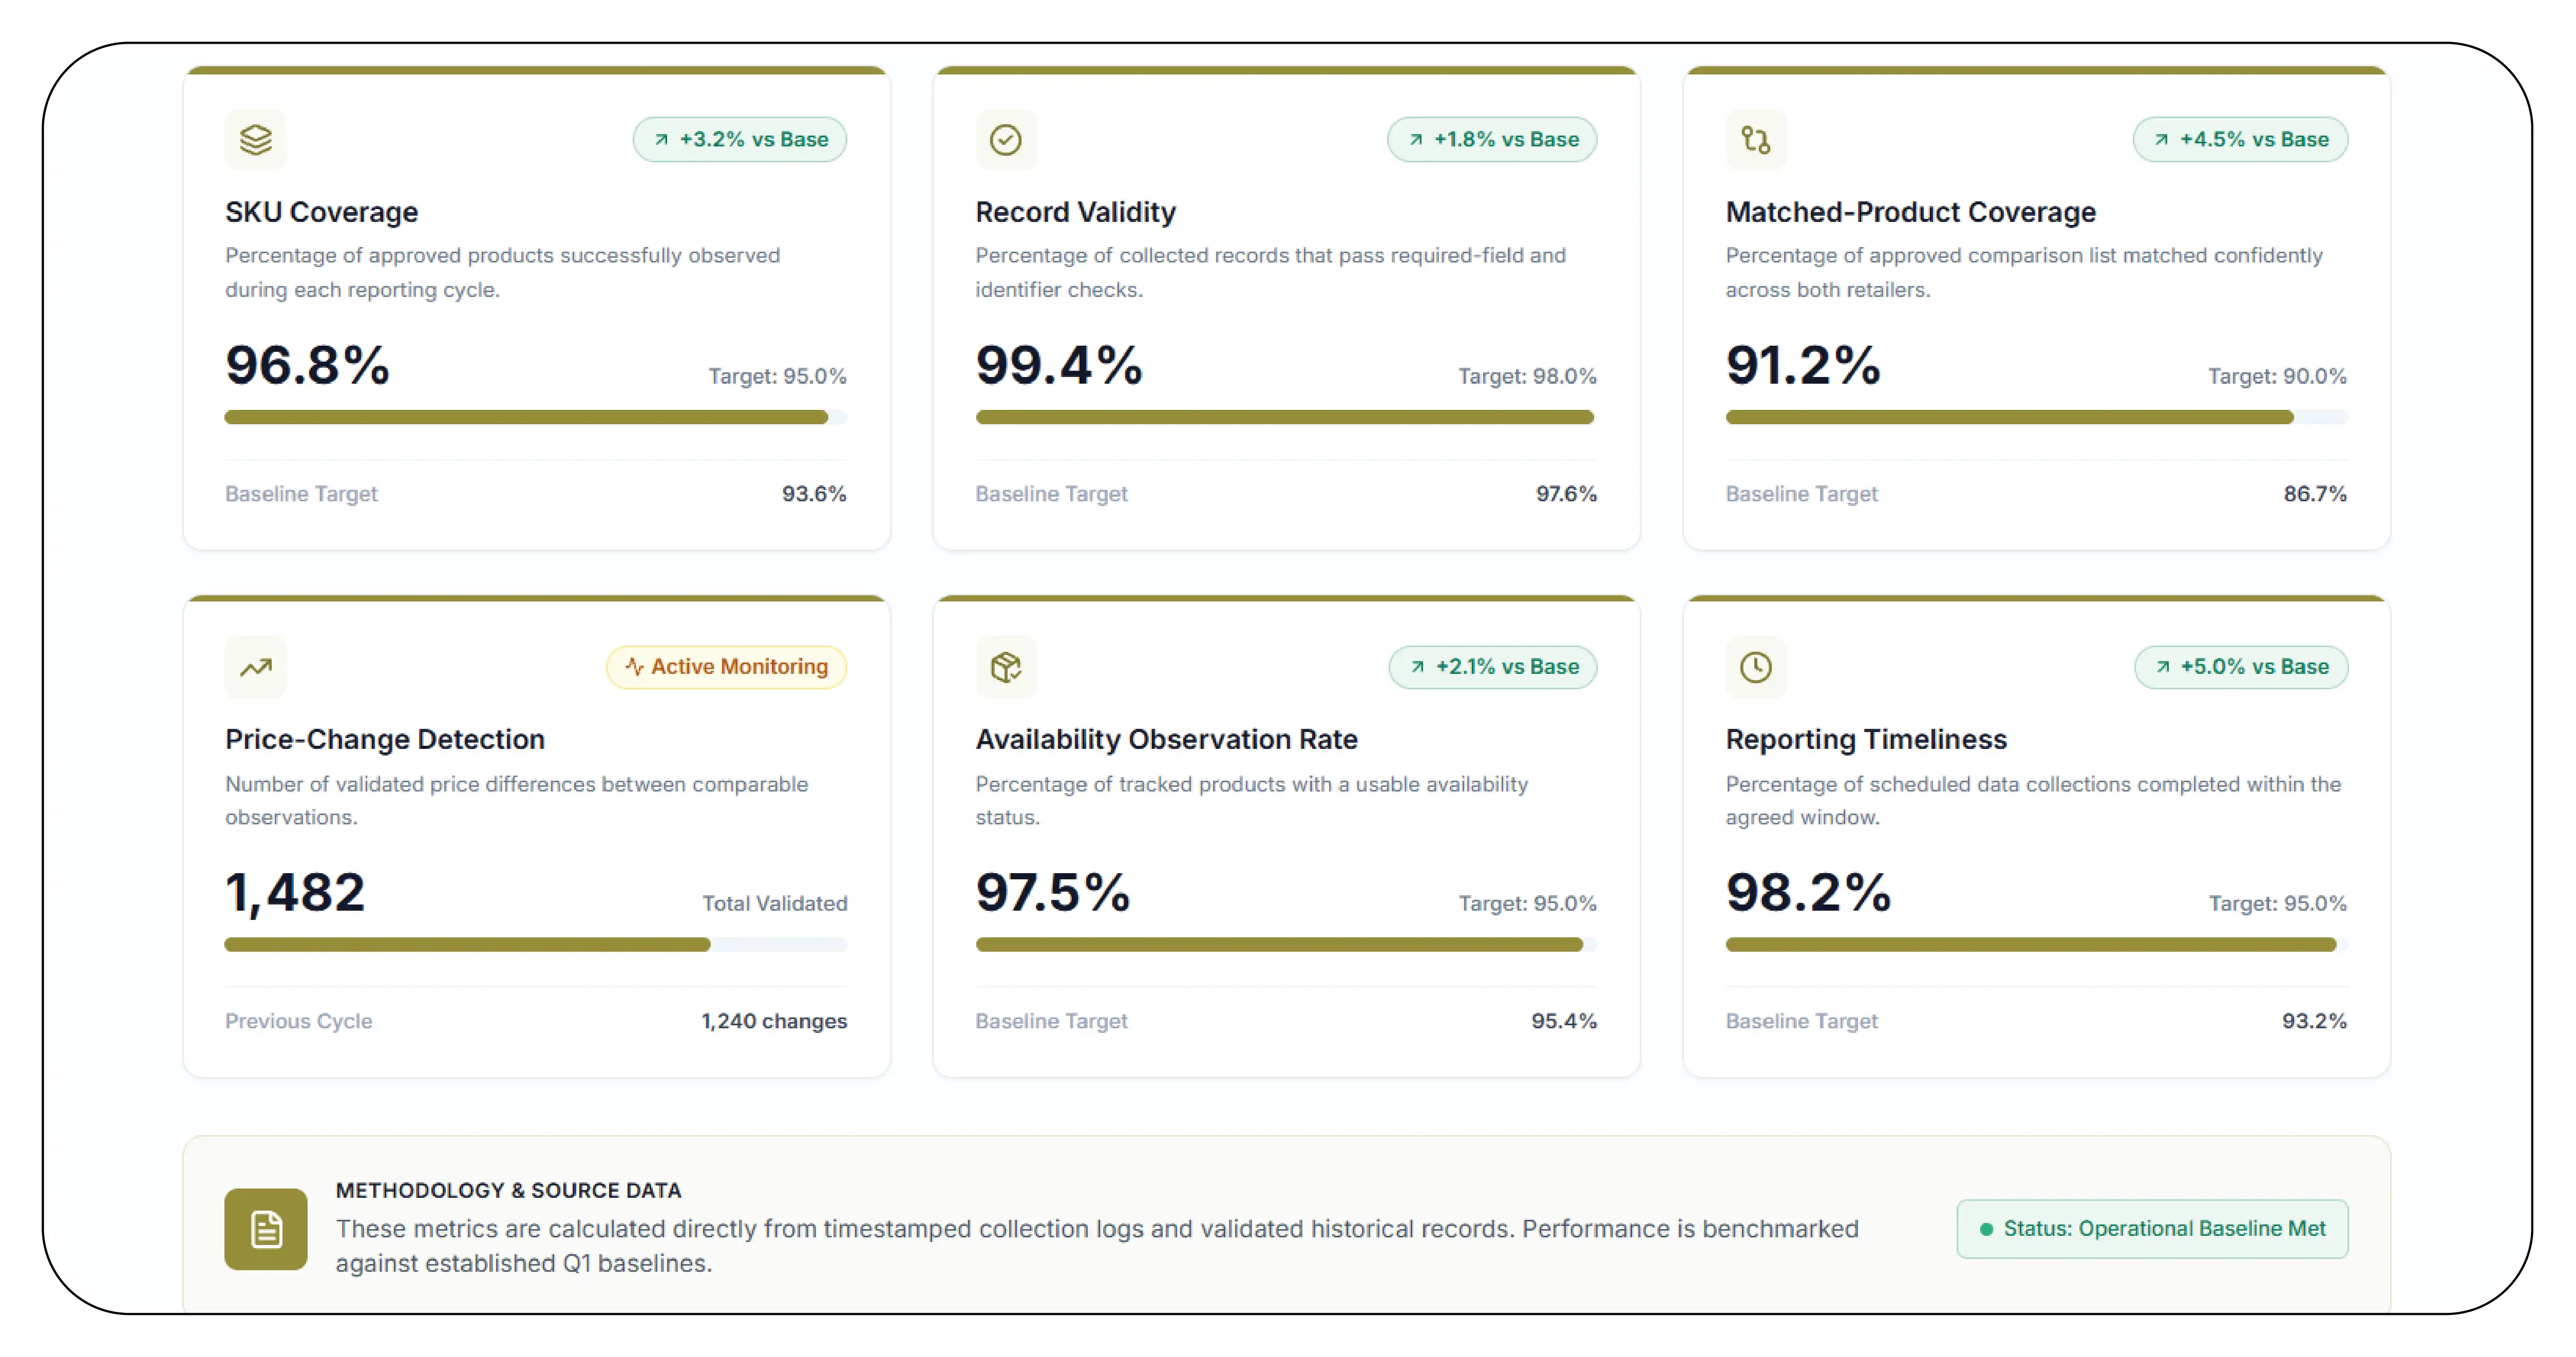
The following metrics can be used to assess the completed workflow. Actual project measurements have not been supplied, so no numerical improvement is claimed.
SKU coverage: Percentage of approved products successfully observed during each reporting cycle.
Record validity: Percentage of collected records that pass required-field and identifier checks.
Matched-product coverage: Percentage of the approved comparison list matched confidently across both retailers.
Price-change detection: Number of validated price differences between comparable observations.
Availability observation rate: Percentage of tracked products with a usable availability status.
Reporting timeliness: Percentage of scheduled data collections completed within the agreed window.
These metrics can be calculated from timestamped collection logs and validated historical records. The baseline, reporting period, and calculation method should be documented before performance is evaluated.
Results Narrative
A structured dataset can help an grocery team review grocery assortment and pricing information through a consistent reporting framework. Historical observations allow analysts to compare matched products, identify listing changes, and investigate differences in displayed prices.
The resulting reports may support category reviews, competitive research, and product selection decisions when the underlying data is sufficiently complete and comparable.
However, a price difference should not automatically be treated as a direct competitive advantage. Pack sizes, promotional conditions, location, taxes, and purchasing channels may differ. Likewise, an unavailable product should not be classified as discontinued without supporting evidence.
For this engagement, verified before-and-after results, client-approved business outcomes, and independently confirmed performance measurements were not available. Consequently, revenue growth, improved accuracy, faster reporting, or assortment optimisation cannot be attributed to a specific completed project.
What Made Product Data Scrape Different
A useful differentiator in retail data work is the quality of the workflow, not simply the volume of information collected. Product Data Scrape's approach can be positioned around structured records, repeatable collection, product matching, and validation.
The proposed framework preserves source information, distinguishes product variants, and retains historical snapshots for traceable comparisons. Data-quality checks can flag missing fields and unexpected changes before records enter reporting systems.
For the Walmart Grocery Product Dataset, a common schema can simplify analysis while preserving retailer-specific details. This is particularly important when comparing online and store-specific observations, since Walmart and Whole Foods Market both indicate that prices or availability may vary by location or channel.
These practices are implementation principles, not verified proprietary technologies or independently demonstrated innovations from this particular engagement.
Client's Testimonial
"Product Data Scrape provided a structured approach to gathering and analysing grocery product information from Walmart and Whole Foods Market. The insights from Grocery data scraping help us review product assortments, compare pricing across matched products, and identify changes in product availability. Having organised product data makes our market research more consistent and supports informed decisions about product selection and competitive positioning. This approach gives our team a clearer view of retail trends and helps us identify areas for further analysis and improvement."
— Head of Grocery Analytics
Conclusion
Reliable grocery product research depends on consistent product identification, transparent data collection, and careful comparison across retail channels. A structured workflow can help businesses organise product details, examine observed pricing, monitor listing changes, and assess assortment differences.
Well-maintained Grocery Datasets should preserve source information, timestamps, units, and relevant location context so that analysts can trace findings back to their observations. Data validation is equally important because missing records and unmatched product variants can distort conclusions.
For Product Data Scrape, Product Data collection from Walmart & Wholefoods can be presented as a framework for building analysis-ready retail information. The next step is to define the product scope, confirm permitted collection access, establish baseline KPIs, and validate the workflow against actual collected records before publishing project-specific results.
Frequently Asked Questions
1. What is grocery product data collection?
It is the process of gathering accessible information about grocery products, such as titles, brands, sizes, displayed prices, categories, and availability observations, for structured analysis.
2. Why compare Walmart and Whole Foods Market?
Both retailers offer online grocery product information, but their assortments, prices, and availability can differ. Comparing matched products can help analysts study observed differences while accounting for location and channel. Walmart | Whole Foods Market.
3. Which product fields should be collected?
Useful fields include product identifiers, title, brand, size, unit, displayed price, currency, source URL, timestamp, and availability status where accessible.
4. Can grocery data collection support pricing analysis?
Yes. Historical observations can help identify price differences and changes for comparable products. Analysts should account for pack sizes, promotions, locations, and purchasing channels before drawing conclusions.
5. How can data quality be maintained?
Use product-matching rules, duplicate checks, required-field validation, historical snapshots, and collection logs. Measure coverage and record validity against a documented baseline, and investigate missing or inconsistent observations before reporting findings.


 Singapore
 EMAIL
 PHONE











.webp)