Introduction
For FMCG brands selling online, complete and consistent product information directly affects how easily shoppers can understand, compare, and purchase products. FMCG catalog data extraction helps brands and retailers collect structured information such as product names, pack sizes, ingredients, prices, images, offers, ratings, availability, and category attributes. Quick commerce & FMCG data has become increasingly important as online grocery expands and consumers shift toward convenience-led purchasing.
This report evaluates the business importance of Attribute Completeness Across Amazon, Flipkart & BigBasket, focusing on how FMCG brands can assess the quality and consistency of product information across major digital retail environments. The analysis is intended for FMCG manufacturers, category managers, e-commerce teams, digital shelf teams, and market intelligence professionals who need dependable product-level information rather than isolated price observations.
The central finding is straightforward: attribute completeness should be measured at the SKU level, using a defined attribute schema and verified marketplace observations. A product should not be considered complete simply because its title and price are present. Important information can include brand, variant, net quantity, ingredients, nutritional information, packaging, country of origin, seller, availability, images, ratings, and other category-specific attributes.
Flipkart's current food-product interface, for example, exposes product categories and filters including brand, discount, flavour, packaging, country of origin, availability, organic status, and new arrivals. Its product pages can also expose information such as ratings and product specifications.
The challenge for FMCG brands is that attributes can appear differently across marketplaces. One platform may display a pack size prominently while another may bury it in specifications. This makes normalization essential before comparing catalog completeness.
How Can Brands Evaluate the Quality of Their Online Catalogs?
FMCG catalog quality assessment India should begin with a standardized attribute dictionary. The purpose is to establish which fields are mandatory, optional, or category-specific before marketplace records are evaluated. A biscuit SKU, for example, may require flavour, pack size, ingredients, dietary information, and net quantity, while a household-cleaning product may require fragrance, volume, usage instructions, and safety information.
BigBasket Product Data Scraper workflows can be used as one component of a broader collection process, provided that data collection follows applicable laws, platform terms, technical restrictions, and privacy requirements. The objective should be to capture publicly displayed product information and transform it into a consistent structure.
A quality assessment should measure four dimensions: completeness, consistency, validity, and freshness. Completeness asks whether required fields exist. Consistency asks whether the same attribute is represented in the same way. Validity checks whether values are plausible and correctly formatted. Freshness determines whether the information reflects the current listing.
The growth of online grocery makes these checks increasingly relevant. In 2020, India's online grocery market was estimated at more than US$3 billion, with COVID-19 accelerating consumer adoption. A 2020 RedSeer-BigBasket study also reported that e-grocery GMV in June 2020 was 1.7 times January levels.
| Year |
Verified market-level observation |
Relevance to catalog analysis |
| 2020 |
Online grocery estimated above US$3 billion |
Rapid digital grocery adoption |
| 2021 |
No directly comparable catalog-completeness figure verified |
Product-level measurement required |
| 2022 |
Online grocery market cited at US$4.54 billion in later IBEF reporting |
Expanding digital grocery opportunity |
| 2023 |
No directly comparable catalog-completeness figure verified |
Marketplace-level data should be collected directly |
| 2024 |
E-commerce industry cited at US$125 billion for FY24 |
Larger digital retail environment |
| 2025 |
Online shopper base reached approximately 290–300 million |
Wider potential audience for digital catalogs |
| 2026 |
Online retail market cited at approximately US$80 billion for FY26 |
Continued importance of structured online product data |
Sources: IBEF e-commerce and FMCG industry reporting. The figures are market-level indicators and are not measurements of attribute completeness.
For an actual catalog audit, brands should report the percentage of required fields populated for each SKU and marketplace. Those percentages should be calculated from collected records rather than estimated from market statistics.
What Should an Online Grocery Catalog Analysis Measure?
FMCG catalog analysis for online grocery platforms should examine whether customers receive enough standardized information to identify, evaluate, and purchase each SKU. The analysis should not treat every product category identically because attribute requirements differ between food, beverages, personal care, household products, and other FMCG categories.
Catalog Enrichment Services can address missing or inconsistent information by organizing raw marketplace attributes into a normalized schema. A useful schema can include product title, brand, sub-brand, variant, pack count, net quantity, unit of measure, flavour, ingredients, nutrition, dietary claims, images, MRP, selling price, discount, seller, availability, ratings, reviews, and source timestamp.
Flipkart's food-product pages demonstrate why attribute normalization matters. Its grocery interface includes categories such as confectionery, edible oils, ready meals, jams and marmalades, dairy products, spices, beverages, dry fruits, snacks, and other food products. The platform also exposes filters including brand, discount, flavour, packaging, country of origin, organic status, and availability.
The same attribute should ideally have a standardized representation across marketplaces. For example, "500 g," "500gm," and "0.5 kg" can represent the same quantity but should be normalized before analytical comparisons.
| Year |
Verified industry indicator |
Catalog implication |
| 2020 |
Online grocery expected to exceed US$3 billion |
Digital product information became increasingly important |
| 2021 |
No verified nationwide attribute-completeness benchmark found |
Baseline should be created from collected data |
| 2022 |
Online grocery cited at US$4.54 billion in later industry reporting |
Wider product coverage increases normalization needs |
| 2023 |
No verified national completeness benchmark found |
Marketplace-level measurement remains necessary |
| 2024 |
India e-commerce industry reported at US$125 billion for FY24 |
More online retail activity increases catalog complexity |
| 2025 |
Quick commerce represented 70–75% of e-grocery orders according to Bain data cited by IBEF |
Faster-moving catalogs require frequent updates |
| 2026 |
India online retail reported at approximately US$80 billion for FY26 |
Structured product intelligence remains commercially relevant |
The key operational insight is that catalog analysis should distinguish missing information from inconsistent information. A missing ingredient field is different from an ingredient field that contains text but uses a different structure. Both can reduce analytical quality, but they require different remediation.
Which Product Attributes Should FMCG Brands Track?
Product listing attribute coverage for FMCG brands should be evaluated against a category-specific master schema rather than a universal checklist. Food products require different information from detergents, cosmetics, beverages, or personal-care products. The objective is to identify the attributes that materially influence search, comparison, compliance, merchandising, and purchasing decisions.
Digital Shelf Analytics can combine product content, pricing, availability, ratings, promotions, and search visibility into a broader monitoring framework. For catalog completeness, however, the first priority should remain the accuracy and availability of core product information.
A practical FMCG attribute framework can include:
- Product and brand name
- Product type and category
- Variant or flavour
- Net quantity
- Pack count
- Ingredients
- Nutritional information where applicable
- Dietary or product claims
- Manufacturer or marketer information where displayed
- Country of origin where displayed
- Product images
- MRP and selling price
- Discount or promotional information
- Seller
- Availability
- Ratings and review count
- Marketplace-specific attributes
- Source URL and collection timestamp
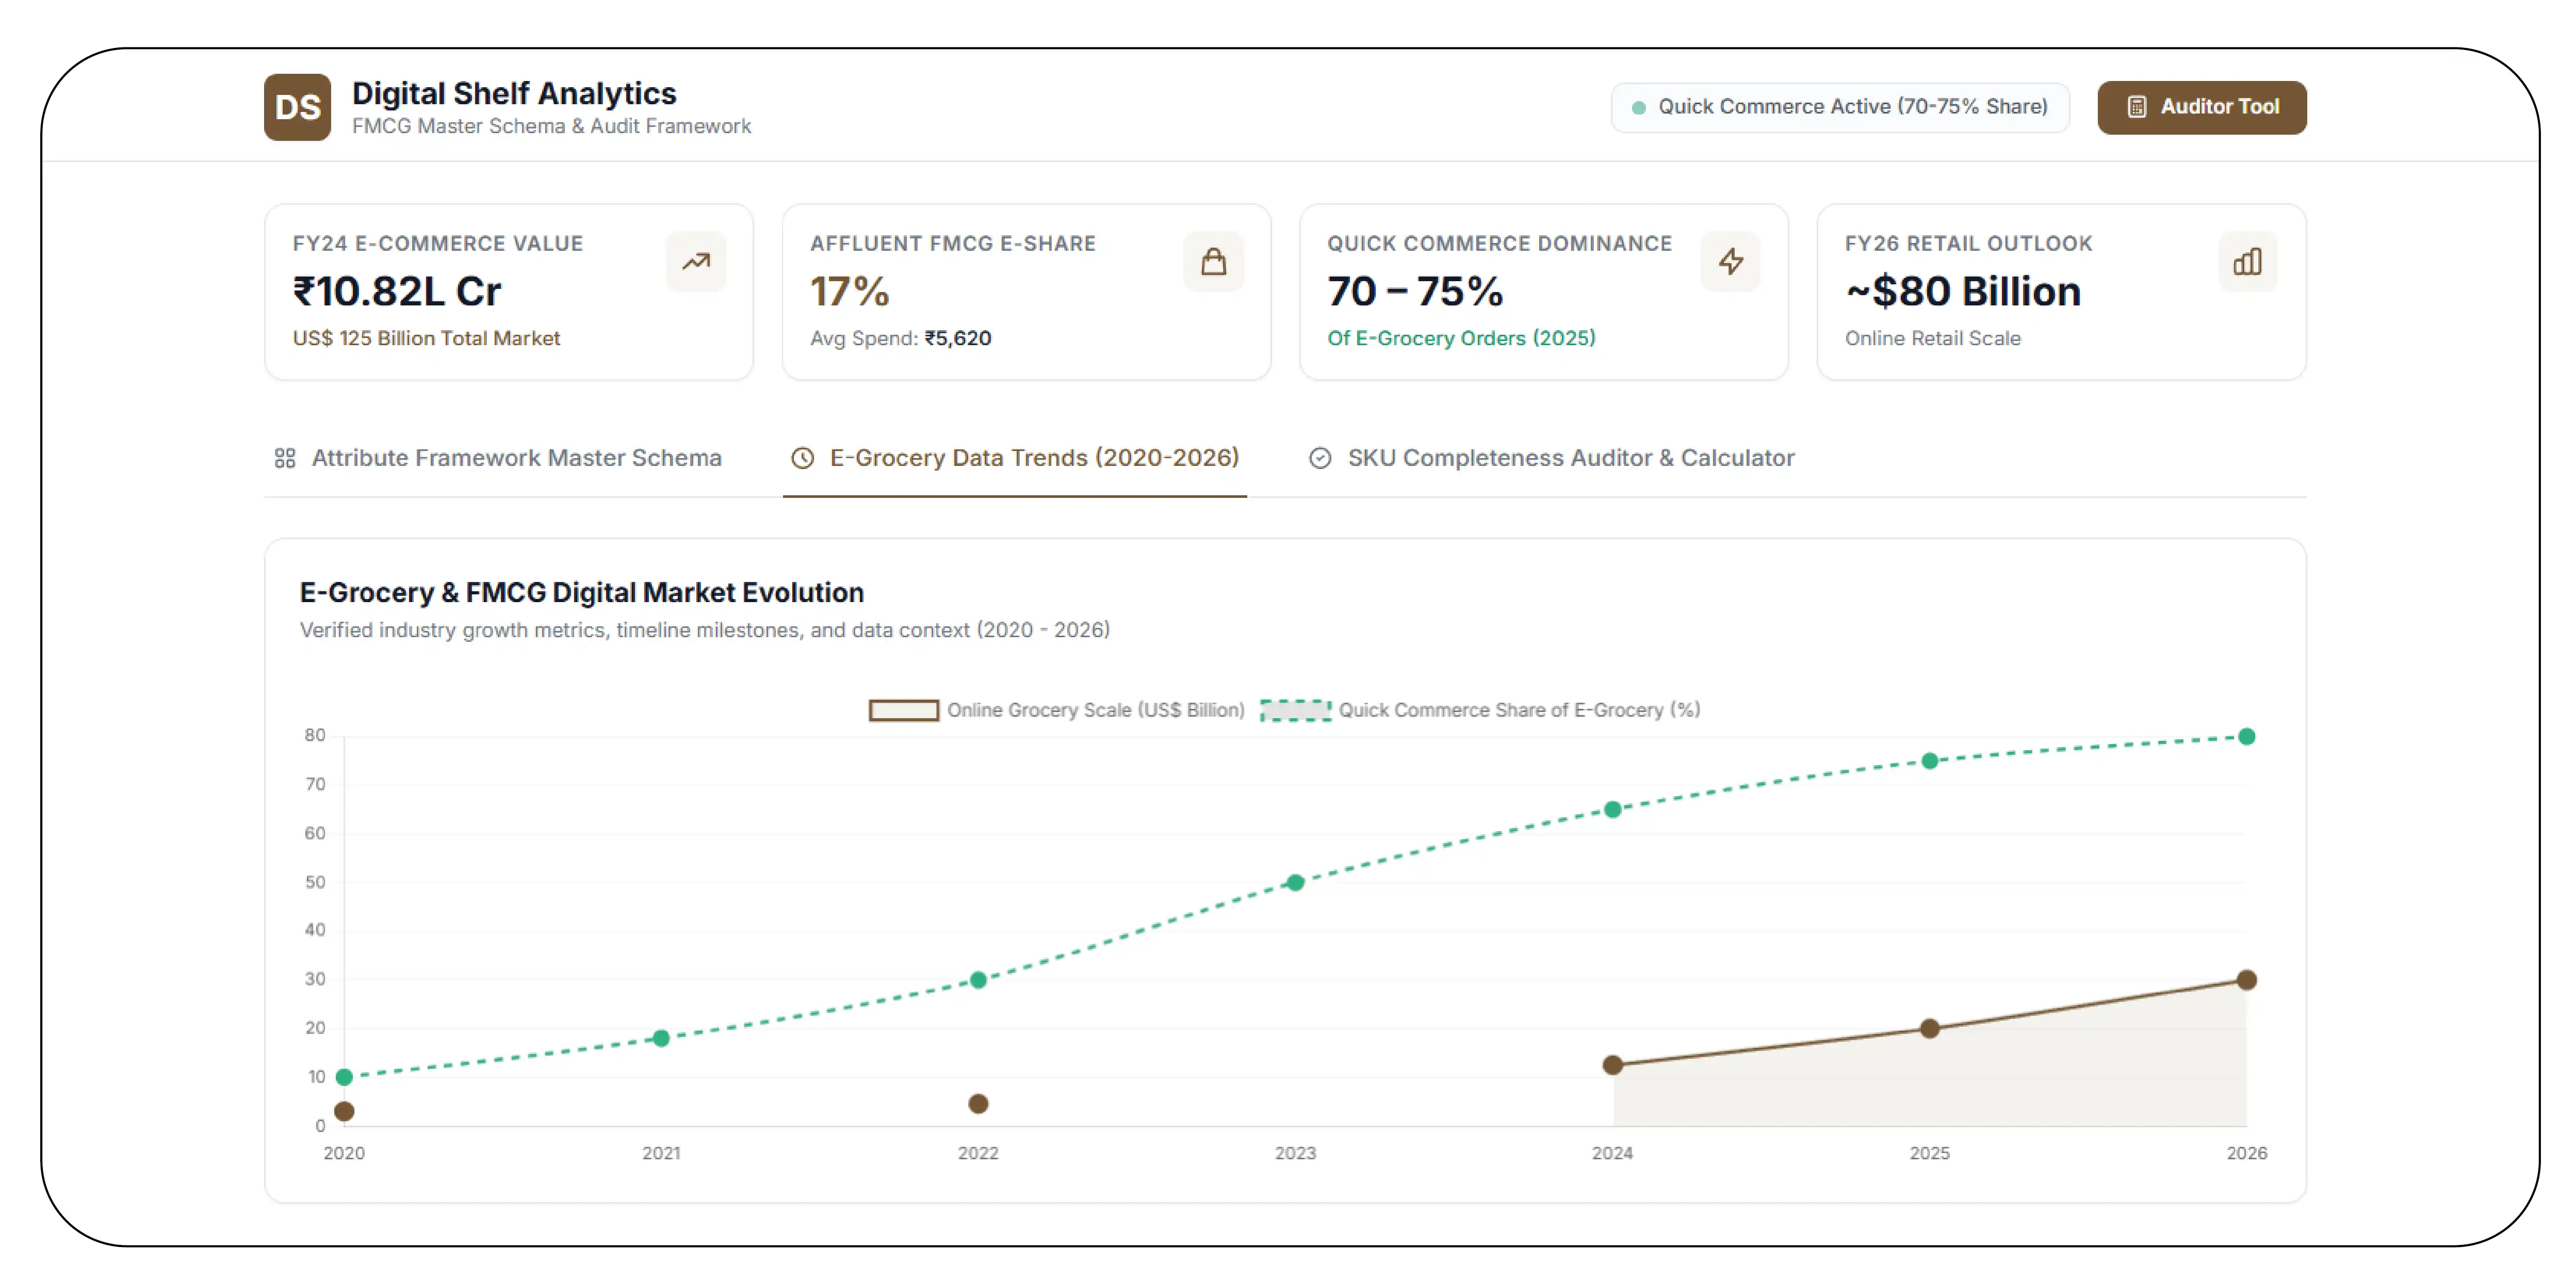
The importance of digital grocery is supported by market data. IBEF reports that e-commerce accounted for 17% of FMCG consumption among affluent buyers in 2024, with average spending of Rs. 5,620, while India's e-commerce industry was valued at Rs. 10,82,875 crore (US$125 billion) in FY24.
| Year |
Verified data point |
Why it matters |
| 2020 |
Online grocery estimated above US$3 billion |
Establishes early scale of digital grocery |
| 2021 |
No verified national FMCG attribute benchmark located |
Requires primary catalog collection |
| 2022 |
Online grocery market cited at US$4.54 billion |
Increasing importance of product discovery |
| 2023 |
No verified national completeness benchmark located |
Marketplace records remain the evidence base |
| 2024 |
E-commerce accounted for 17% of FMCG consumption among affluent buyers |
Digital product presentation has commercial relevance |
| 2025 |
Quick commerce accounted for 70–75% of e-grocery orders |
Catalog freshness becomes more important |
| 2026 |
Online retail reported at about US$80 billion for FY26 |
Continued expansion of digital retail |
For buyers, the actionable approach is to score each SKU against mandatory and optional fields. A missing mandatory pack size should have a greater impact on completeness than a missing optional marketing attribute. The weighting system should therefore be agreed with the brand or retailer before the audit begins.
How Can FMCG Product Information Be Scored Consistently?
FMCG Product Attribute Completeness should be calculated from a documented list of required attributes. The simplest method is to divide the number of populated required fields by the total number of required fields and multiply the result by 100. However, brands should not publish a completeness percentage without documenting the underlying schema.
FMCG catalog data extraction should therefore capture both the value and the status of each field. A field can be populated, missing, invalid, or not applicable. Treating "not applicable" as missing would incorrectly reduce a product's score.
For example, a category schema may classify brand, product name, net quantity, price, availability, and primary image as core fields. Category-specific fields such as flavour, ingredients, or nutritional information can then be added where relevant.
A useful audit structure is:
| Attribute status |
Meaning |
Treatment |
| Populated |
Valid value is present |
Counts toward completeness |
| Missing |
Expected value is absent |
Reduces completeness |
| Invalid |
Value exists but fails validation |
Requires correction |
| Not applicable |
Attribute does not apply |
Excluded from denominator |
| Unclear |
Information cannot be reliably interpreted |
Manual review |
Historical market statistics cannot be used to calculate these scores. The score must come from actual product records collected from the target platforms.
For 2020–2026, publicly available industry sources provide useful context but do not establish a standardized nationwide FMCG catalog-completeness benchmark. This is an important research limitation. Rather than inventing an annual completeness percentage, brands should create their own baseline from verified marketplace records.
The rapid growth of quick commerce reinforces the need for this discipline. IBEF, citing Bain & Company, reported that quick commerce represented 70–75% of total e-grocery orders in 2025, compared with approximately 35% in 2022.
That shift means catalog information may need to be reviewed more frequently. A product that is correctly represented on a traditional marketplace can still suffer from missing or outdated information in a faster-moving digital grocery environment.
The strongest audit therefore combines completeness with freshness. A field that was accurate six months ago may no longer represent the current package, price, availability, or product formulation.
How Does Attribute Coverage Differ Between Major Platforms?
Product attribute completeness across Amazon Flipkart and BigBasket should be assessed using identical rules. Comparing the number of visible fields alone can be misleading because platforms may expose information through different page structures, labels, specifications, or category templates.
FMCG catalog data extraction should preserve the original field name as well as the normalized field. This allows analysts to trace how a marketplace presented the information while still enabling cross-platform comparison.
For example, Flipkart's food category currently exposes filters for brand, discount, flavour, packaging, country of origin, availability, organic status, and new arrivals. Its grocery pages also contain product-level information such as pack size, ratings, and displayed prices.
The comparison should therefore focus on normalized attributes rather than assuming that one marketplace's page structure is the industry standard.
| Year |
What can be verified |
Recommended analytical treatment |
| 2020 |
Online grocery market exceeded an estimated US$3 billion |
Use as market context, not attribute scoring |
| 2021 |
No comparable platform-level completeness benchmark identified |
Establish SKU-level baseline |
| 2022 |
Online grocery cited at US$4.54 billion |
Monitor expansion in product coverage |
| 2023 |
No comparable national completeness benchmark identified |
Maintain marketplace-level evidence |
| 2024 |
E-commerce industry valued at US$125 billion in FY24 |
Evaluate digital catalog quality as part of retail execution |
| 2025 |
Quick commerce reached 70–75% of e-grocery orders |
Increase monitoring frequency for fast-moving categories |
| 2026 |
Online retail reached approximately US$80 billion in FY26 |
Maintain continuous digital shelf monitoring |
A useful cross-platform dashboard should show each SKU as a row and normalized attributes as columns. Missing fields can then be highlighted for remediation. The dashboard should also show whether a missing field is genuinely absent or simply stored under another marketplace-specific label.
The analysis should not declare Amazon, Flipkart, or BigBasket "better" based solely on the number of visible fields. Different category templates and commercial requirements can explain some differences. The meaningful question is whether each platform provides the information that a brand has defined as necessary for accurate product discovery, comparison, and purchase.
How Can Brands Benchmark Catalog Performance by Brand?
Brand-level FMCG catalog benchmarking aggregates SKU-level observations so that manufacturers can identify recurring content gaps. Instead of examining one product at a time, the brand team can determine whether missing pack sizes, ingredients, images, or other attributes occur repeatedly across the portfolio.
FMCG catalog data extraction can support this process by maintaining a historical record of each SKU's attribute status. A brand could compare the percentage of complete SKUs by marketplace, category, product family, or attribute group.
The benchmark should include at least four dimensions: coverage, accuracy, consistency, and freshness. Coverage measures how many required attributes are present. Accuracy evaluates whether the values are correct. Consistency checks whether the same product information appears consistently across platforms. Freshness checks whether the listing reflects the latest approved product information.
Quick commerce makes the freshness dimension particularly important. IBEF reports that quick commerce in India grew from approximately 35% of e-grocery orders in 2022 to 70–75% in 2025. CareEdge data cited by IBEF also put quick-commerce gross order value at Rs. 64,000 crore in FY25, more than double FY24's Rs. 30,000 crore.
| Year |
Verified industry evidence |
Benchmarking implication |
| 2020 |
Online grocery estimated above US$3 billion |
Establish early digital-grocery context |
| 2021 |
No verified national brand-level catalog benchmark |
Direct SKU auditing required |
| 2022 |
Quick commerce represented about 35% of e-grocery orders |
Increasing need for digital availability |
| 2023 |
No verified national attribute-completeness benchmark |
Maintain platform-specific measurement |
| 2024 |
Quick-commerce GOV reported at Rs. 30,000 crore |
Faster-moving retail environment |
| 2025 |
Quick-commerce GOV reached Rs. 64,000 crore |
Stronger requirement for catalog monitoring |
| 2026 |
Online retail reported at approximately US$80 billion for FY26 |
Continued need for scalable digital shelf intelligence |
For a brand manager, the most actionable output is not a generic catalog score. It is a prioritized correction list showing which SKUs have the largest number of missing mandatory attributes, which marketplaces have recurring gaps, and which attributes require immediate attention.
That creates a practical loop: collect, normalize, score, identify gaps, correct content, and monitor again.
Why Choose Product Data Scrape?
Product Data Scrape can support FMCG brands and retailers that need structured marketplace information for catalog audits, competitive intelligence, and digital shelf monitoring. A strong data workflow should combine product identification, attribute normalization, validation, timestamping, and marketplace comparison.
A Flipkart scraper workflow can form part of a multi-marketplace collection strategy, but the broader objective should be consistent product intelligence rather than data collection from a single platform. Collection should always operate within applicable laws, platform terms, technical restrictions, and privacy requirements.
The main business benefits include:
- SKU-level catalog monitoring: Track individual FMCG products across marketplaces.
- Attribute normalization: Convert inconsistent marketplace labels and units into a common schema.
- Completeness scoring: Identify missing mandatory and category-specific attributes.
- Digital shelf monitoring: Review prices, availability, images, promotions, and product content.
- Historical tracking: Preserve dated observations to identify catalog changes.
- Brand benchmarking: Compare content quality across product families and marketplaces.
- Data quality control: Detect duplicates, mismatched variants, missing values, and inconsistent pack sizes.
The need for this capability is supported by the broader shift toward digital FMCG consumption. IBEF reports that e-commerce accounted for 17% of FMCG consumption among affluent buyers in 2024 and that India's online grocery market is projected to grow substantially over the longer term.
For buyers evaluating a data provider, important questions include marketplace coverage, update frequency, historical depth, product matching, attribute schema, validation process, delivery format, and source traceability. A provider should also clearly distinguish verified data from fields that could not be collected or validated.
The strongest solution is therefore not simply a scraper. It is a repeatable product intelligence workflow that turns marketplace information into a structured, auditable dataset.
Conclusion
Complete product information is becoming increasingly important as FMCG sales expand across marketplaces, online grocery, and quick commerce. The available industry evidence shows substantial growth in India's digital grocery ecosystem, including the increase in quick-commerce share of e-grocery orders from approximately 35% in 2022 to 70–75% in 2025.
The practical answer for FMCG brands is to establish a standardized attribute schema, collect comparable product records from Amazon, Flipkart, and BigBasket, normalize the information, and score each SKU against clearly defined mandatory fields. Historical market statistics should provide context, but product-level completeness scores must come from verified marketplace observations.
Amazon product data scraping can contribute to this workflow when combined with comparable collection from other marketplaces and appropriate compliance controls. FMCG catalog data extraction then becomes part of a broader digital shelf process covering product content, pricing, availability, promotions, and competitive positioning.
The most useful output is a continuously updated catalog-quality dashboard showing which SKUs are complete, which attributes are missing, where marketplace information differs, and which corrections should be prioritized.
Ready to improve FMCG catalog visibility across major online marketplaces? Partner with Product Data Scrape to build a structured, verified, and scalable product-data intelligence workflow for your digital shelf!


 Singapore
 EMAIL
 PHONE










.webp)