Introduction
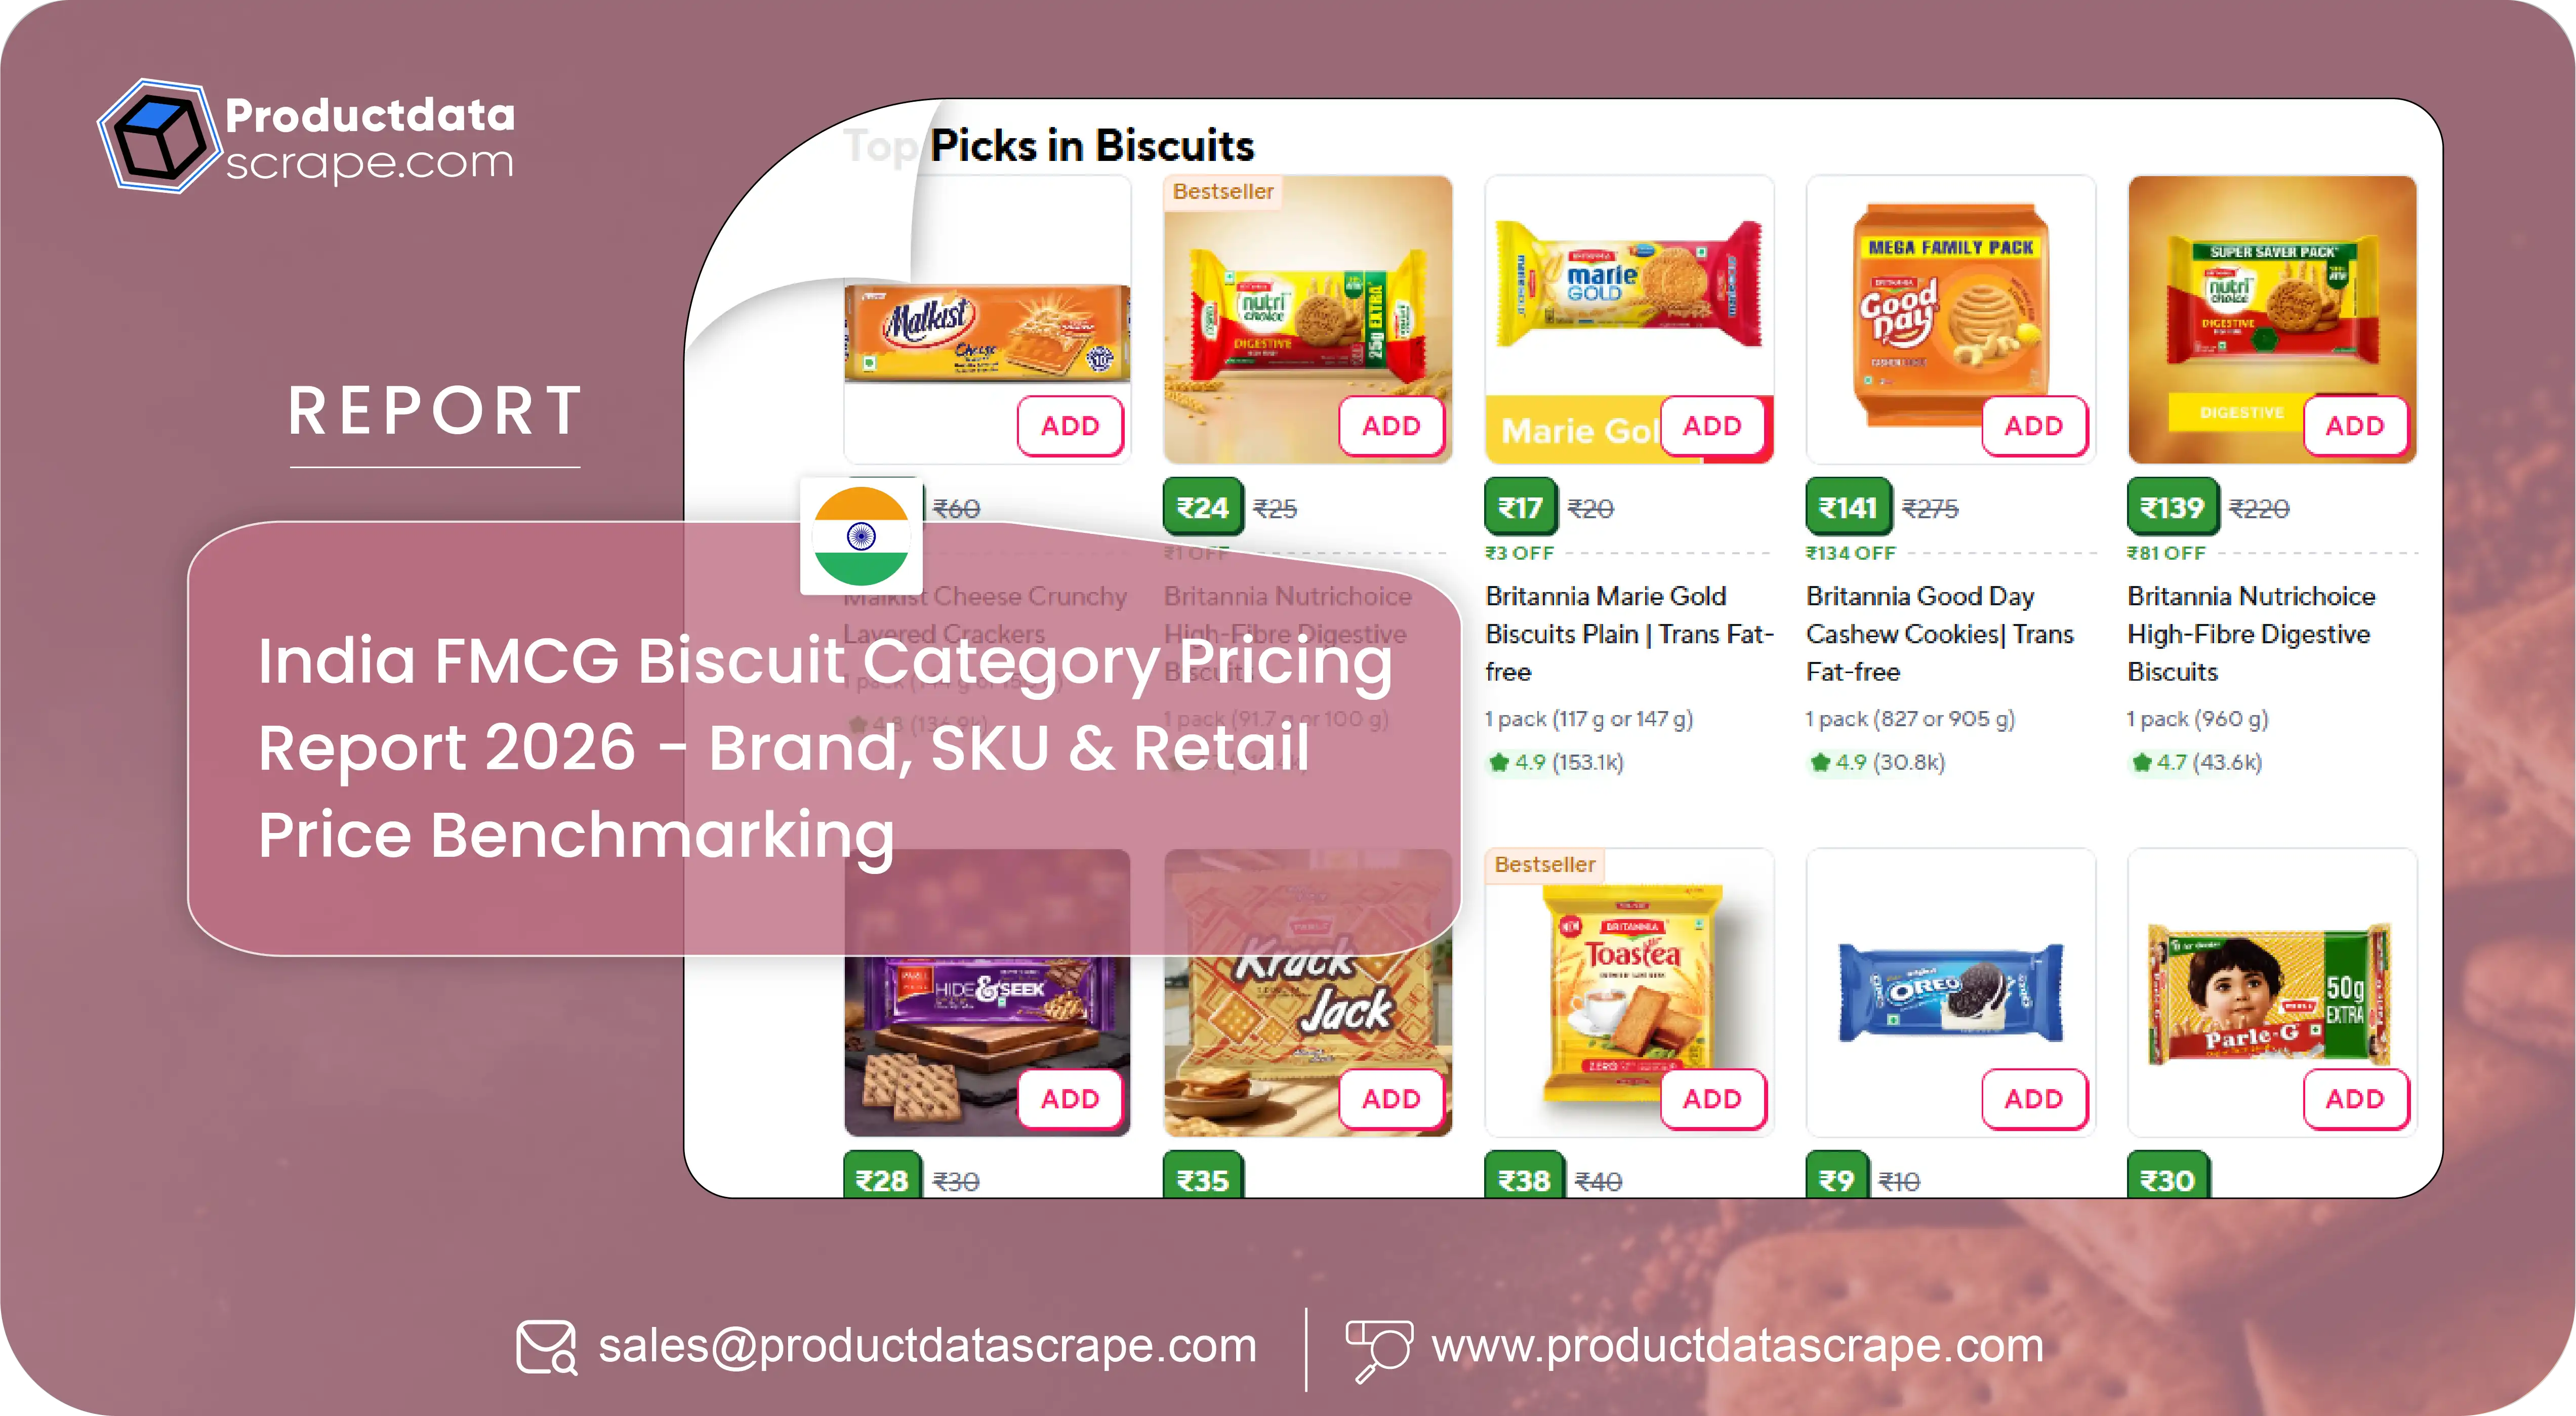
India's biscuit market continues to evolve as consumer preferences, inflation, raw material costs, and digital retail expansion reshape pricing strategies across brands and channels. Manufacturers and retailers are increasingly relying on data-driven decision-making to optimize product positioning, promotional planning, and SKU performance. The growing influence of e-commerce and q-commerce platforms has further intensified the need for real-time pricing intelligence and competitive benchmarking. This India FMCG Biscuit Category Pricing Report 2026 provides an in-depth analysis of pricing trends, brand positioning, retailer comparisons, and SKU-level insights across India's leading retail ecosystems. Supported by advanced Quick commerce intelligence, the report highlights how businesses can monitor price fluctuations, evaluate discount strategies, benchmark competitors, and identify emerging opportunities. Designed for FMCG manufacturers, distributors, retailers, and market analysts, this research delivers actionable intelligence to strengthen pricing strategies, improve assortment planning, and drive sustainable growth in India's highly competitive biscuit category.
1. Evolving Retail Pricing Dynamics
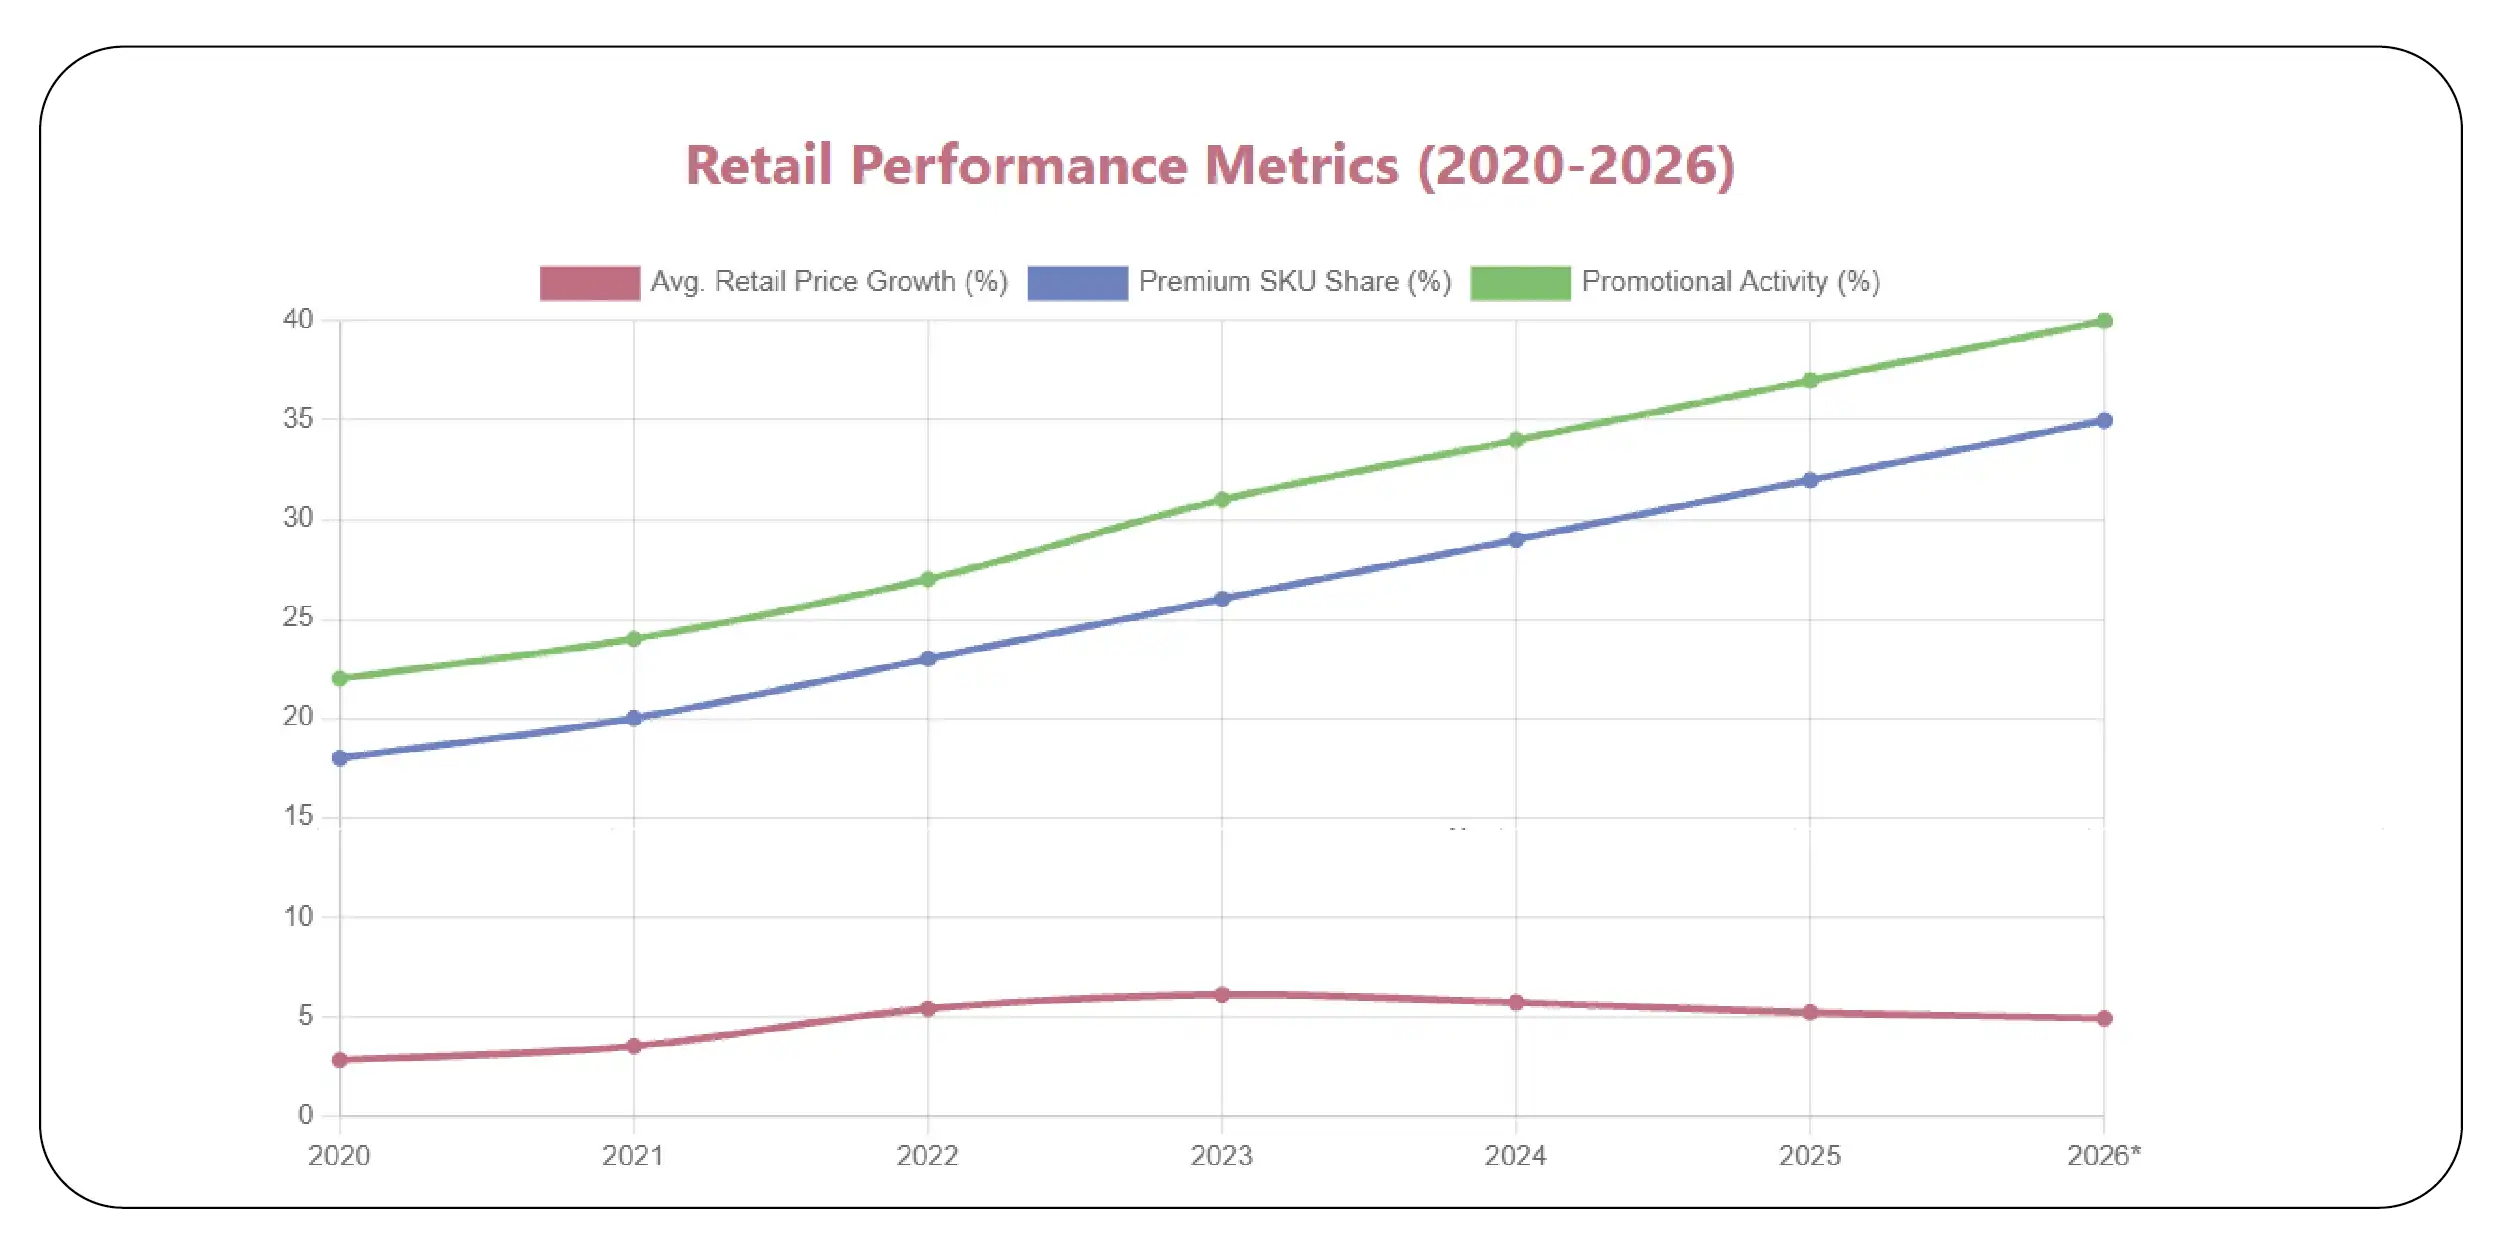
India's biscuit category has experienced steady pricing adjustments driven by inflation, premiumization, regional demand, and changing consumer buying behavior. National brands and regional manufacturers have adopted dynamic pricing strategies to balance affordability with profitability across modern trade, e-commerce, and quick-commerce platforms. Businesses seeking India Biscuit Market Pricing Analysis 2026 increasingly depend on automated pricing intelligence to compare retailer performance and optimize pricing decisions. Advanced Amazon product data scraping enables continuous monitoring of product listings, price fluctuations, discounts, customer ratings, and availability, providing valuable competitive insights for category managers.
The market has also witnessed growing adoption of multi-pack offerings, value packs, and premium health-focused biscuit variants, creating more complex pricing structures across different retail channels. Continuous benchmarking helps manufacturers identify pricing gaps, improve promotional effectiveness, and respond quickly to competitor movements. Retailers benefit from automated pricing intelligence by improving category performance, reducing manual monitoring efforts, and enhancing revenue optimization strategies.
India Biscuit Pricing Trends (2020–2026)
| Year |
Avg. Retail Price Growth (%) |
Premium SKU Share (%) |
Promotional Activity (%) |
| 2020 |
2.8 |
18 |
22 |
| 2021 |
3.5 |
20 |
24 |
| 2022 |
5.4 |
23 |
27 |
| 2023 |
6.1 |
26 |
31 |
| 2024 |
5.7 |
29 |
34 |
| 2025 |
5.2 |
32 |
37 |
| 2026* |
4.9 |
35 |
40 |
*2026 values represent market estimates based on industry trends.
Key Insights
- Premium biscuits continue gaining market share.
- Dynamic pricing has become common across digital retail.
- Promotional campaigns significantly influence purchase decisions.
- Automated pricing intelligence supports faster competitive response.
2. Understanding Brand and SKU Performance
Leading biscuit manufacturers are expanding product portfolios to cater to value-conscious as well as premium consumers. Retailers now manage hundreds of SKUs across glucose biscuits, cookies, cream biscuits, digestive products, healthy snacks, and family packs. Businesses require India FMCG biscuit category Data insights to evaluate pricing consistency, assortment performance, and promotional effectiveness across brands and retail channels. Leveraging Flipkart product data scraping, organizations can monitor product listings, availability, discounts, customer ratings, and price movements in near real time.
Data-driven benchmarking enables manufacturers to compare product performance by brand, package size, flavor, and region while identifying opportunities for assortment optimization. Retailers also benefit from deeper visibility into competitor pricing strategies, helping improve category planning and promotional execution. SKU-level analysis further supports demand forecasting, inventory planning, and pricing optimization, ensuring products remain competitive in both online and offline channels.
India Biscuit Category Performance (2020–2026)
| Year |
Active Biscuit SKUs |
Avg. Discount (%) |
Online Category Growth (%) |
| 2020 |
1,450 |
9 |
12 |
| 2021 |
1,610 |
10 |
16 |
| 2022 |
1,820 |
12 |
21 |
| 2023 |
2,040 |
14 |
26 |
| 2024 |
2,260 |
15 |
31 |
| 2025 |
2,470 |
17 |
35 |
| 2026* |
2,700 |
18 |
39 |
*2026 values represent projected industry benchmarks.
Key Insights
- SKU diversity continues to expand across biscuit categories.
- Online retail contributes significantly to category growth.
- Higher promotional activity drives stronger consumer engagement.
- Detailed SKU benchmarking improves assortment and pricing strategies.
3. Strengthening Multi-Channel Product Intelligence
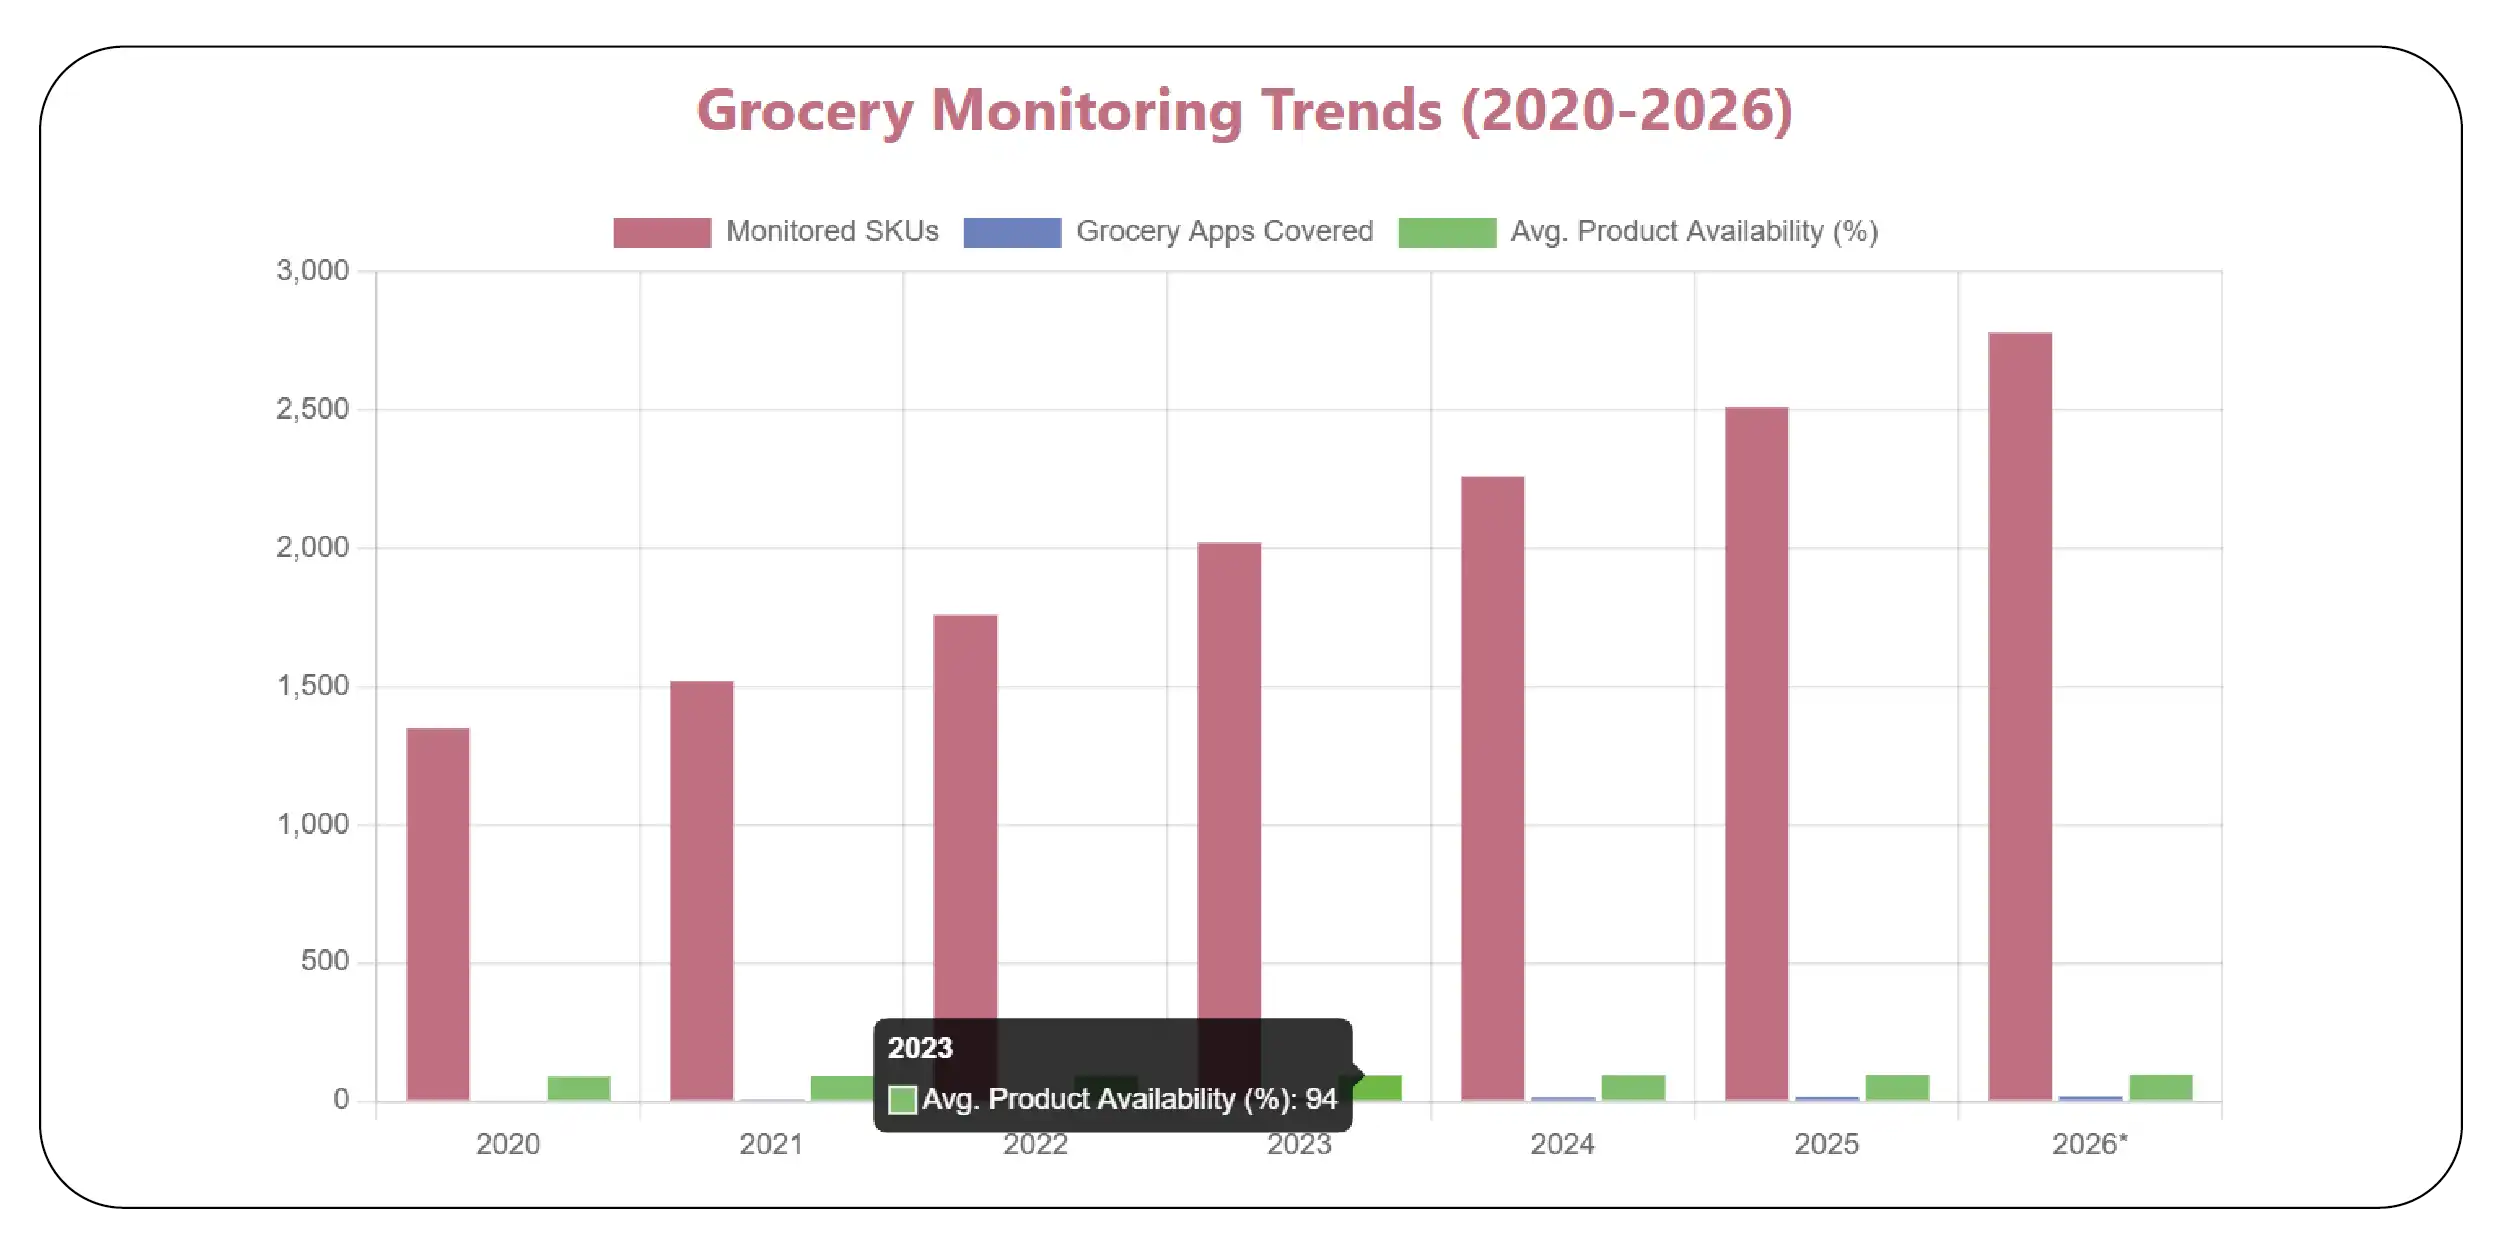
India's biscuit market has become increasingly fragmented as consumers shop across supermarkets, quick-commerce platforms, and e-commerce marketplaces. This shift requires brands to maintain consistent product information, pricing, availability, and promotional visibility across every sales channel. Businesses that scrape biscuit product catalogs from grocery apps gain comprehensive visibility into product assortment, package sizes, flavors, nutritional claims, pricing, discounts, and stock availability. Combined with FMCG data scraping for the India market, organizations can build a centralized repository of structured product intelligence for analytics and strategic planning.
Comprehensive product catalog monitoring also helps manufacturers identify missing SKUs, duplicate listings, assortment gaps, and inconsistent product descriptions across retailers. These insights improve category management, accelerate product launches, and strengthen distribution strategies. Automated data extraction eliminates manual effort while providing continuously updated market intelligence that supports merchandising, pricing optimization, and competitive benchmarking.
India Biscuit Product Catalog Trends (2020–2026)
| Year |
Monitored SKUs |
Grocery Apps Covered |
Avg. Product Availability (%) |
| 2020 |
1,350 |
5 |
89 |
| 2021 |
1,520 |
7 |
91 |
| 2022 |
1,760 |
9 |
92 |
| 2023 |
2,020 |
11 |
94 |
| 2024 |
2,260 |
13 |
95 |
| 2025 |
2,510 |
15 |
96 |
| 2026* |
2,780 |
17 |
97 |
*2026 values represent projected market estimates.
Key Insights
- Product assortments continue expanding across digital grocery platforms.
- Automated catalog monitoring improves listing consistency.
- Availability tracking supports stronger inventory planning.
- Centralized product intelligence enhances category management.
4. Turning Retail Data into Actionable Business Intelligence
Retail pricing data becomes significantly more valuable when transformed into interactive analytics that support faster business decisions. Organizations increasingly Monitor Biscuit pricing data for Power BI dashboards to visualize pricing trends, competitor movements, promotional performance, and category-level changes through real-time reporting. Integrating this information with Market Share Analytics enables decision-makers to evaluate brand performance, retailer contribution, regional demand, and pricing effectiveness using unified dashboards.
Business intelligence platforms empower category managers to identify unusual price fluctuations, monitor promotional ROI, compare retailer performance, and detect emerging consumer trends before they impact revenue. Automated reporting reduces manual analysis while improving forecasting accuracy and executive decision-making. With continuously updated retail datasets, brands can monitor key performance indicators, optimize pricing strategies, and respond proactively to competitive market changes.
Business Intelligence Adoption Metrics (2020–2026)
| Year |
Companies Using BI Dashboards (%) |
Pricing Accuracy (%) |
Decision Speed Improvement (%) |
| 2020 |
28 |
84 |
20 |
| 2021 |
35 |
86 |
25 |
| 2022 |
43 |
89 |
31 |
| 2023 |
52 |
91 |
38 |
| 2024 |
61 |
93 |
44 |
| 2025 |
69 |
95 |
49 |
| 2026* |
76 |
96 |
55 |
*2026 values represent projected industry benchmarks.
Key Insights
- BI dashboard adoption continues to accelerate across FMCG companies.
- Automated reporting improves pricing visibility and forecasting.
- Market share tracking enables more effective competitive benchmarking.
- Real-time analytics support faster pricing and merchandising decisions.
5. Optimizing Cross-Platform Pricing Strategies
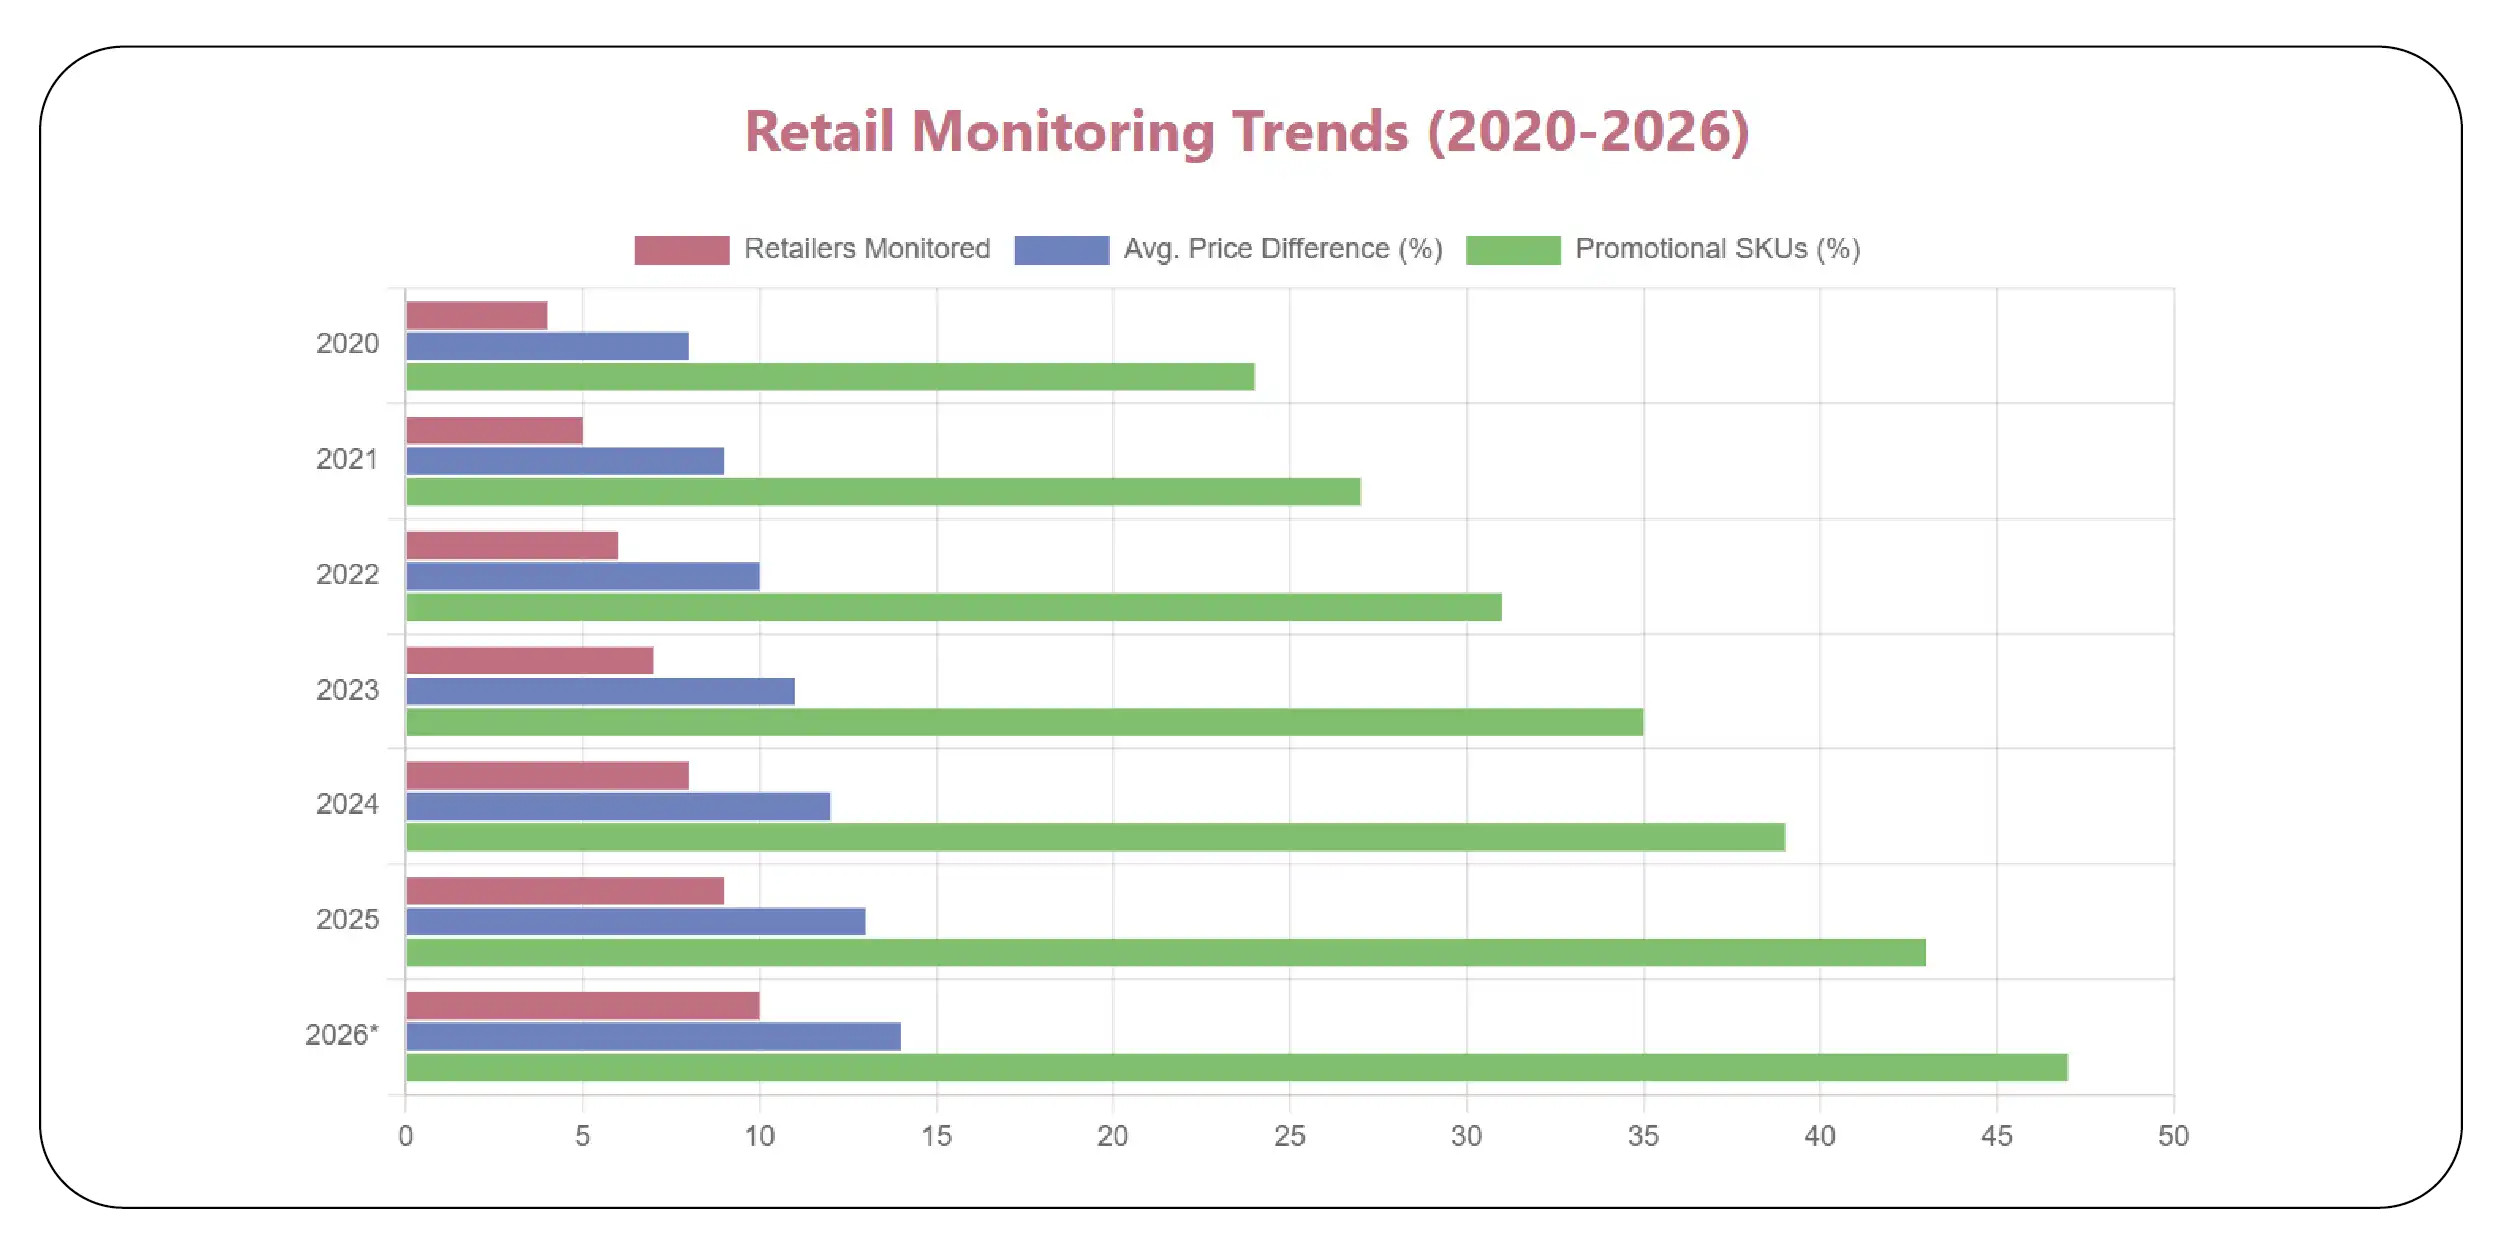
Today's biscuit category is highly competitive across quick-commerce and e-commerce channels, where prices, promotions, and availability change throughout the day. Brands require unified pricing visibility to maintain competitiveness and optimize promotional investments. Businesses that scrape biscuit prices across BigBasket, Blinkit, Amazon and Flipkart gain a comprehensive view of retailer pricing strategies, discount frequency, bundle offers, and assortment variations. This intelligence helps manufacturers benchmark products across multiple channels while identifying pricing gaps and promotional opportunities.
Cross-platform monitoring enables category managers to compare identical SKUs across retailers, evaluate regional pricing differences, and measure the effectiveness of discount campaigns. Automated data collection also supports demand forecasting by identifying seasonal buying patterns and retailer-specific pricing behavior. Continuous competitive monitoring reduces manual effort while enabling faster responses to market changes.
Cross-Platform Pricing Trends (2020–2026)
| Year |
Retailers Monitored |
Avg. Price Difference (%) |
Promotional SKUs (%) |
| 2020 |
4 |
8 |
24 |
| 2021 |
5 |
9 |
27 |
| 2022 |
6 |
10 |
31 |
| 2023 |
7 |
11 |
35 |
| 2024 |
8 |
12 |
39 |
| 2025 |
9 |
13 |
43 |
| 2026* |
10 |
14 |
47 |
*2026 values represent projected market estimates.
Key Insights
- Retail pricing differences continue to widen across channels.
- Promotional activity is increasing year over year.
- Cross-platform benchmarking improves pricing consistency.
- Automated monitoring supports faster competitive decision-making.
6. Driving Smarter Decisions Through Detailed SKU Insights
SKU-level analysis has become essential for understanding consumer purchasing behavior, retailer performance, and product profitability. Businesses leveraging SKU-level biscuit pricing analytics can evaluate price movements by brand, pack size, flavor, retailer, and region, enabling more informed pricing and assortment decisions.
Detailed SKU intelligence also helps manufacturers detect pricing inconsistencies, identify underperforming products, and optimize promotional investments. Historical trend analysis reveals seasonal demand shifts, premiumization trends, and retailer-specific pricing strategies that support long-term planning. By integrating SKU-level analytics into business intelligence platforms, organizations improve category performance, strengthen negotiation strategies with retailers, and enhance revenue management.
SKU Performance Trends (2020–2026)
| Year |
SKUs Benchmarked |
Avg. SKU Price Updates/Month |
Premium SKU Growth (%) |
| 2020 |
1,400 |
5 |
6 |
| 2021 |
1,600 |
7 |
8 |
| 2022 |
1,850 |
9 |
10 |
| 2023 |
2,120 |
12 |
13 |
| 2024 |
2,360 |
14 |
16 |
| 2025 |
2,620 |
17 |
19 |
| 2026* |
2,900 |
20 |
22 |
*2026 values represent projected industry estimates.
Key Insights
- SKU-level monitoring improves category planning.
- Premium biscuit segments continue to expand.
- Frequent price updates require automated monitoring.
- Detailed analytics support stronger assortment optimization.
Why Choose Product Data Scrape?
Product Data Scrape helps FMCG manufacturers, retailers, distributors, and market research firms transform raw retail information into actionable business intelligence. Our expertise in web scraping, automated data pipelines, and AI-powered analytics enables businesses to monitor pricing, promotions, assortments, and competitive activity across India's leading retail and quick-commerce platforms.
We specialize in collecting Quick commerce & FMCG data with high accuracy, delivering structured datasets that seamlessly integrate into business intelligence tools, ERP systems, and analytics platforms. Whether tracking SKU-level pricing, competitor promotions, or retailer assortments, our solutions provide continuous visibility into evolving market dynamics.
Backed by the comprehensive insights delivered in the India FMCG Biscuit Category Pricing Report 2026, businesses can optimize pricing strategies, improve category management, strengthen promotional planning, and make faster data-driven decisions. Our scalable infrastructure, customized reporting, and dedicated technical support help organizations gain a lasting competitive advantage in India's rapidly evolving FMCG landscape.
Conclusion
The Indian biscuit market is becoming increasingly data-driven, requiring manufacturers and retailers to monitor pricing, promotions, SKU performance, and retailer strategies with greater precision than ever before. The India FMCG Biscuit Category Pricing Report 2026 equips decision-makers with comprehensive insights needed to optimize pricing, improve category performance, and strengthen competitive positioning across modern retail and quick-commerce channels.
With Product Data Scrape's advanced BigBasket Quick Commerce Scraper, enterprise-grade Web scraping API, tailored Custom Datasets, and intelligent instant data scraper, businesses can access accurate, real-time market intelligence that supports smarter pricing and merchandising decisions.
Ready to unlock actionable FMCG pricing intelligence? Contact Product Data Scrape today to access customized retail data solutions and transform your market strategy with reliable, real-time insights.



 Singapore
 EMAIL
EMAIL
 PHONE
PHONE


.webp "thumb")








.webp)