Executive Summary
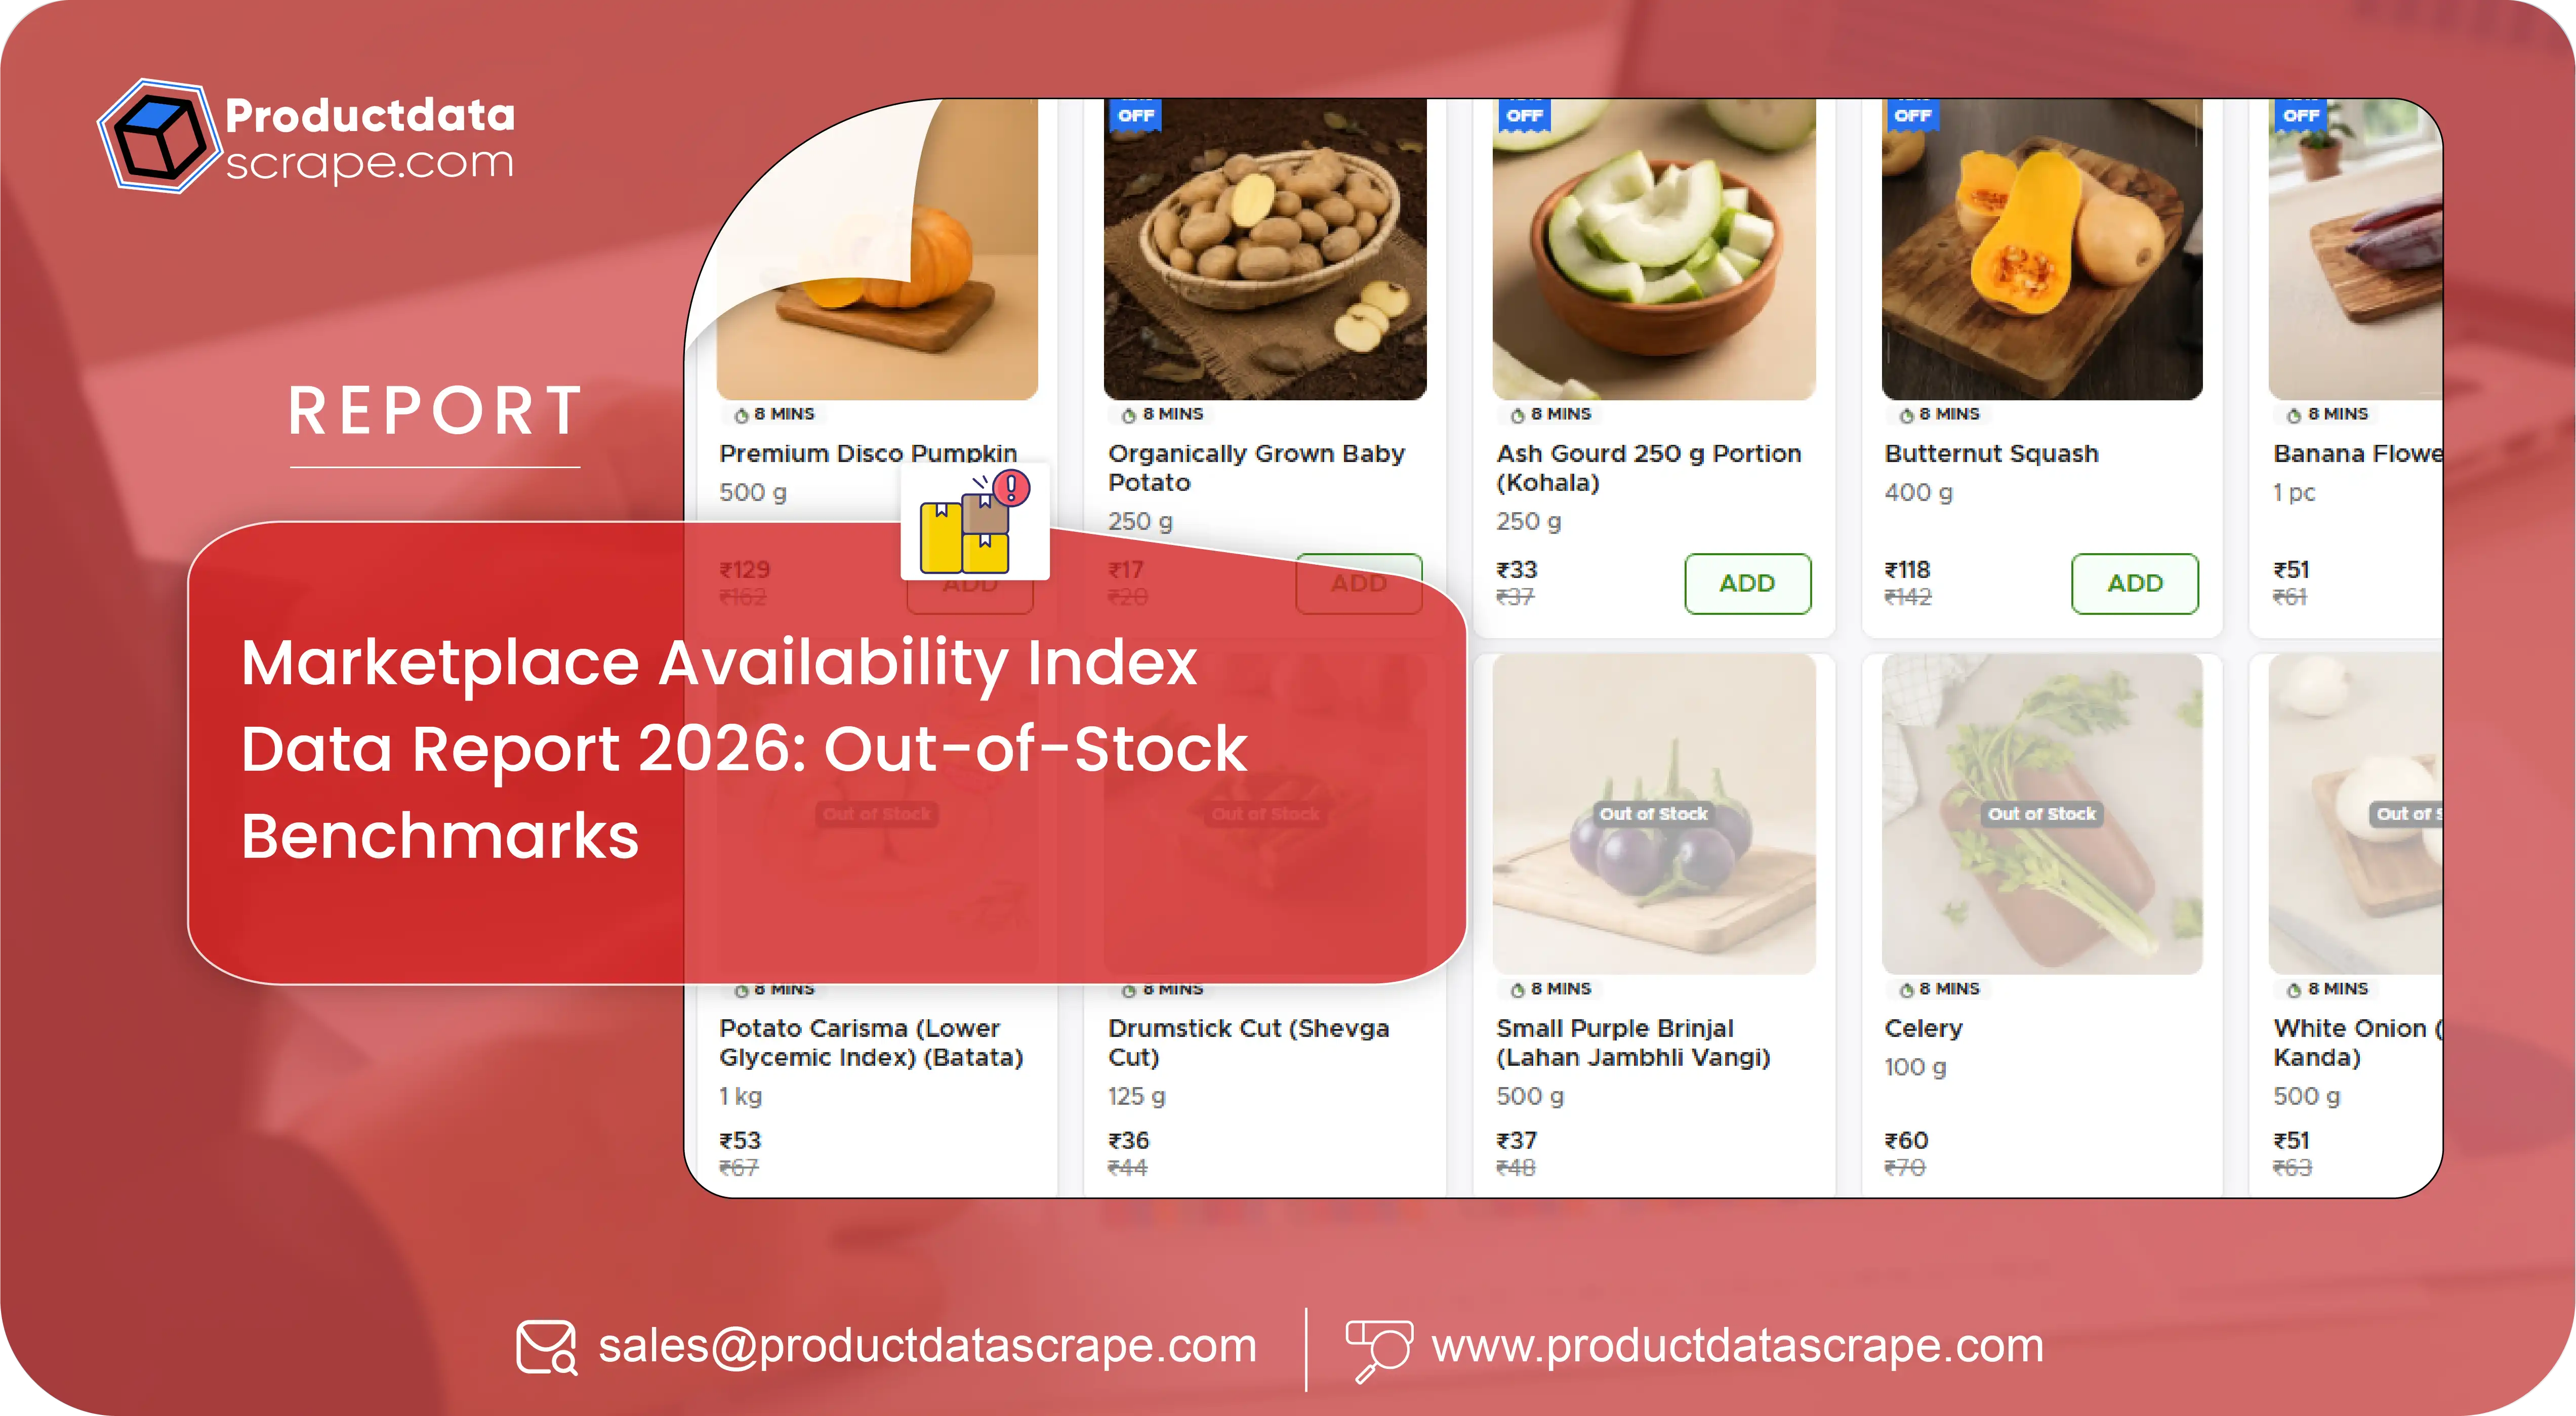
Availability is where sales quietly disappear. A product that is out of stock cannot convert, and every hour a hero SKU sits unavailable hands its demand to a competitor one click away. Yet most brands measure availability in occasional spot checks that miss the regional and time-based gaps entirely. This report from Product Data Scrape uses large-scale Marketplace Availability Index Data to benchmark out-of-stock rates, restock speed, and availability volatility across categories and regions in 2026.
The figures below are representative benchmarks drawn from Product Data Scrape's managed monitoring across major e-commerce and quick-commerce platforms. They are designed to help supply, e-commerce, and category teams understand availability risk — not to replace a scoped audit of a specific catalog.
Why Availability Is Harder to See Than Price

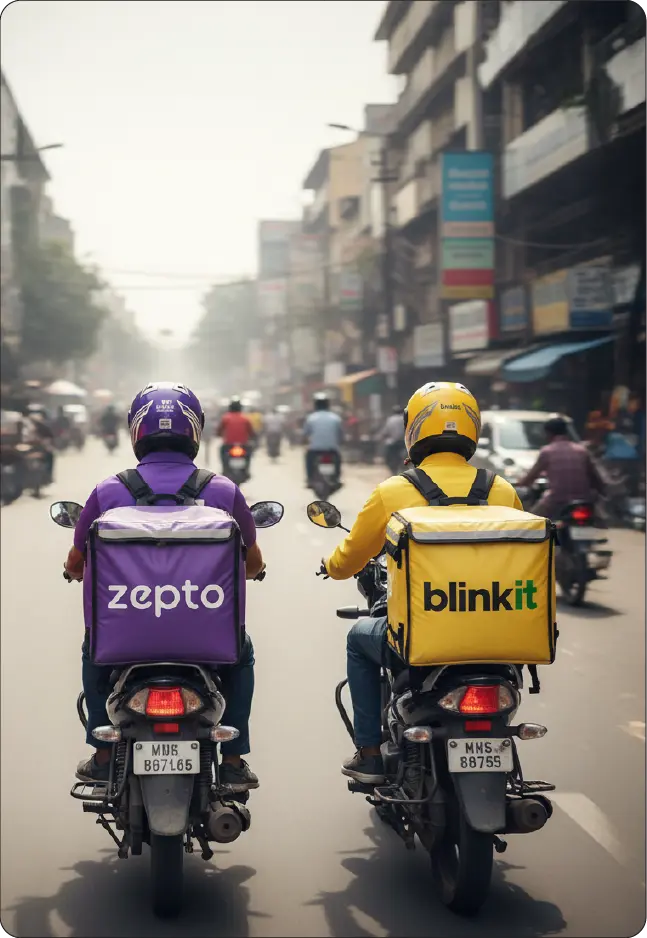
Price is visible on every listing; availability hides. A national storefront may show a product in stock while it is unavailable in half the delivery zones that matter, and quick commerce makes this worse — the same SKU can be stocked in one pincode's dark store and missing from the next. A brand checking availability from a single location sees a reassuring picture that does not match what most shoppers actually experience.
Availability also changes by the hour during sale events and demand spikes, so a check that was accurate this morning can be wrong by evening. Only continuous, location-aware monitoring captures the true state of the shelf, and that is exactly what the Marketplace Availability Index Data in this report is built to measure.
What This Report Measures
For this study, Product Data Scrape tracked availability across essentials, electronics, beauty, and home categories on leading e-commerce and quick-commerce platforms, checking stock status at listing level and, for quick commerce, at pincode level. Each product is monitored repeatedly through the day, so the dataset captures not just whether something is out of stock but how often and for how long.
For every SKU and location, the dataset records stock status, time to restock, frequency of out-of-stock events, and an availability index that scores each product from zero to one hundred based on how consistently it is buyable. Rolled up by category and region, these signals reveal where availability is stable, where it is fragile, and how much demand is lost to gaps.
Key Findings
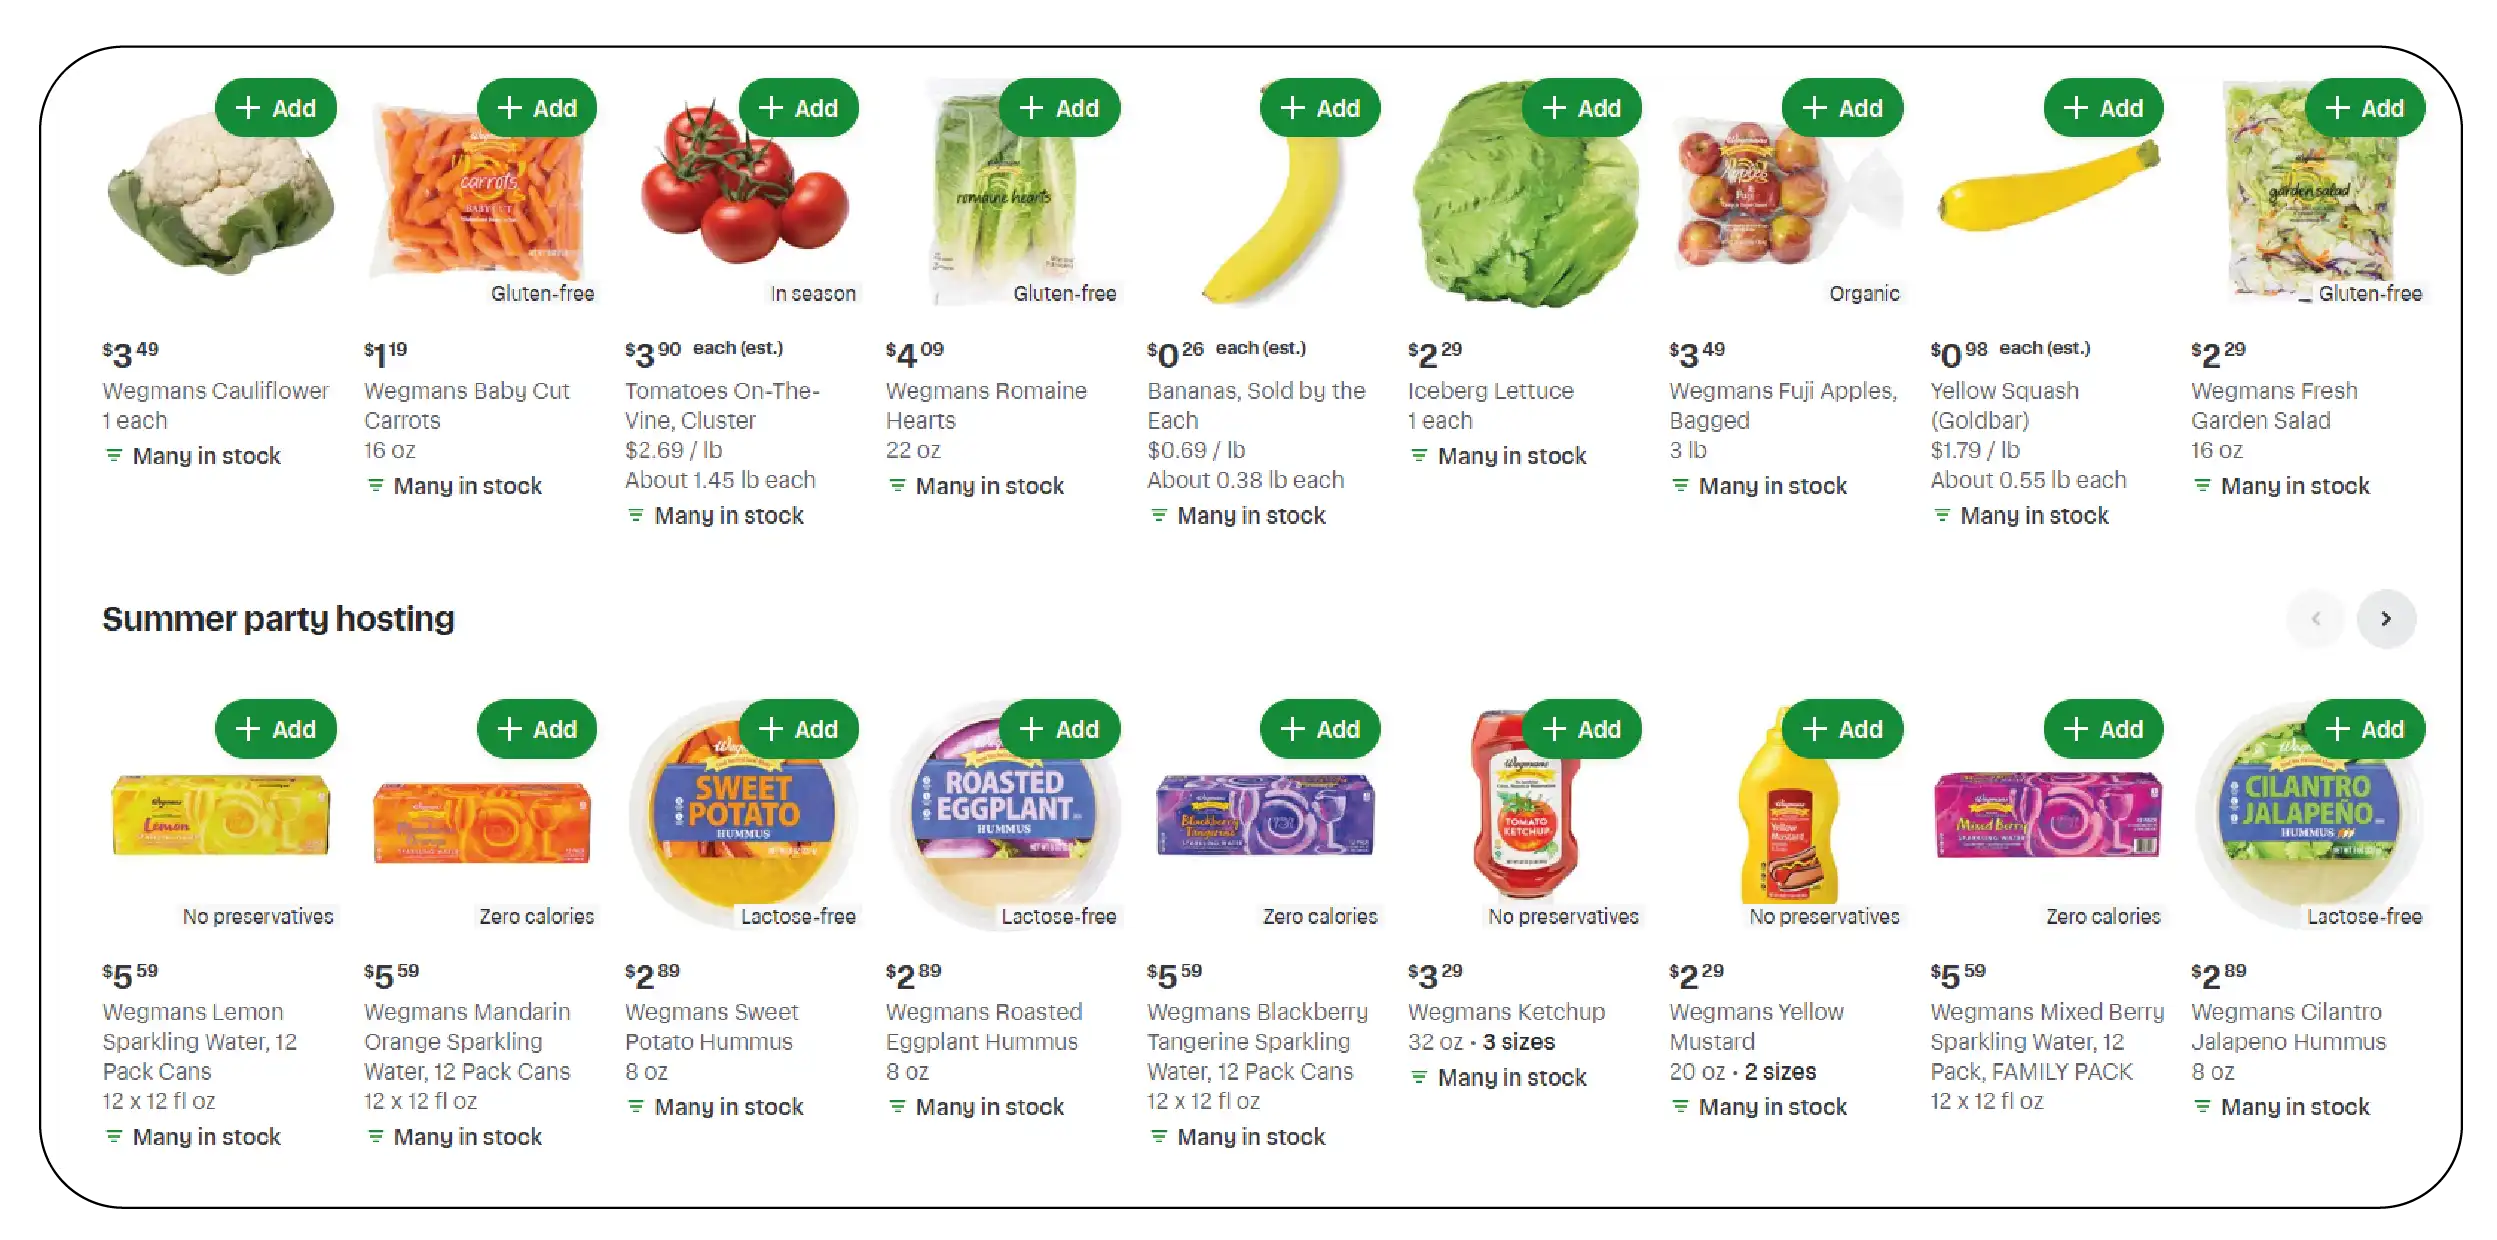
The 2026 monitoring data surfaces several consistent patterns across categories:
Quick commerce is the most fragile. Pincode-level checks reveal far higher out-of-stock rates than national storefronts suggest, because availability varies dark store by dark store.
Essentials churn constantly. Fast-moving consumables show frequent short out-of-stock events, so the risk is not one long outage but many small ones that add up.
Restock speed varies widely. Some categories recover within hours while others take days, and the slow recoverers are where the most demand quietly leaks away.
Availability collapses during events. During major sales, out-of-stock rates spike sharply on hero SKUs, exactly when traffic and lost-sale cost are highest.
National views hide regional gaps. A product reading as in stock at the national level is frequently unavailable across a meaningful share of individual pincodes.
Together, these findings show that availability is a regional, time-sensitive metric — and that any brand measuring it at the national level is systematically under-counting its lost sales.
Sample Data: Availability by Category and Region
The value of Marketplace Availability Index Data is in the location-aware record behind every SKU. Below is a representative sample of the structured output Product Data Scrape delivers.
| Category |
Marketplace |
Region / Pincode |
OOS Rate |
Avg Restock |
Availability Index |
Captured |
| Packaged Snacks |
Quick-Comm |
400001 (Mumbai) |
18% |
6 hrs |
74 |
2026-07-14 |
| True Wireless Earbuds |
Amazon |
National |
7% |
2 days |
88 |
2026-07-14 |
| Baby Diapers |
Quick-Comm |
560001 (Bengaluru) |
22% |
5 hrs |
69 |
2026-07-13 |
| Face Wash |
Nykaa |
National |
5% |
1 day |
91 |
2026-07-13 |
| Cooking Oil 1L |
Quick-Comm |
110001 (Delhi) |
26% |
8 hrs |
63 |
2026-07-12 |
Every row is timestamped and location-aware, so supply and e-commerce teams can see exactly where and when availability breaks down, and how quickly the shelf recovers.
How Brands Use Marketplace Availability Index Data
Brands that monitor availability continuously use the data to protect conversion. First, they set alerts on hero SKUs, so a stockout on a top product in a key region triggers action within hours instead of surfacing in a weekly report after the sales are already lost.
Second, they prioritize replenishment by impact. Rather than treating every out-of-stock event equally, they use the availability index and lost-sale estimates to route inventory to the SKUs and regions where gaps cost the most. Third, they hold marketplace and fulfillment partners accountable with objective, location-level data on how often products go unavailable and how long they take to recover.
Category and supply teams also use the same feed to plan for events, pre-positioning stock in the pincodes and categories the data flags as most fragile during previous sale windows. In every case, availability shifts from an occasional check to a managed, measurable metric.
What Changed in Availability in 2026
Quick commerce has made availability both more important and more volatile. As dark-store networks expand pincode by pincode, the number of distinct locations where a product can be in or out of stock has multiplied, and each operates on its own fast-moving inventory cycle. A brand that once tracked availability across a handful of fulfillment centers now has thousands of micro-locations to consider, and the national storefront view hides almost all of that variation.
Demand volatility has grown too. Compressed sale events, flash promotions, and social-driven demand spikes can empty a hero SKU in hours, precisely when the cost of being unavailable is highest. The brands that manage availability well in 2026 treat it as a live, location-aware operational metric rather than a periodic audit — because the gaps that matter open and close far faster than any manual check can catch. Continuous, pincode-level monitoring is what makes that possible.
Marketplace Availability Index Data FAQs
Why isn't a national in-stock check enough? Because a product reading as in stock nationally is frequently unavailable across many individual pincodes. Only location-level checks reveal the true buyable rate.
How is the availability index calculated? It scores each product from zero to one hundred based on how consistently it is buyable over time, combining out-of-stock frequency and restock speed into one comparable number.
How often can availability be checked? Multiple times per day for fast-moving categories, so short but frequent out-of-stock events are captured rather than missed.
Methodology and Data Quality
The findings in this report are built from listing-level data collected by Product Data Scrape's managed pipelines, not from surveys or estimates. Products are captured directly from live marketplace pages at scale, normalized into a consistent schema, and matched across platforms so that every comparison is genuinely like-for-like. Prices, availability, and other fields are recorded with a timestamp, which makes it possible to measure change over time rather than relying on a single snapshot that is out of date the moment it is taken.
Every dataset passes automated validation before it is used. Duplicate listings are removed, outliers are flagged for review, and records that fail consistency checks are re-collected rather than left to distort the results. Because the pipelines are monitored continuously, coverage adapts as marketplaces change their page structures, so the data stays reliable even as the sites underneath it evolve. This is what separates a defensible availability benchmark from a one-off manual scrape that cannot be repeated or trusted at scale.
Who This Report Is For
This report is written for supply and e-commerce teams, category managers, quick-commerce operators, and analysts measuring fulfillment reliability. If a stockout in the wrong region or hour quietly costs you sales, the location-aware view here is built for exactly that problem.
What You Get With Product Data Scrape
Product Data Scrape delivers Marketplace Availability Index Data as a managed service across e-commerce and quick-commerce platforms, so teams do not have to build or maintain scrapers in-house. Coverage captures stock status at listing level and pincode level, with restock timing, out-of-stock frequency, and a rolled-up availability score.
Data is refreshed on a cadence you choose — up to multiple checks per day for fast-moving categories — and delivered in the format your team already uses, whether CSV, JSON, API feed, or dashboard. Because the pipelines are custom-built and monitored, coverage extends to new regions and marketplaces as you expand.
Get Your Availability Benchmarked
The figures in this report are representative; your real availability depends on your catalog, categories, and the regions you serve. Product Data Scrape will run a free sample dataset scoped to your SKUs and target locations, so you can see the exact fields, accuracy, and out-of-stock rates before committing to anything.
Request a sample to benchmark your availability — and turn Marketplace Availability Index Data into a system that protects conversion, prioritizes replenishment, and keeps your shelf reliably buyable.



 USA
USA
 EMAIL
EMAIL
 PHONE
PHONE














.webp)