Introduction
The Southeast Asia Shopee Marketplace Report examines marketplace pricing, product assortment, discounts, and availability to help retailers, brands, and e-commerce businesses identify competitive opportunities across regional markets. Using a structured Shopee Product Data Scraping API approach, businesses can collect product listings, prices, seller information, promotional details, and availability indicators to understand marketplace activity. The analysis focuses on Shopee Pricing & Assortment Trends SEA — TW/TH/SG, comparing Thailand and Singapore with Taiwan as a separate Asia-Pacific comparison market.
Shopee's growing marketplace business makes product-level intelligence increasingly important. According to Momentum Works, Southeast Asian platform e-commerce GMV reached US$157.6 billion in 2025, growing 22.8% year over year. Shopee retained its regional leadership with approximately 53% market share. These developments make pricing intelligence, catalog analysis, and competitive assortment monitoring valuable for brands and sellers.
Research scope: Thailand and Singapore are Southeast Asian markets. Taiwan is geographically part of East Asia, not Southeast Asia; it is included here as a comparative marketplace market rather than counted in Southeast Asian regional totals. Also, marketplace GMV, national e-commerce sales, and an individual seller's product prices are different measures and should not be combined as though they were equivalent.
How Has Marketplace Competition Changed Across the Region?
Marketplace competition across Southeast Asia has evolved from rapid customer acquisition toward greater emphasis on profitability, fulfillment, assortment quality, and customer retention. Shopee Marketplace Trend Analysis helps brands understand this shift by examining marketplace scale, competitive positioning, category activity, and product-level pricing.
Momentum Works reported that the region's eight leading e-commerce platforms generated US$114.6 billion in GMV in 2023, a 15% annual increase. In 2024, platform GMV reached US$128.4 billion, growing 12%. By 2025, it had reached US$157.6 billion, increasing 22.8%. Shopee maintained its leading position throughout this competitive environment.
For retailers, Assortment and availability monitoring provides another important perspective. Businesses need to understand not only which products are listed but also whether the same products remain available, how many variations are displayed, and how prices differ between sellers. A listing-level dataset can reveal changes that regional GMV figures cannot explain.
What do the verified regional figures show?
| Year | Southeast Asian platform GMV | Annual growth |
|---|
| 2020 | Not reproduced here without a consistent source series | — |
| 2021 | Not reproduced here | — |
| 2022 | Not reproduced here | — |
| 2023 | US$114.6 billion | 15% |
| 2024 | US$128.4 billion | 12% |
| 2025 | US$157.6 billion | 22.8% |
| 2026 | Full-year figure not yet available | — |
Momentum Works' 2024, 2025, and 2026 Southeast Asia e-commerce reports. Figures refer to platform GMV, not Shopee-only GMV or national retail sales.
These figures show why businesses should compare multiple indicators. Regional growth identifies the broader opportunity, while product-level monitoring helps determine which categories, brands, and price points are attracting marketplace activity.
For decision-makers, useful indicators include:
- Category-level product counts and assortment coverage.
- Current prices and historical price changes.
- Seller participation and product duplication.
- Discount frequency and promotional depth.
- Product availability and displayed variations.
- Differences between local marketplace currencies and price points.
A combined view of these indicators helps brands identify competitive gaps and make better-informed regional merchandising decisions.
What Makes Product Catalog Data Important in the Taiwan Market?
Taiwan provides an important comparison market for brands assessing marketplace assortment and regional consumer preferences. Its digital retail environment includes Shopee alongside established e-commerce platforms, creating opportunities for sellers to compare product positioning and category coverage.
SEA Shopee Product Catalog Intelligence helps businesses organize product listings into standardized records. These records can include product names, brands, categories, prices, seller details, discounts, product variations, and listing URLs. For companies evaluating Taiwan, Shopee Taiwan Price Monitoring can help identify differences between regular and promotional prices and compare similar products across sellers.
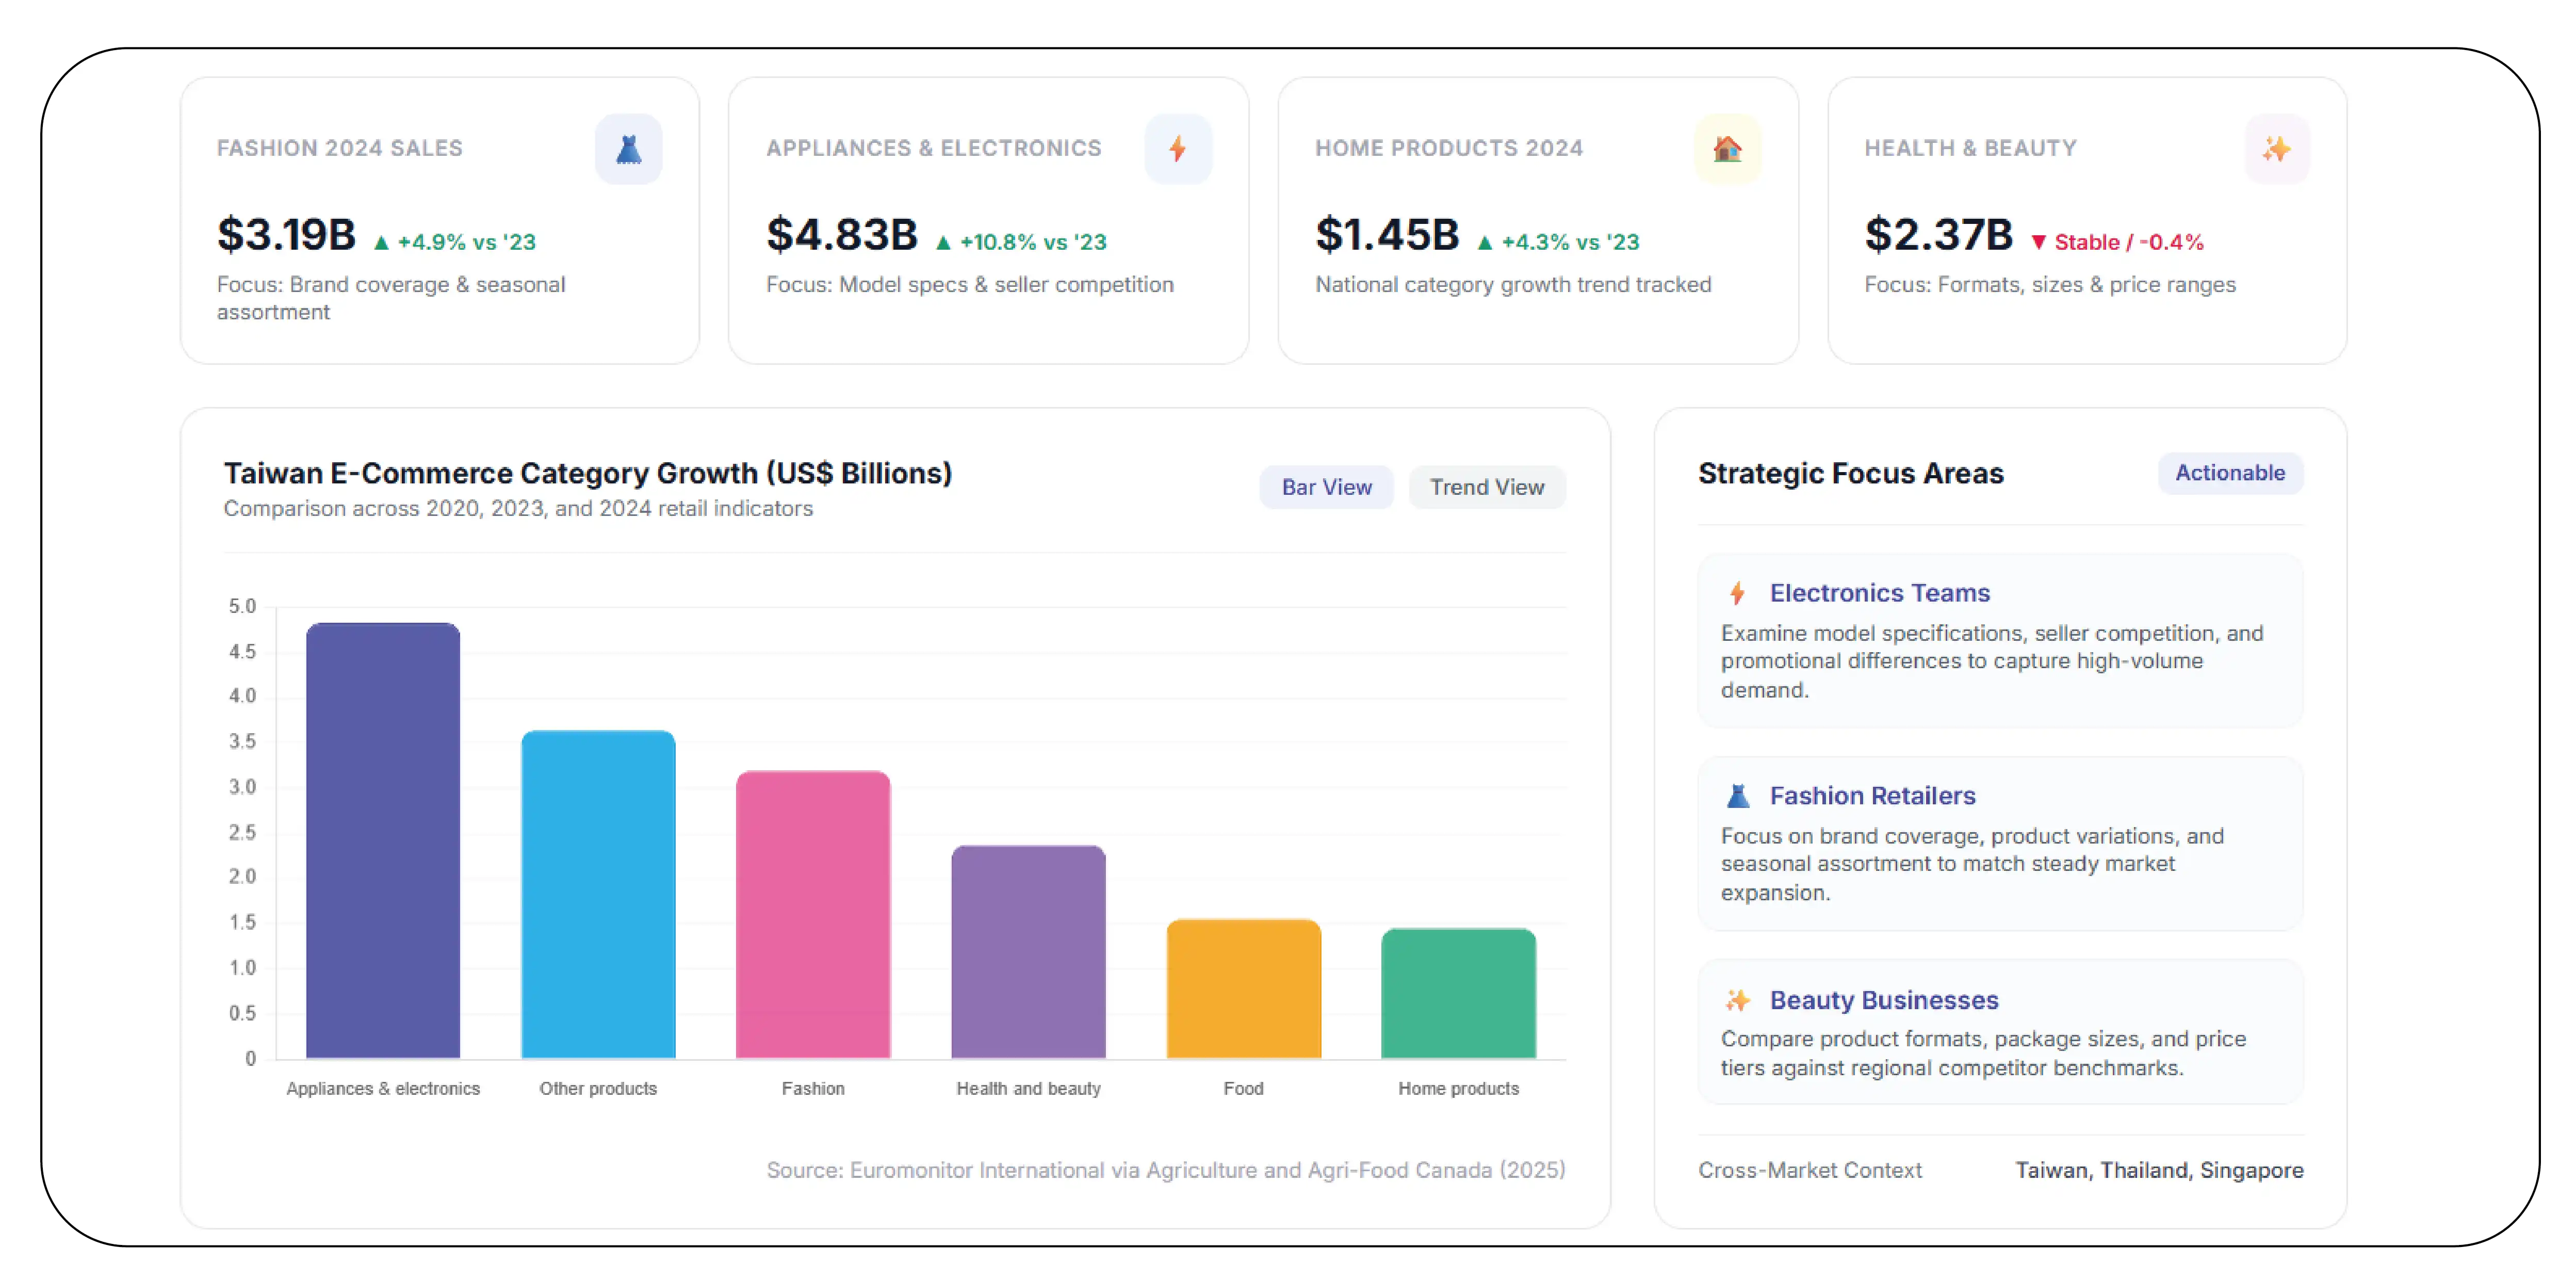
According to Agriculture and Agri-Food Canada, using Euromonitor data, Taiwan's retail e-commerce market reached US$17.53 billion in 2024. Fashion e-commerce generated US$3.19 billion, while appliances and electronics reached US$4.83 billion. The data highlights the importance of analyzing individual product categories rather than treating the marketplace as one uniform segment.
How has Taiwan's e-commerce market developed?
| Year | Retail e-commerce sales (US$ billion) |
|---|
| 2020 | 12.86 |
| 2021 | 15.69 |
| 2022 | 16.91 |
| 2023 | 16.96 |
| 2024 | 17.53 |
| 2025 | 18.33* |
| 2026 | No verified full-year figure |
*2025 is a forecast published in the 2025 Euromonitor-based market report, not a confirmed result. Source: Agriculture and Agri-Food Canada.
For marketplace research, businesses should compare the following information:
- Product assortment: Number and types of products available within each category.
- Price positioning: Differences between comparable products and brands.
- Seller competition: Number of sellers offering similar products.
- Promotional activity: Discount percentages and displayed campaign prices.
- Product variations: Available sizes, colors, models, and specifications.
These indicators help brands understand how Taiwan's marketplace differs from Thailand and Singapore. They also support more accurate assortment decisions when businesses are considering regional expansion.
Which Product and Category Indicators Reveal Consumer Opportunities?
Product assortment analysis helps brands understand what retailers offer, how products are categorized, and where competitive opportunities may exist. Taiwan Shopee Assortment Intelligence can organize listing information into comparable product groups, helping businesses evaluate category coverage and identify differences between competing sellers.
A useful approach is to examine product-level information alongside national category trends. For example, Taiwan's fashion e-commerce sales reached US$3.19 billion in 2024, compared with US$3.04 billion in 2023. Home products reached US$1.45 billion, increasing from US$1.39 billion in 2023. These figures are broader retail category measurements, not Shopee-specific sales.
The Southeast Asia Shopee Marketplace Report can use these market indicators to establish context for product-level comparisons across Taiwan, Thailand, and Singapore.
Which categories demonstrate measurable market opportunities?
| Taiwan e-commerce category | 2020 (US$ bn) | 2023 (US$ bn) | 2024 (US$ bn) |
|---|
| Fashion | 2.99 | 3.04 | 3.19 |
| Health and beauty | 2.07 | 2.38 | 2.37 |
| Appliances and electronics | 2.92 | 4.36 | 4.83 |
| Food | 1.21 | 1.48 | 1.55 |
| Home products | 0.96 | 1.39 | 1.45 |
| Other products | 2.43 | 3.86 | 3.64 |
Euromonitor International, reproduced in Agriculture and Agri-Food Canada's 2025 Taiwan e-commerce report. Figures are rounded.
Businesses can use these category indicators to prioritize deeper marketplace research. Electronics teams may examine model specifications, seller competition, and promotional differences. Fashion retailers may focus on brand coverage, product variations, and seasonal assortment. Beauty businesses may compare product formats, sizes, and price ranges.
A structured product dataset should also distinguish between product count and product availability. A product appearing in a catalog does not necessarily mean every variation is available for purchase.
For accurate comparisons, businesses should retain product identifiers, seller names, timestamps, category labels, and currency information. These fields help analysts identify duplicate listings and avoid comparing unrelated products.
How Do Thailand and Singapore Differ in Online Retail Pricing?
Thailand and Singapore offer different market conditions for marketplace sellers. Thailand has a large domestic e-commerce ecosystem, while Singapore provides a smaller but highly connected retail environment with measurable online sales penetration.
Shopee Thailand & Singapore Price Monitoring helps brands examine local product prices, promotional activity, and seller competition separately rather than applying one regional pricing assumption.
Thailand's National Economic and Social Development Council reported that e-commerce value was estimated at THB 630 billion in 2023 and THB 690 billion in 2024, representing estimated growth of 9.5%. The same report recorded an increase in the combined revenue of six major parcel delivery companies from THB 103.5 billion in 2023 to THB 118 billion in 2024.
Singapore's Department of Statistics reported that online retail sales represented 13.4% of total retail sales in December 2024. By September 2026, the proportion had reached 17.7%. These are monthly online-sales shares, not Shopee market shares.
What do the country-level indicators show?
| Year | Thailand e-commerce value | Singapore online retail share |
|---|
| 2020 | No comparable figure used | 2020 annual series available |
| 2021 | No comparable figure used | 2021 annual series available |
| 2022 | No comparable figure used | 2022 annual series available |
| 2023 | THB 630 billion | 2023 monthly series available |
| 2024 | THB 690 billion | 13.4% in December |
| 2025 | No confirmed comparable figure used | Monthly series published |
| 2026 | Full-year figure unavailable | 17.7% in September |
Thailand NESDC and Singapore Department of Statistics. Singapore figures represent online retail's share of total retail sales for the specified month, not an annual average. Historical figures are not supplied where a comparable verified value is unavailable.
For pricing teams, these differences make country-specific data collection essential. A product listed at the same nominal price across markets may have different competitive positioning after local currency conversion, taxes, shipping, and promotional adjustments.
Recommended comparison fields include:
- Local currency and displayed product price.
- Original price and promotional price.
- Seller information and seller location where published.
- Product ratings and review counts where accessible.
- Shipping fees and delivery estimates.
- Available product variations and listing status.
This approach helps businesses make more informed pricing decisions while preserving the differences between national retail indicators and marketplace-specific observations.
How Can Businesses Compare Listings Across Three Markets?
Cross-market product research becomes challenging when marketplaces use different product names, currencies, categories, and listing formats. A standardized collection process helps businesses compare equivalent products and understand differences in pricing and assortment.
Shopee TW TH SG Product Catalog Scraping can capture publicly accessible listing information from the relevant country marketplaces. The collection process should preserve local product identifiers, seller information, prices, product descriptions, category labels, and timestamps.
The Southeast Asia Shopee Marketplace Report provides a useful framework for organizing these observations into country-level comparisons.
The importance of marketplace intelligence is reinforced by regional platform growth. Momentum Works reported that Shopee held approximately 52% of Southeast Asian platform e-commerce GMV in 2024. Its 2026 report placed the platform's 2025 regional share at approximately 53%. These figures indicate Shopee's strong regional position, although they should not be interpreted as market shares for Taiwan or individual product categories.
What should a cross-market comparison include?
| Comparison dimension | Taiwan | Thailand | Singapore |
|---|
| Price currency | TWD | THB | SGD |
| Product identity | Local product ID and SKU | Local product ID and SKU | Local product ID and SKU |
| Catalog coverage | Category and product listings | Category and product listings | Category and product listings |
| Promotional data | Displayed discounts | Displayed discounts | Displayed discounts |
| Availability | Listing and variation status | Listing and variation status | Listing and variation status |
| Seller intelligence | Seller details | Seller details | Seller details |
| Historical tracking | Timestamped observations | Timestamped observations | Timestamped observations |
A reliable comparison workflow should follow several steps.
- Identify comparable products: Use brand names, model numbers, SKUs, and product attributes to match equivalent listings.
- Standardize product categories: Apply consistent category labels across all three markets.
- Normalize currencies: Preserve original prices and calculate converted values using a documented exchange-rate source and date.
- Record promotional differences: Separate regular prices, displayed discounts, and voucher-based offers.
- Validate availability: Distinguish active listings from unavailable products and removed listings.
- Maintain historical snapshots: Store collection timestamps to identify changes over time.
This structure helps retailers evaluate market positioning, find pricing gaps, identify product assortment differences, and support regional expansion decisions.
How Does a Unified Dataset Support Regional Business Decisions?
A unified dataset connects product information, pricing, seller details, and availability across multiple marketplaces. It allows analysts to evaluate changes over time and create consistent reports for merchandising, pricing, and competitive intelligence teams.
A Southeast Asia Marketplace Pricing Dataset should preserve the original listing information while providing standardized fields for analysis. It should also distinguish between observed marketplace data and broader market statistics.
Sea Limited's financial disclosures provide useful context for the scale of Shopee's operations. In 2025, Shopee recorded US$127.4 billion in GMV, up 26.8% year over year, and 13.9 billion gross orders, up 27.2%. In the third quarter of 2026, Shopee recorded US$39.7 billion in GMV, a 23.3% year-over-year increase.
What verified growth indicators should decision-makers consider?
| Period | Shopee GMV | Gross orders |
|---|
| 2020 | No comparable figure included | — |
| 2021 | No comparable figure included | — |
| 2022 | No comparable figure included | — |
| 2023 | No comparable figure included | — |
| 2024 | US$100.5 billion | 10.9 billion |
| 2025 | US$127.4 billion | 13.9 billion |
| Q3 2026 | US$39.7 billion | 4.5 billion |
Sea Limited financial disclosures. Q3 2026 is a quarterly figure, not a full-year result. The historical figures for 2020–2023 are intentionally omitted rather than estimated.
For businesses, this growth context makes structured marketplace research valuable. A unified dataset can support:
- Pricing intelligence: Compare regular prices, discounts, and historical movements.
- Assortment planning: Identify category coverage and missing product variations.
- Seller benchmarking: Compare seller participation and listing competition.
- Promotional analysis: Identify recurring discount patterns and campaign changes.
- Market expansion: Evaluate local product positioning before entering a new marketplace.
- Management reporting: Create country-level dashboards and category performance summaries.
The dataset should undergo validation before business use. Duplicate listings, missing product identifiers, inconsistent currencies, and incomplete availability records can distort comparisons. Retaining source URLs and collection timestamps makes the resulting analysis more transparent and auditable.
Product Data Scrape helps businesses transform fragmented marketplace listings into structured retail intelligence. Its Real-Time Shopee Product Data Scraping capabilities can support customized collection of product details, seller information, pricing, discounts, and availability indicators across selected markets. Businesses can request country-specific datasets, standardized product attributes, historical price records, and reporting formats aligned with their analytical requirements. Data validation and product matching help improve consistency across marketplaces. This enables retailers, manufacturers, distributors, and e-commerce teams to make informed decisions about competitive pricing, product assortment, promotional strategies, and regional expansion.
Conclusion
Marketplace intelligence helps brands understand regional pricing differences, product assortment, seller competition, and promotional activity. A structured research approach combining Taiwan, Thailand, and Singapore observations can reveal opportunities that individual marketplace checks may overlook.
The Shopee Product Data Scraper approach enables businesses to organize listing information into actionable datasets for pricing analysis, assortment planning, and competitive benchmarking.
Ready to strengthen your regional marketplace strategy? Contact Product Data Scrape today to discuss customized data collection, cross-market price monitoring, and product catalog intelligence for your business!


 Singapore
 EMAIL
 PHONE











.webp)