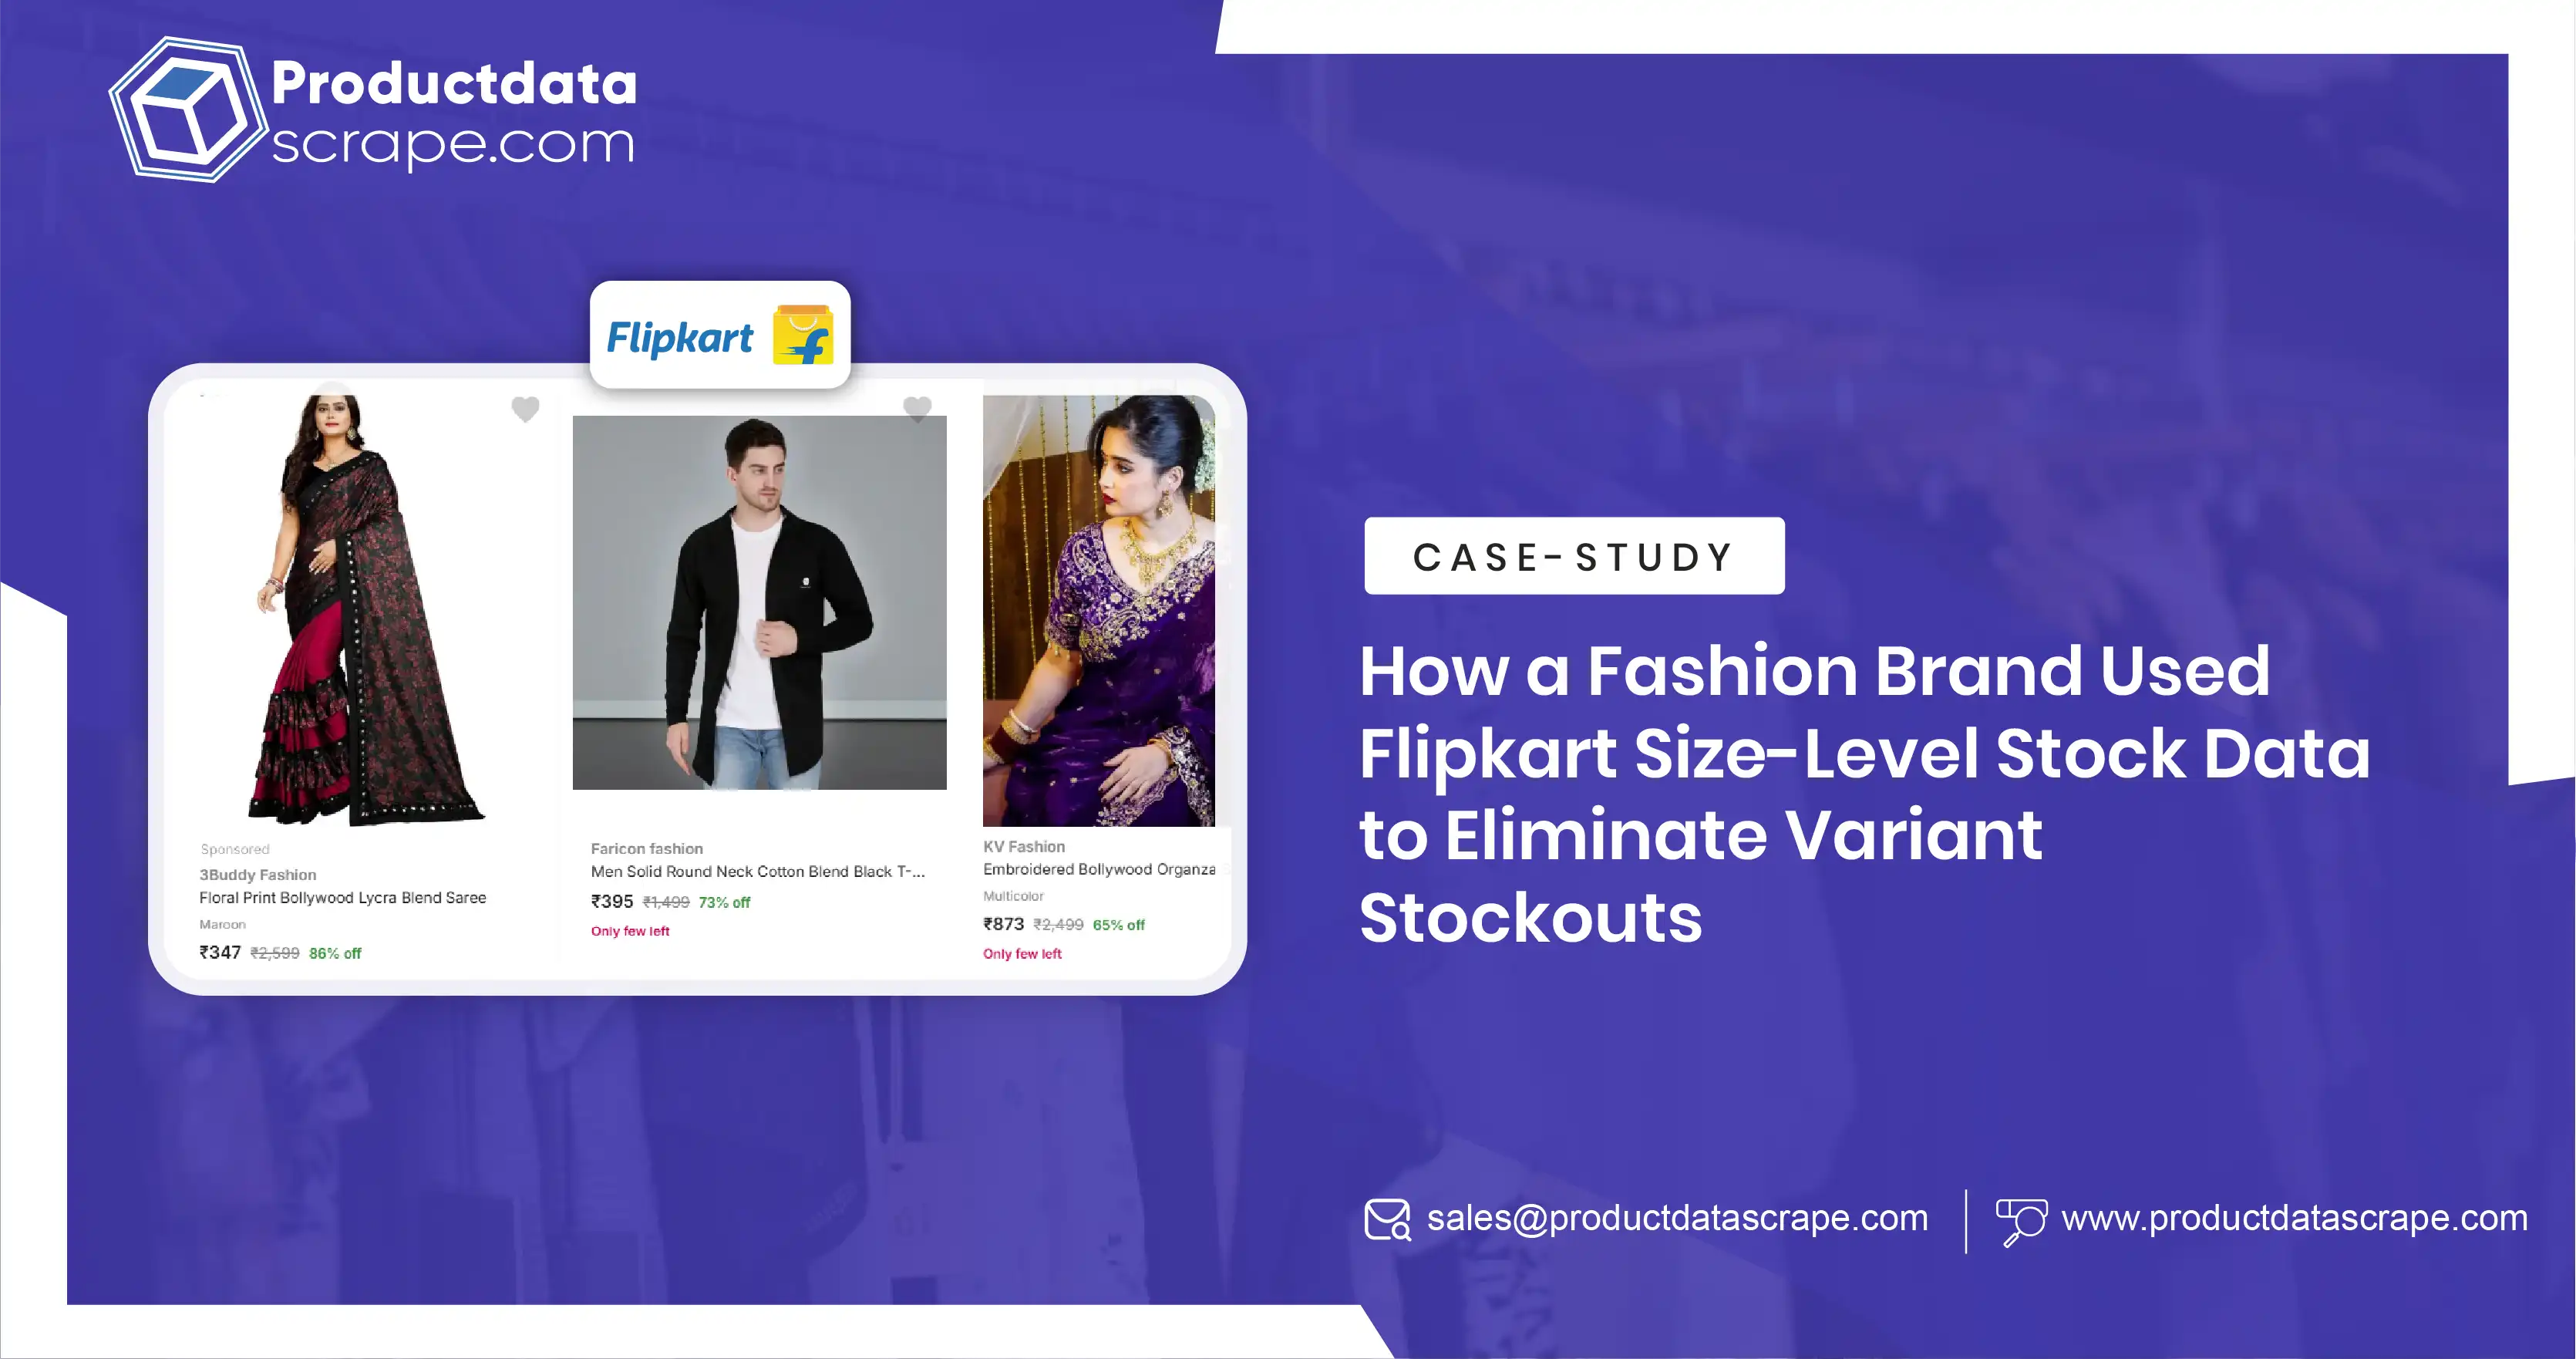
How a Fashion Brand Used Flipkart Size-Level Stock Data to Eliminate Variant Stockouts

The Client

A mid-market Indian apparel brand — men's and women's casualwear, roughly 340 active styles on Flipkart, sold through two authorised sellers. Flipkart was the brand's largest online channel by volume.

Client details are anonymised. Figures are representative of the engagement.

The Problem: Healthy Listings, Collapsing Conversion
The Problem

The brand's marketing team raised the alarm first, and they raised it about the wrong thing.

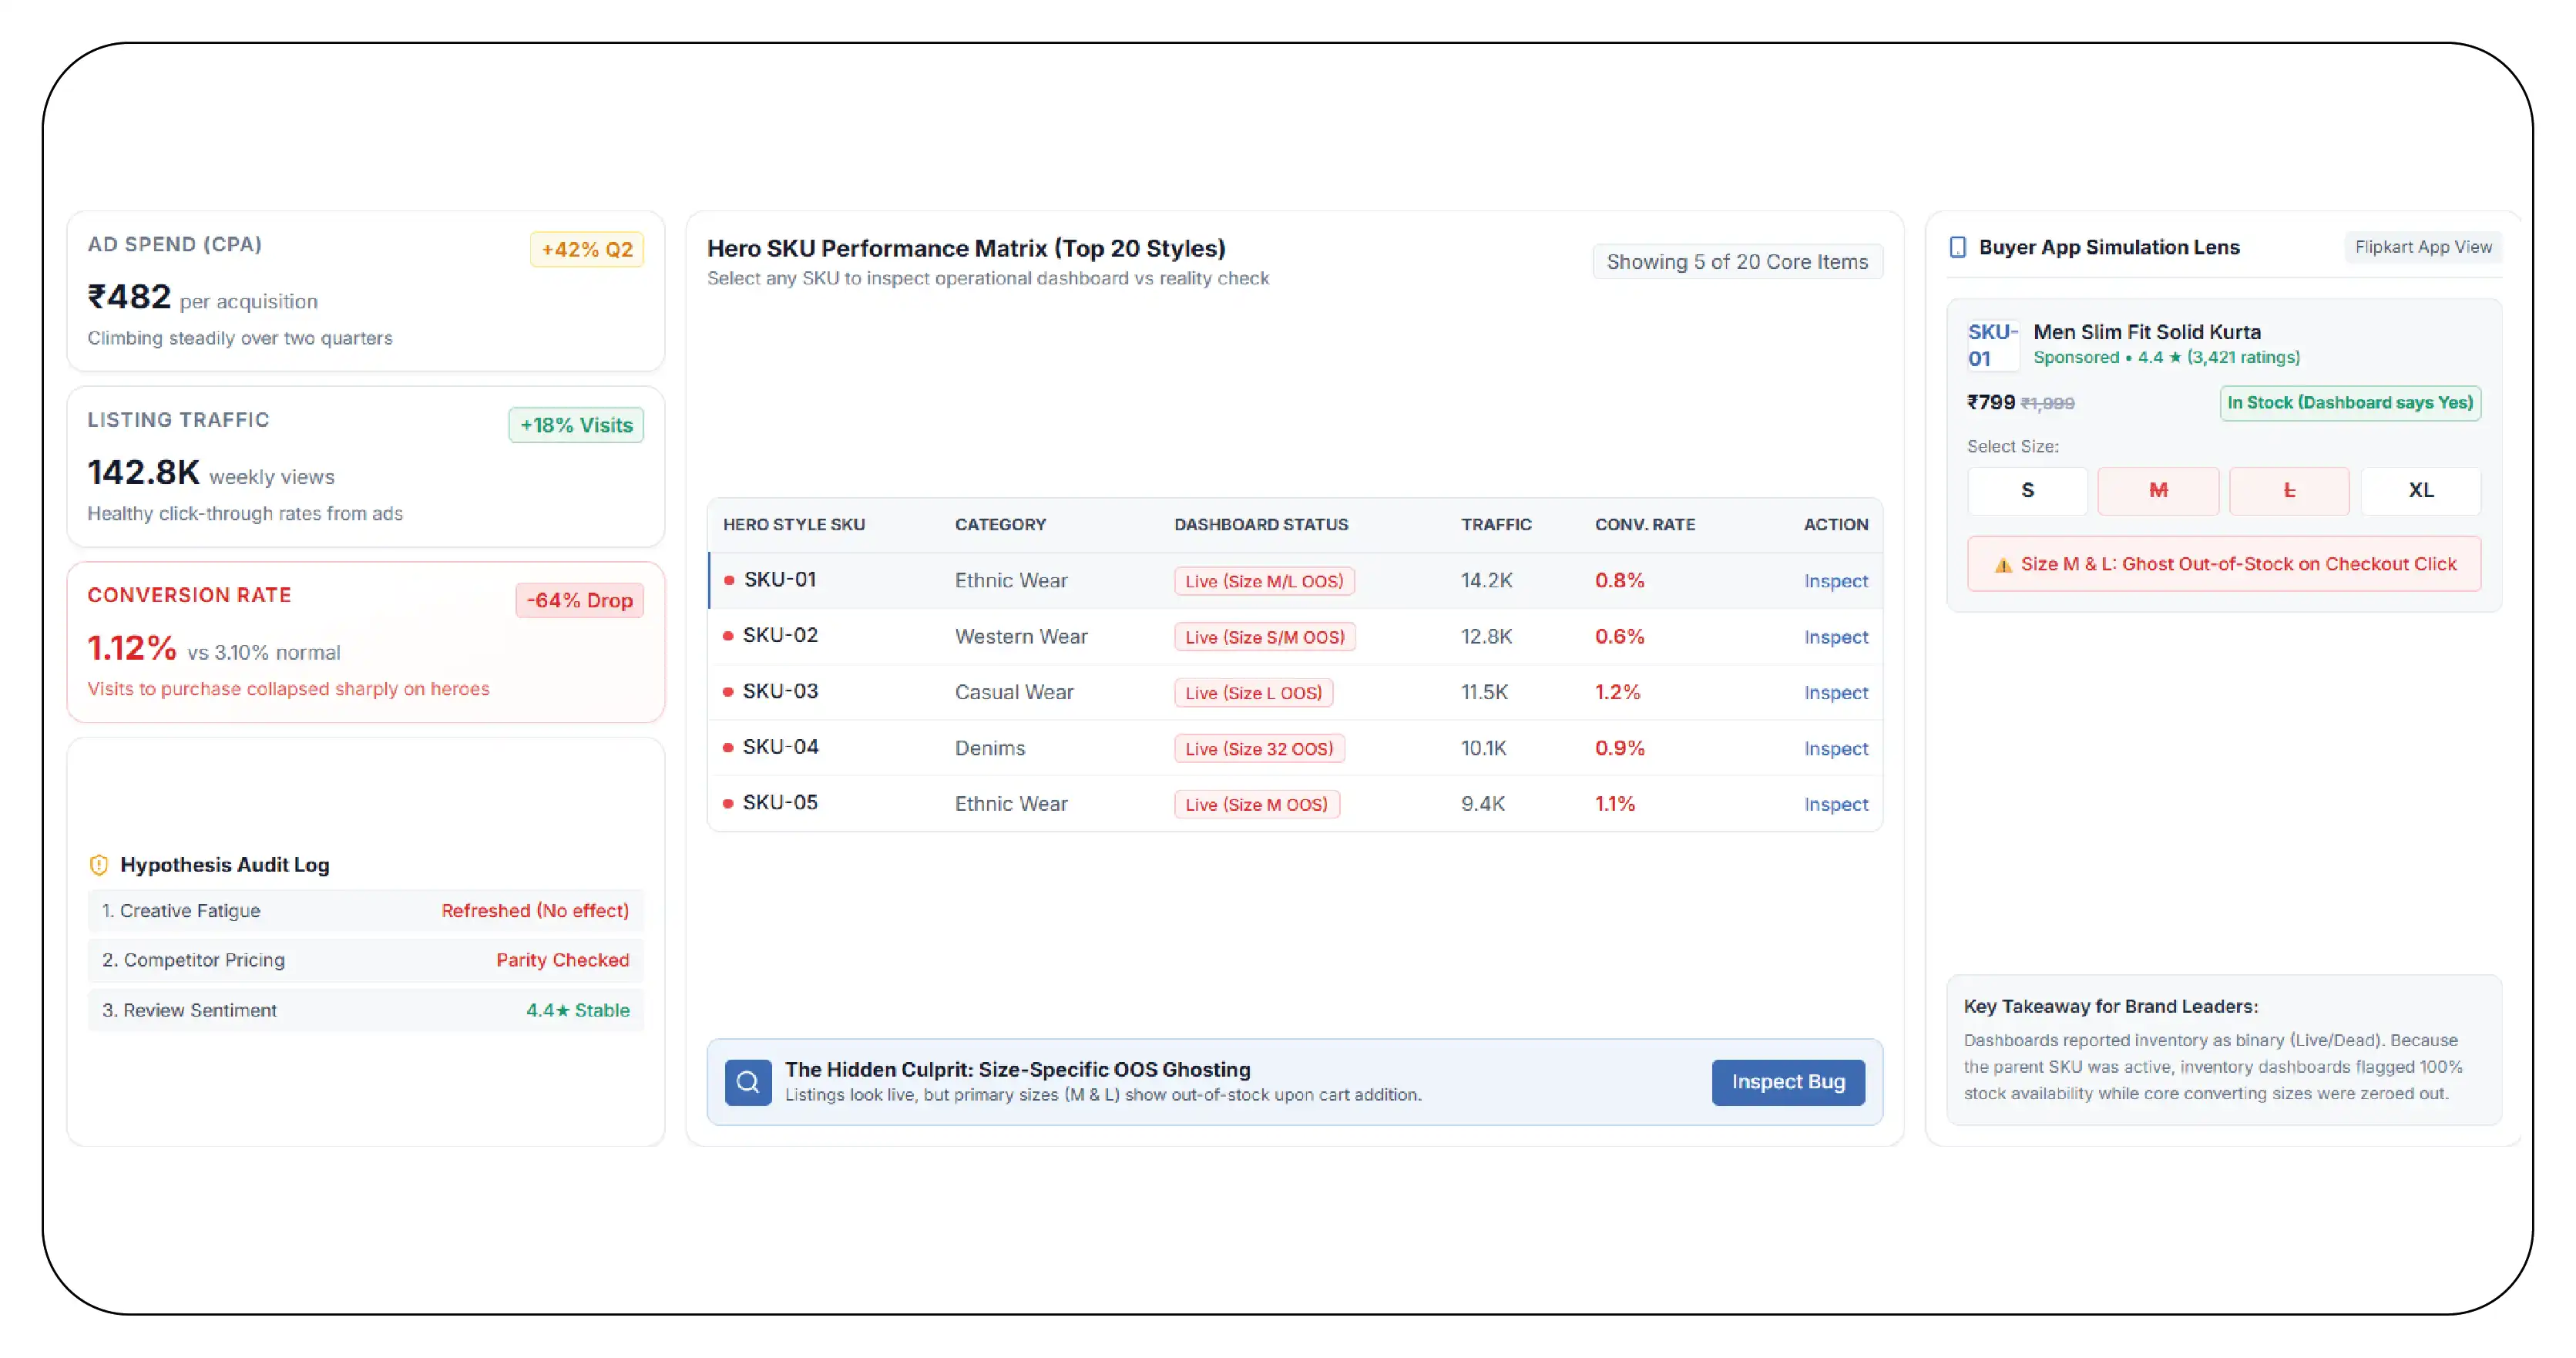
Cost per acquisition on Flipkart had been climbing for two quarters. Ad spend was up. Click-through rate was steady. Traffic to the brand's listings was actually growing. But conversion — visits to purchase — had fallen sharply on the hero styles, the twenty or so items that carried a disproportionate share of the brand's volume.

The initial hypothesis was creative fatigue. The images were refreshed. Conversion did not move.

The second hypothesis was pricing. A competitor was assumed to be undercutting. A price audit found nothing — the brand was at or below parity on every hero style.

The third hypothesis was reviews. Also nothing.

Throughout all of this, the brand's inventory dashboard showed every hero style in stock. Nobody questioned it, because there was nothing to question. The listings were live. The products were available. The dashboard said so.

The Diagnosis: The Dashboard Was Telling the Truth and Saying Nothing

Product Data Scrape ran a variant-level diagnostic across the brand's 20 hero styles.

The pipeline the brand had been using captured one row per product page — the standard output of a general-purpose scraper. It recorded in_stock: true if any variant of the style was purchasable.

For a t-shirt with five sizes and four colours, that is twenty independent stock realities collapsed into one boolean.

Here is what the first capture found on the brand's single highest-volume style. Illustrative figures.

Size Navy Black White Olive Purchasable in any colour?
S Yes
M Only in white
L No
XL Yes
XXL Yes

product_level_in_stock: true

Size L was unpurchasable in every colour. Size M was purchasable in exactly one colour — and it was white, historically the brand's weakest-selling colour on that style.

M and L together accounted for the majority of the style's historical unit sales.

The timestamped capture history answered the question the brand had been unable to answer for two quarters: the L stockout had been continuous for 26 days. M had been partially out for 19.

The conversion collapse was not a creative problem, a pricing problem, or a review problem. Roughly six out of ten customers arriving on the listing were arriving to buy a size that did not exist. They bounced. The brand paid for every one of those clicks.

Scaled Across the Catalogue

The full pass across all 340 styles:

  • 73 styles were reporting in_stock: true while missing at least one of their top-two-selling sizes.
  • 31 styles were missing both of their top-two sizes.
  • Median duration of an undetected size stockout: 17 days.
  • 11 styles had a size that had been out of stock for more than 45 consecutive days — long enough that the size curve in the replenishment plan had, in effect, silently been rewritten by neglect.
  • On 19 styles, a size was available only from the secondary seller at a different price, meaning the brand's own price ladder had broken without anyone noticing.

The brand's supply team had been planning replenishment against a size curve derived from sales data. But sales data cannot record a sale that could not be made. Size L had been out of stock, so size L had not sold, so the sales data showed weak L demand, so the replenishment plan allocated less L — which produced more L stockouts.

The forecast had been eating itself for the better part of a year.

The Solution: Variant-Level Capture With Duration
The Solution

Product Data Scrape deployed variant-level monitoring across the full catalogue:

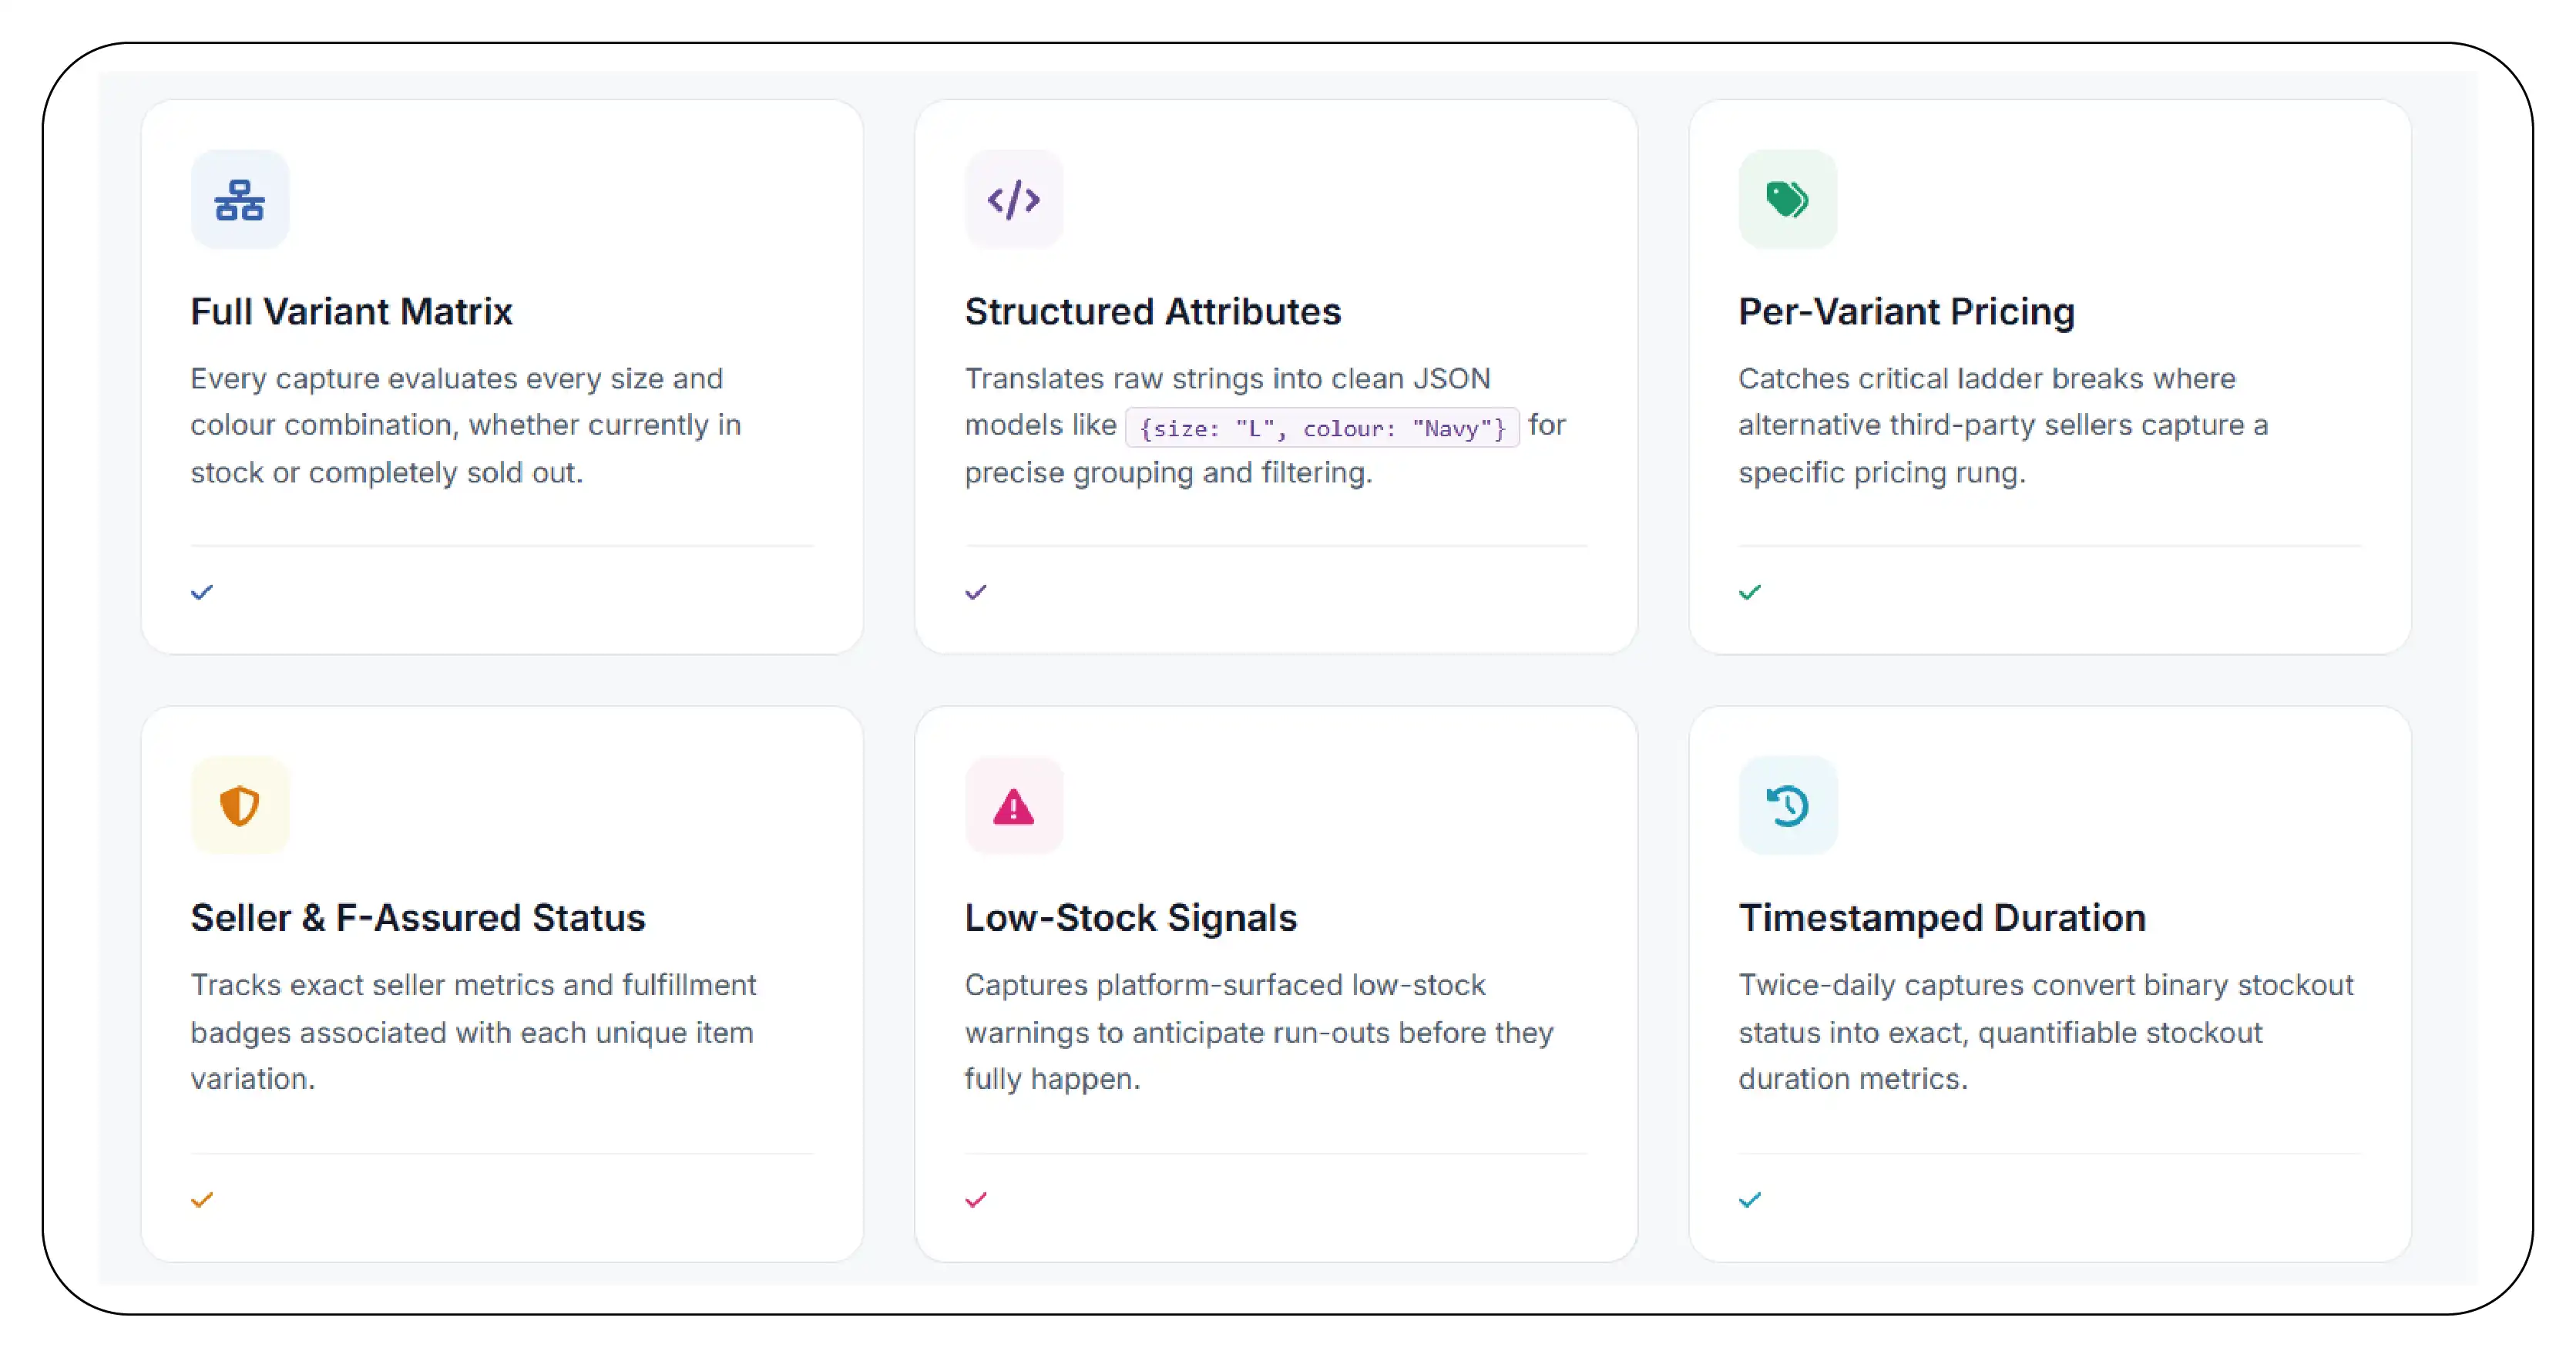
  • Full variant matrix on every capture — every size, every colour, whether or not it was in stock.
  • Structured variant attributes — {size: "L", colour: "Navy"} rather than the display string, so the matrix could be grouped, filtered, and matched against a competitor basket.
  • Per-variant price, catching ladder breaks where a different seller held a rung.
  • Per-variant seller and F-Assured status.
  • Low-stock signals where the platform surfaced them.
  • Timestamped capture, twice daily, converting stockout status into stockout duration.
  • Competitor variant matrices on the same schema across a matched basket of 60 competing styles.
  • Three alerts, with named owners:
    • Any hero style loses a top-two size → supply lead, same day.
    • Any size out for more than 72 hours → supply lead, escalated.
    • Any variant price diverges from the ladder → marketplace lead.

Sample Data: The Alert

{
  "alert_type": "hero_size_stockout",
  "product_id": "TSHRT9K2QP7WZXY",
  "title": "BrandF Cotton Crew Neck T-Shirt",
  "fired_at": "2026-04-18T08:00:00+05:30",

  "product_level_in_stock": true,

  "affected_variants": [
    {"variant_label": "L / Navy",  "out_since": "2026-04-15T20:00:00+05:30", "hours_out": 60, "velocity_rank": 1},
    {"variant_label": "L / Black", "out_since": "2026-04-16T08:00:00+05:30", "hours_out": 48, "velocity_rank": 3},
    {"variant_label": "M / Navy",  "out_since": "2026-04-17T20:00:00+05:30", "hours_out": 12, "velocity_rank": 2}
  ],

  "size_L_purchasable_any_colour": false,
  "estimated_daily_units_at_risk": 41,
  "escalate_to": "supply_lead"
}

Two and a half days after the first size went out, an alert landed with a named owner, a unit-at-risk estimate, and the fact — stated plainly — that size L could not be bought at all.

Previously, the equivalent event had gone undetected for 26 days.

What the Brand Did

Immediate — Emergency replenishment. The 31 styles missing both top-two sizes were prioritised for expedited allocation to the authorised sellers.

Week 2 — Rebuilt the size curve. This was the structural fix, and it was the one that mattered most. The replenishment plan had been built on sales data corrupted by stockouts. The team rebuilt it using demand-adjusted velocity: for any period in which a size was unavailable, the sales figure was treated as censored rather than as zero. The revised curve allocated substantially more M and L than the original.

Week 3 — Ladder repair. The 19 styles with a broken price rung were corrected with the secondary seller.

Ongoing — Alerting. Size-level stockouts now escalate within 72 hours to a supply lead with authority to release held allocation without approval.

Quarter 2 — Competitive assortment. With the competitor variant matrices in hand, the merchandising team found 14 size-and-colour combinations that competitors listed consistently and the brand did not — including two extended sizes that had never been part of the range.

The Results (One Quarter)

Metric Before After One Quarter
Hero styles missing a top-two size 73 of 340 9 of 340
Median undetected size-stockout duration 17 days Under 2 days
Styles with a broken price ladder 19 2
Conversion rate, hero styles, indexed 100 139
Cost per acquisition, indexed 100 74
Revenue, hero styles, indexed 100 147

Figures are representative of the engagement outcome.

Conversion up 39 percent. Cost per acquisition down 26 percent. Revenue on hero styles up 47 percent.

The brand did not change its images, its prices, its ad spend, or its creative. It made the sizes people wanted buyable.

The Lesson

The brand had spent two quarters and a meaningful amount of money diagnosing a conversion problem, and it had looked in every place except the one where the answer was.

The reason is worth naming, because it generalises: the dashboard was not wrong. in_stock: true was a true statement. It was simply a statement about a unit — the product page — that has no commercial meaning. Nobody buys a product page. They buy a size.

The most dangerous data is not the data that is wrong. It is the data that is accurate, and answers a question nobody asked.

Work With Product Data Scrape

Product Data Scrape delivers Flipkart size-level stock data across the full variant matrix — per-variant stock and price, structured variant attributes, per-variant seller and badge status, low-stock signals, timestamped capture that converts stockouts into durations, and matched competitor variant matrices.

If your listings are "in stock" and your conversion is falling, we will run a variant-level diagnostic on your hero styles. In our experience it takes one capture to find the problem.

Product Data Scrape — turning marketplace complexity into decision-ready data.

LATEST BLOG

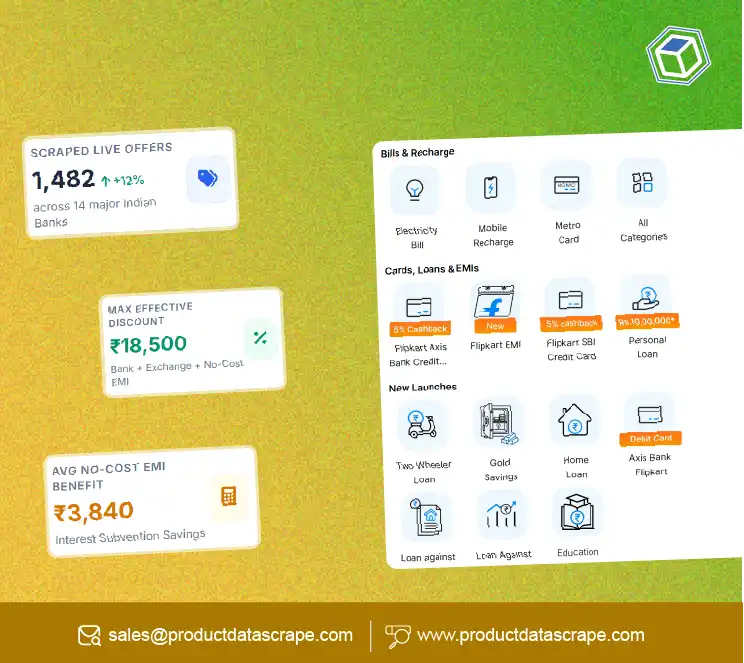
Flipkart Bank Offers Data: Scraping EMI, Exchange, and Discount Terms to Calculate Effective Consumer Price

Flipkart bank offers data, no-cost EMI and exchange discounts decide what a customer really pays. Learn which fields to capture and how to compute effective price.

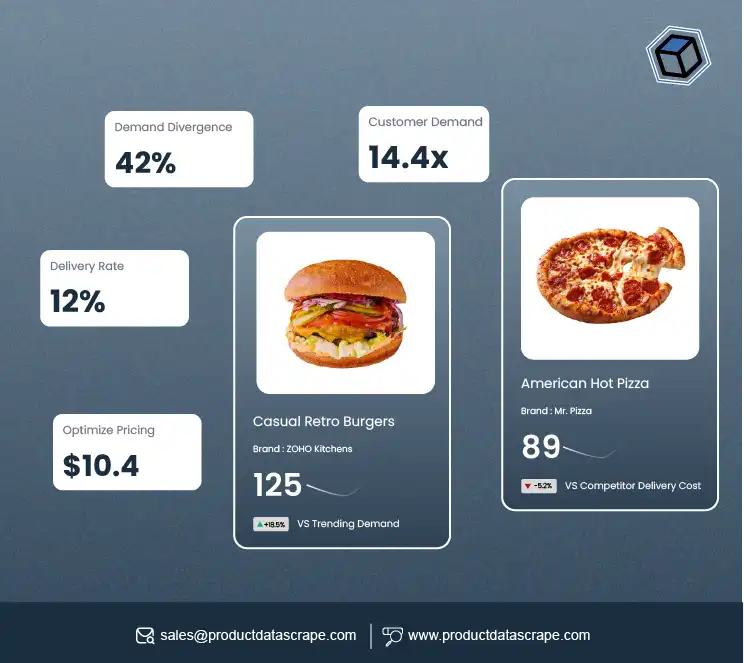
How Food Delivery Business Data Before Launch Helps Optimize Pricing, Delivery Zones, and Customer Demand

Food Delivery Business Data Before Launch helps analyze demand, competitors, pricing, and delivery zones for a successful market entry.

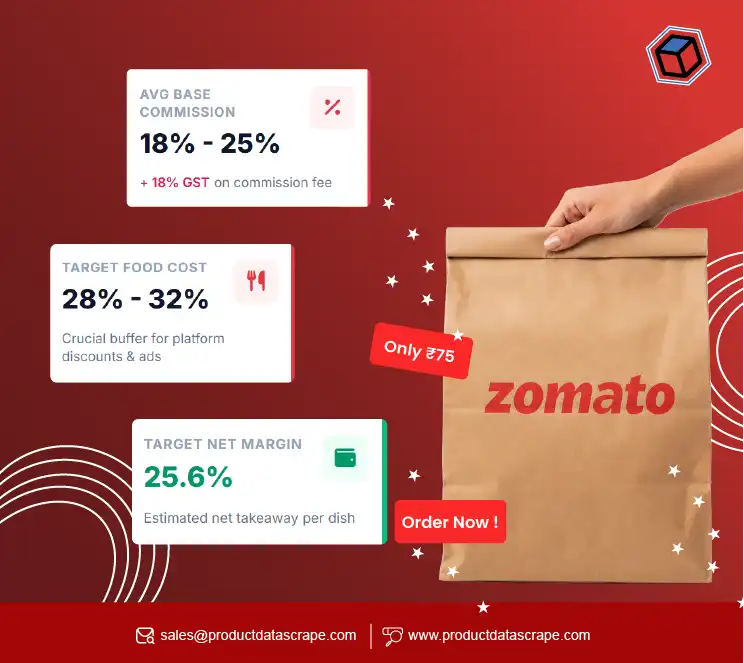
Analyze Zomato Delivery Pricing Before Opening a Restaurant - A Complete Guide to Smarter Restaurant Launch Planning

Analyze Zomato Delivery Pricing Before Opening a Restaurant to optimize menu pricing, delivery costs, profits, and market positioning.

Case Studies

Discover our scraping success through detailed case studies across various industries and applications.

WHY CHOOSE US?
Product Data Scrape for Retail Web Scraping

Choose Product Data Scrape to access accurate data, enhance decision-making, and boost your online sales strategy effectively.

Reliable Insights

Reliable Insights

With our Retail Data scraping services, you gain reliable insights that empower you to make informed decisions based on accurate product data and market trends.

Data Efficiency

Data Efficiency

We help you extract Retail Data product data efficiently, streamlining your processes to ensure timely access to crucial market information and operational speed.

Market Adaptation

Market Adaptation

By leveraging our Retail Data scraping, you can quickly adapt to market changes, giving you a competitive edge with real-time analysis and responsive strategies.

Price Optimization

Price Optimization

Our Retail Data price monitoring tools enable you to stay competitive by adjusting prices dynamically, attracting customers while maximizing your profits effectively.

Competitive Edge

Competitive Edge

THIS IS YOUR KEY BENEFIT.
With our competitive price tracking, you can analyze market positioning and adjust your strategies, responding effectively to competitor actions and pricing in real-time.

Feedback Analysis

Feedback Analysis

Utilizing our Retail Data review scraping, you gain valuable customer insights that help you improve product offerings and enhance overall customer satisfaction.

5-Step Proven Methodology

How We Scrape E-Commerce Data?

01
Identify Target Websites

Identify Target Websites

Begin by selecting the e-commerce websites you want to scrape, focusing on those that provide the most valuable data for your needs.

02
Select Data Points

Select Data Points

Determine the specific data points to extract, such as product names, prices, descriptions, and reviews, to ensure comprehensive insights.

03
Use Scraping Tools

Use Scraping Tools

Utilize web scraping tools or libraries to automate the data extraction process, ensuring efficiency and accuracy in gathering the desired information.

04
Data Cleaning

Data Cleaning

After extraction, clean the data to remove duplicates and irrelevant information, ensuring that the dataset is organized and useful for analysis.

05
Analyze Extracted Data

Analyze Extracted Data

Once cleaned, analyze the extracted e-commerce data to gain insights, identify trends, and make informed decisions that enhance your strategy.

Start Your Data Journey
99.9% Uptime
GDPR Compliant
Real-time API

See the results that matter

Read inspiring client journeys

Discover how our clients achieved success with us.

6X

Conversion Rate Growth

“I used Product Data Scrape to extract Walmart fashion product data, and the results were outstanding. Real-time insights into pricing, trends, and inventory helped me refine my strategy and achieve a 6X increase in conversions. It gave me the competitive edge I needed in the fashion category.”

7X

Sales Velocity Boost

“Through Kroger sales data extraction with Product Data Scrape, we unlocked actionable pricing and promotion insights, achieving a 7X Sales Velocity Boost while maximizing conversions and driving sustainable growth.”

"By using Product Data Scrape to scrape GoPuff prices data, we accelerated our pricing decisions by 4X, improving margins and customer satisfaction."

"Implementing liquor data scraping allowed us to track competitor offerings and optimize assortments. Within three quarters, we achieved a 3X improvement in sales!"

Resource Hub: Explore the Latest Insights and Trends

The Resource Center offers up-to-date case studies, insightful blogs, detailed research reports, and engaging infographics to help you explore valuable insights and data-driven trends effectively.

Get In Touch

Flipkart Bank Offers Data: Scraping EMI, Exchange, and Discount Terms to Calculate Effective Consumer Price

Flipkart bank offers data, no-cost EMI and exchange discounts decide what a customer really pays. Learn which fields to capture and how to compute effective price.

How Food Delivery Business Data Before Launch Helps Optimize Pricing, Delivery Zones, and Customer Demand

Food Delivery Business Data Before Launch helps analyze demand, competitors, pricing, and delivery zones for a successful market entry.

Analyze Zomato Delivery Pricing Before Opening a Restaurant - A Complete Guide to Smarter Restaurant Launch Planning

Analyze Zomato Delivery Pricing Before Opening a Restaurant to optimize menu pricing, delivery costs, profits, and market positioning.

How a Q-Commerce Player Used Flipkart Quick Availability Data to Benchmark City by City

Flipkart Quick availability data let a q-commerce player benchmark dark store coverage, ETAs and assortment city by city — and find where it could actually win.

How a Fashion Brand Used Flipkart Size-Level Stock Data to Eliminate Variant Stockouts

Flipkart size-level stock data showed a fashion brand its bestsellers were sold out in the sizes that mattered. See how it recovered lost revenue in one quarter.

Scrape Furniture Competitor Price & Assortment Data to Improve Pricing Accuracy and Category Performance

Scrape Furniture Competitor Price & Assortment Data to monitor pricing, product assortments, and market trends for smarter retail decisions.

Albertsons Grocery Delivery Scraper API - Market Intelligence, Inventory Monitoring, and Grocery Retail Benchmarking

ASDA Grocery Data Scraping helps track grocery prices, promotions, inventory, and competitor trends across the UK retail market.

Costco Alcohol & Liquor Price Data scraping to Track Consumer Buying Trends and Inventory Intelligence

Costco Alcohol & Liquor Price Data scraping helps brands track pricing, promotions, inventory trends, and competitor insights.

B&M Stores Pet Supplies Data Scraping for Market Research and Pet Product Trend Analysis in Retail Chains

B&M Stores Pet Supplies Data Scraping helps businesses collect pricing, stock, and product insights to optimize pet retail strategies.

Reducing Returns with Myntra AND AJIO Customer Review Datasets

Analyzed Myntra and AJIO customer review datasets to identify sizing issues, helping brands reduce garment return rates by 8% through data-driven insights.

Before vs After Web Scraping - How E-Commerce Brands Unlock Real Growth

Before vs After Web Scraping: See how e-commerce brands boost growth with real-time data, pricing insights, product tracking, and smarter digital decisions.

Scrape Data From Any Ecommerce Websites

Easily scrape data from any eCommerce website to track prices, monitor competitors, and analyze product trends in real time with Real Data API.

Fresh Citrus Price Wars - Coles vs Aldi — What Does the Data Say?

Fresh Citrus Price Wars — Coles vs Aldi: data-driven comparison of prices, trends, and savings to see which retailer wins on value for shoppers.

Retail Inflation 2025 – Comparing Grocery Baskets in Dubai vs. Abu Dhabi (Noon)

Retail Inflation 2025 – Comparing Grocery Baskets in Dubai vs. Abu Dhabi (Noon) highlights price differences and real-world grocery costs across UAE cities.

Unlock Winning Products on Pinduoduo - How Scraping Bestseller Data Reveals Top Titles, Prices & Sales Trends

Scrape Pinduoduo bestseller data to analyze top-selling products, pricing trends, sales performance, for smarter eCommerce and intelligence decisions.

FAQs

E-Commerce Data Scraping FAQs

Our E-commerce data scraping FAQs provide clear answers to common questions, helping you understand the process and its benefits effectively.

E-commerce scraping services are automated solutions that gather product data from online retailers, providing businesses with valuable insights for decision-making and competitive analysis.

We use advanced web scraping tools to extract e-commerce product data, capturing essential information like prices, descriptions, and availability from multiple sources.

E-commerce data scraping involves collecting data from online platforms to analyze trends and gain insights, helping businesses improve strategies and optimize operations effectively.

E-commerce price monitoring tracks product prices across various platforms in real time, enabling businesses to adjust pricing strategies based on market conditions and competitor actions.

Get a free sample dataset

See the exact fields, accuracy and format — for your products, on your target sites — before you spend a rupee or a dollar.

  • Sample delivered within 24 hours
  • Scoped to your real use case, not a generic demo
  • No obligation, no long contract

Tell us what you need

A specialist replies within one business day.