Introduction
Businesses can identify trending products, monitor bestseller rankings, and analyze changing marketplace demand by collecting product information from authorized marketplace sources on a daily schedule. A Scrape Daily Top-Selling Product Data Feed workflow helps retailers, manufacturers, distributors, and market research companies understand which products are gaining visibility across online marketplaces.
However, collecting bestseller information from multiple platforms requires more than extracting product names and prices. Businesses must capture category rankings, product identifiers, brand information, displayed prices, discounts, ratings, reviews, and listing URLs while preserving the original marketplace context.
A Multi-site scraper for e-commerce stores can consolidate information from different sources into a standardized dataset. This makes it easier to compare product performance indicators, identify category-level changes, and evaluate competing products.
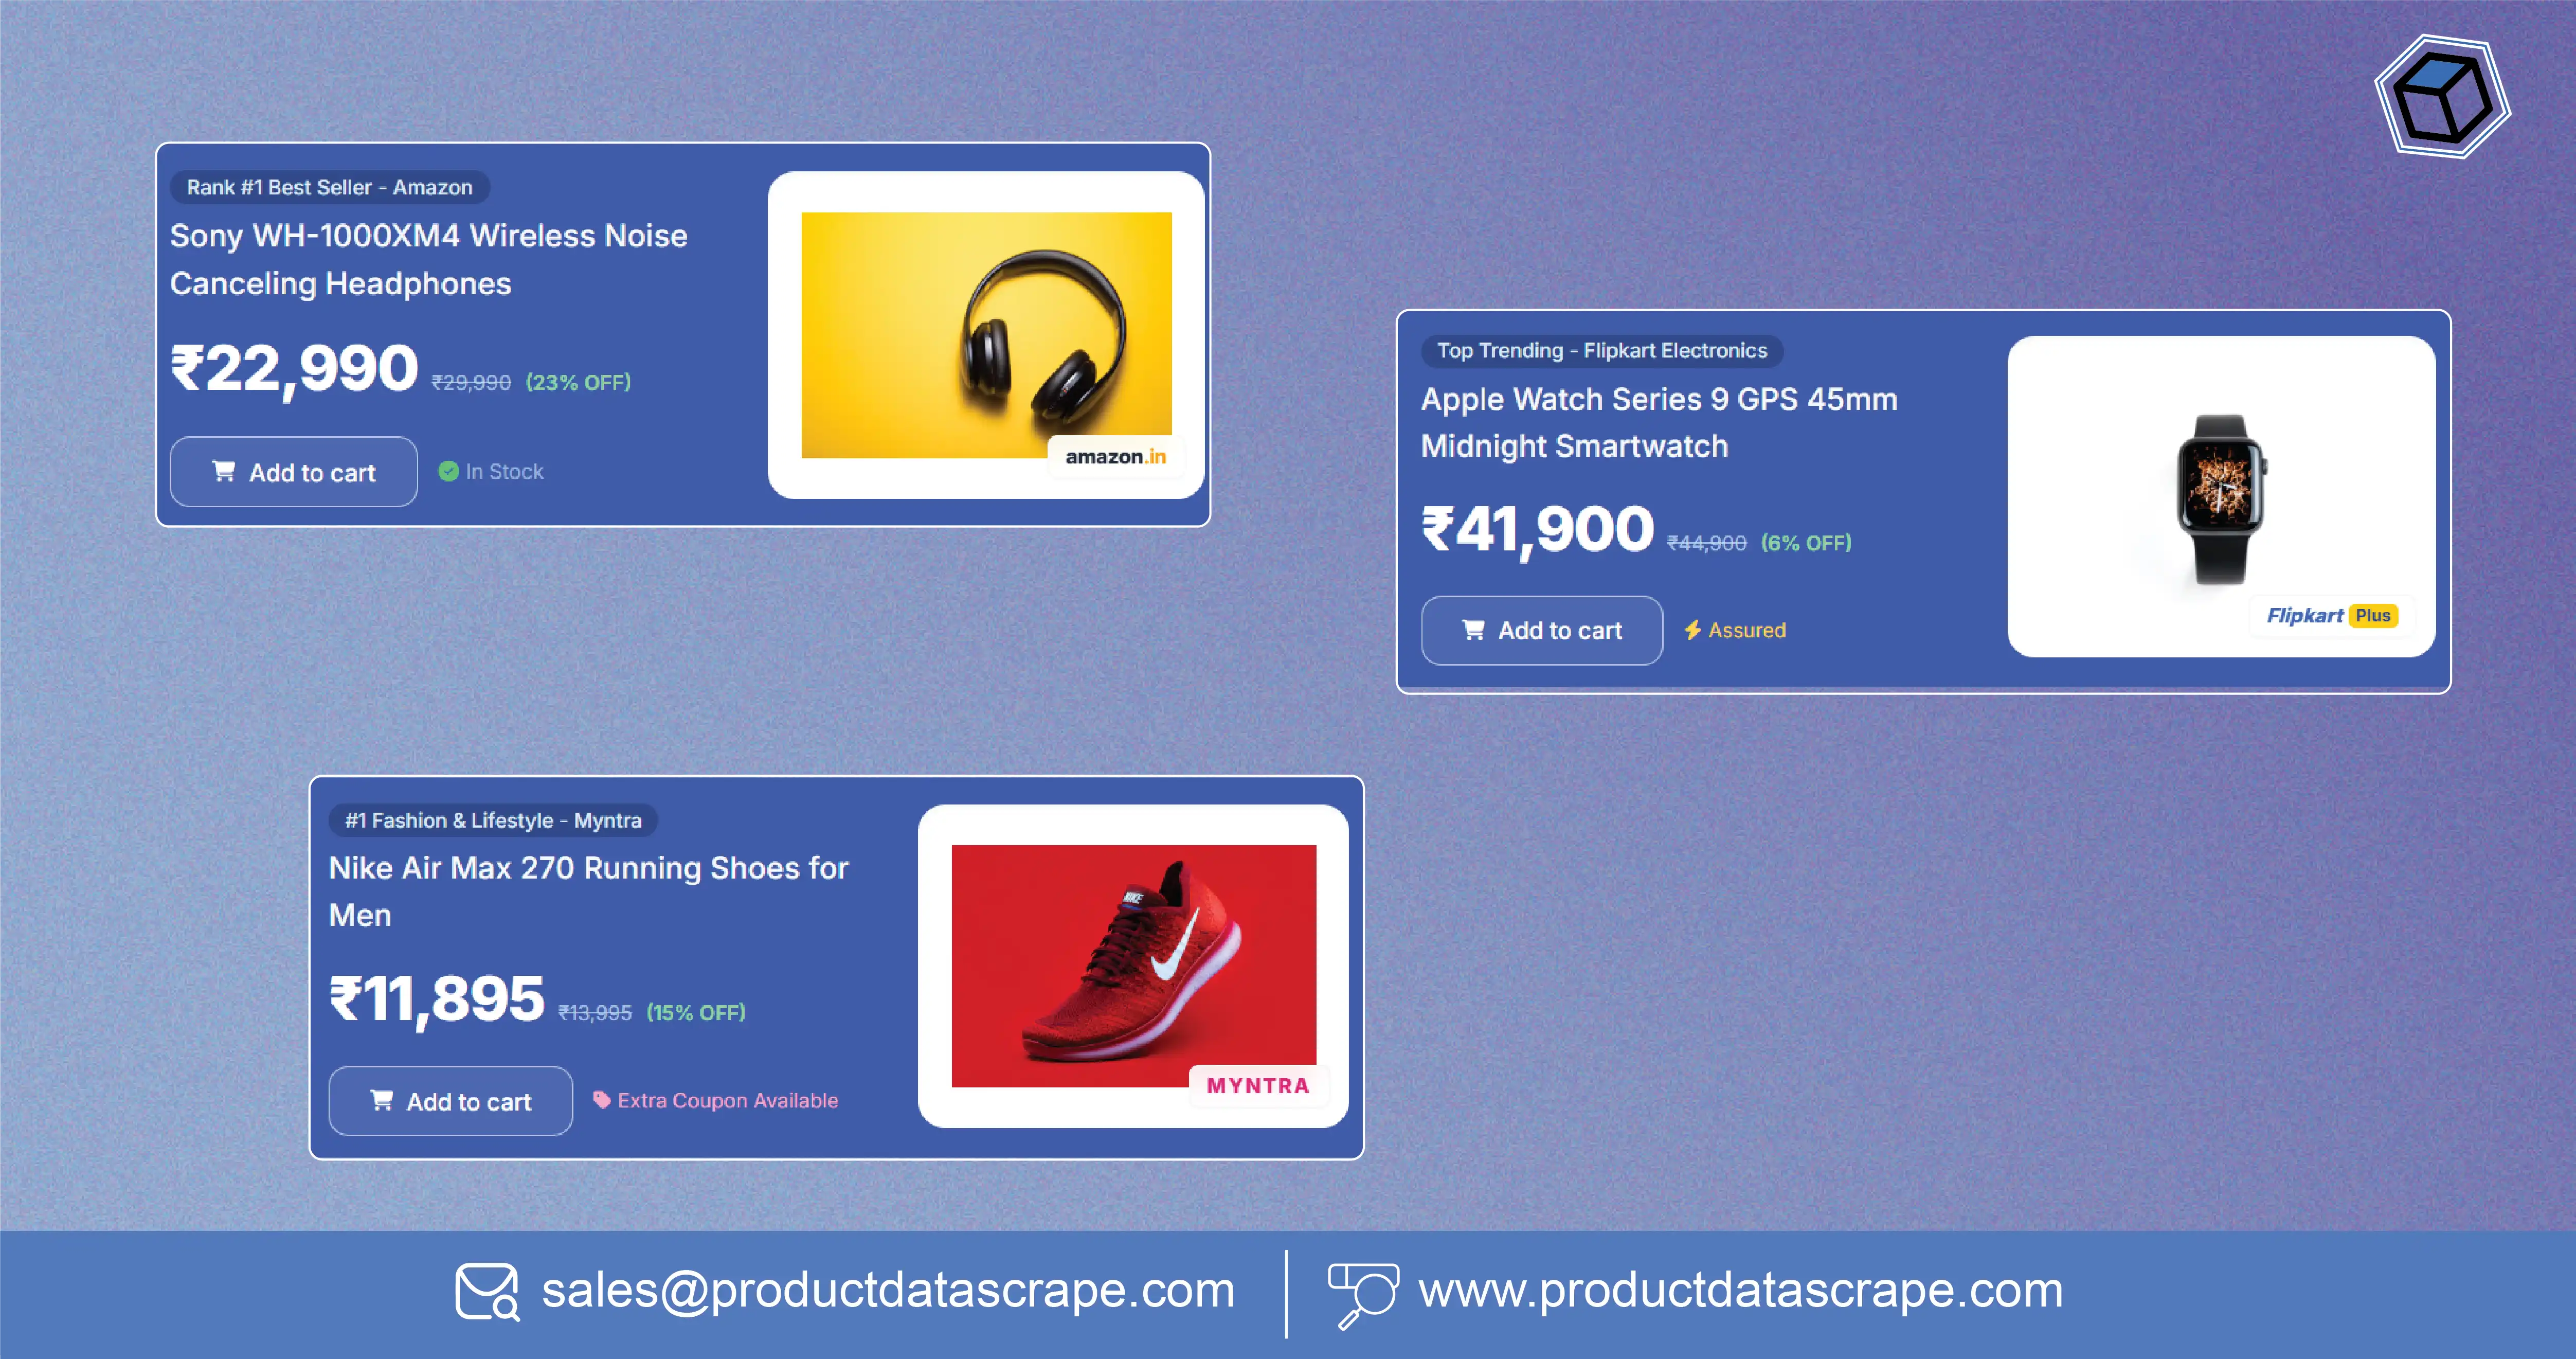
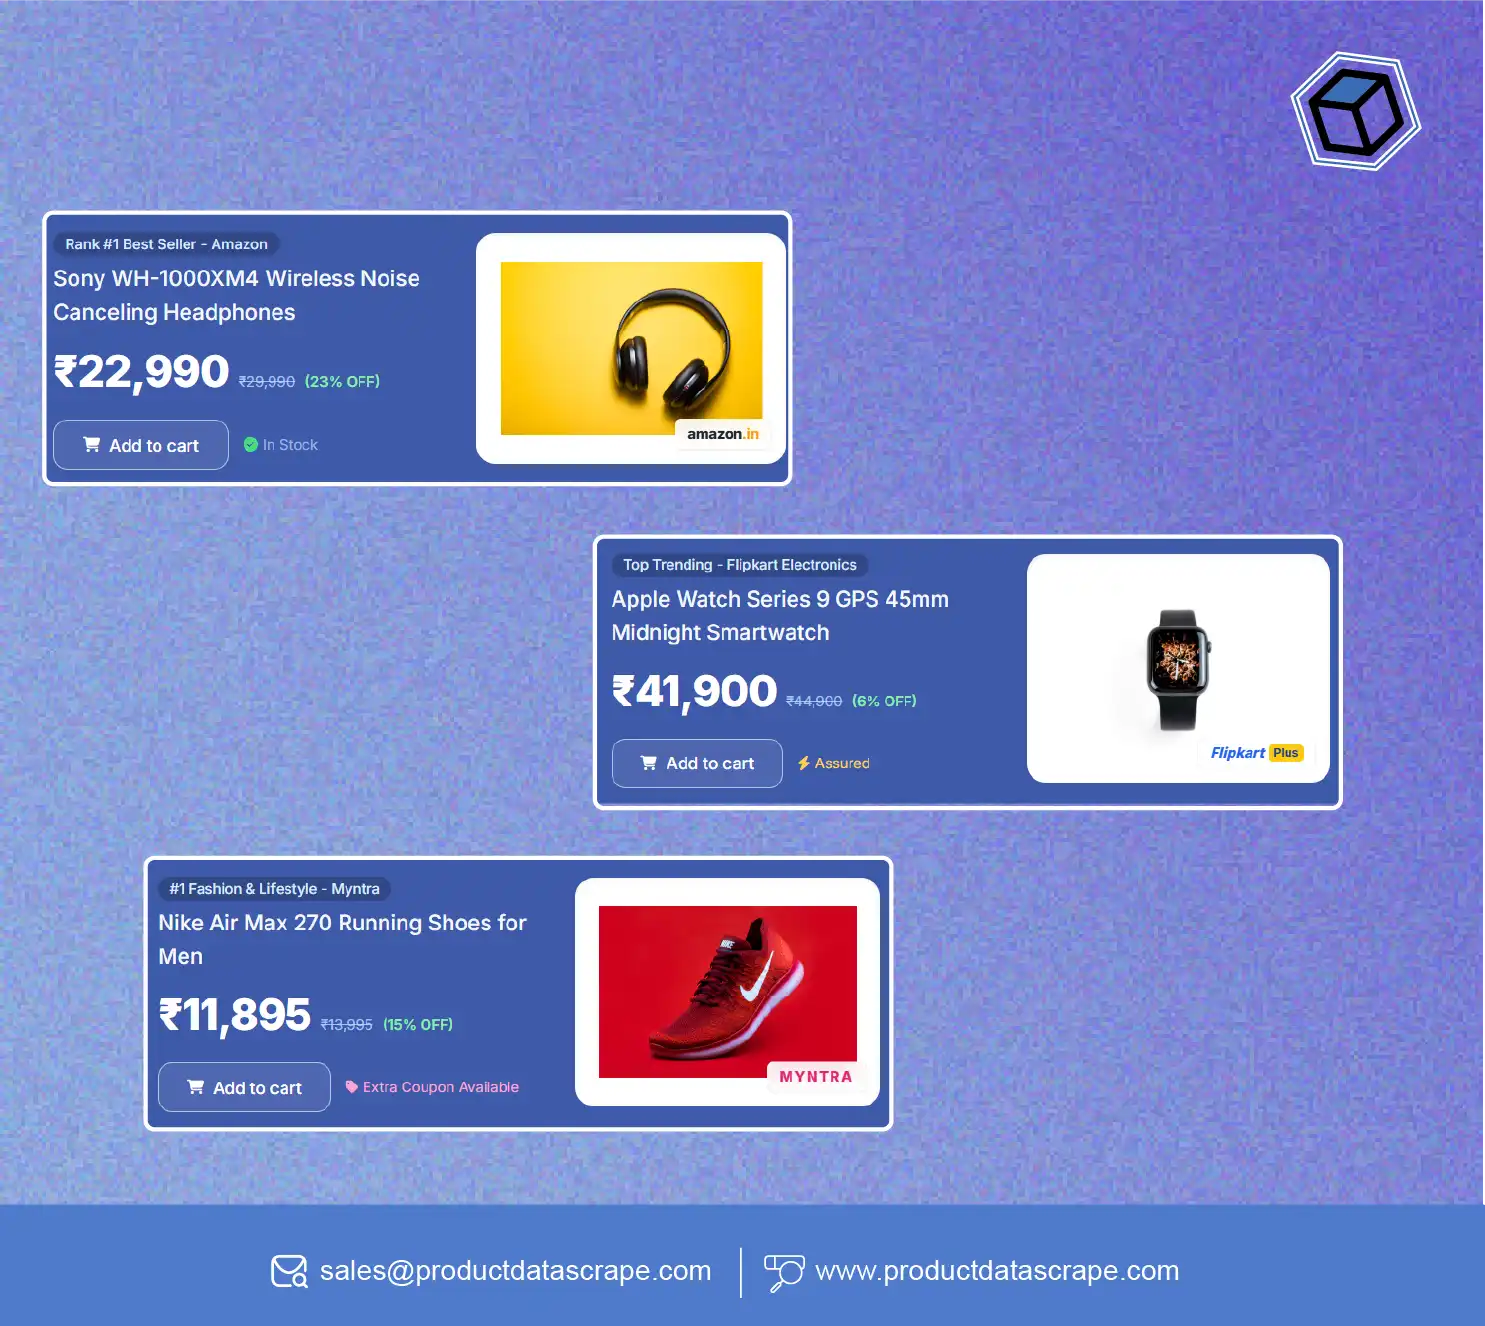
Monitoring Amazon India, Flipkart & Myntra is particularly useful for businesses operating across electronics, fashion, beauty, home products, and other retail categories. Each marketplace presents product popularity differently, so the collection process must account for its individual ranking mechanisms and available data fields.
A reliable daily feed should include timestamps, source references, category information, data validation, and historical records. It should also distinguish between actual sales figures and publicly visible popularity indicators. This distinction helps businesses make informed decisions without treating bestseller rankings as exact sales volumes.
How Can Product Rankings Be Collected Consistently Across Different Categories?
Bestseller rankings provide useful information about product popularity within specific marketplace categories. However, ranking structures and available product details vary across platforms. Businesses should first identify the categories and product attributes they want to monitor before building an extraction workflow.
A structured process to scrape Flipkart bestseller data should capture product names, product identifiers, category information, displayed prices, ratings, review counts, and available ranking information. These fields help businesses organize products into comparable records and monitor changes over time.
Flipkart's Affiliate API documentation describes a Top Selling Products API that provides product information for categories. Its documented response includes product identifiers, titles, categories, prices, and other product information. The documentation also describes pagination through the nextUrl field. Businesses must verify current API access, eligibility, and applicable terms before implementation. Flipkart Top Selling Products API documentation.
E-commerce data scraping can also support collection from permitted marketplace pages when an appropriate API is unavailable. A collection pipeline should use source-specific extraction rules because different websites organize their product information differently.
A practical workflow includes:
- Selecting target categories and subcategories.
- Identifying accessible bestseller or popularity pages.
- Extracting available product and ranking attributes.
- Recording the collection date and time.
- Normalizing product names and category labels.
- Checking missing fields and duplicate listings.
- Comparing current observations with historical records.
For businesses tracking hundreds or thousands of products, automated validation is essential. It helps distinguish a genuine ranking change from an incomplete page response or extraction failure.
The resulting dataset can support category research, assortment planning, product discovery, and competitor monitoring. However, the collected ranking should always be described according to the marketplace's actual ranking terminology rather than presented as verified unit sales.
What Can Amazon's Ranking System Reveal About Product Demand?
Amazon provides Best Sellers Rank (BSR) information that helps shoppers and businesses understand the relative popularity of products within marketplace categories. The ranking is based on sales activity, with recent sales receiving more weight than older sales. Amazon also explains that a product may have different rankings across multiple categories.
Amazon India Bestseller Scraping can help businesses organize publicly accessible product information, including ASINs, product titles, brands, category rankings, displayed prices, ratings, review counts, and product URLs, where those fields are available and their collection is permitted.
The distinction between ranking and actual sales is important. A product ranked higher than another product does not reveal its exact sales volume. Amazon's official explanation also notes that sales rankings are relative and can change based on the activity of competing products.
Businesses can combine ranking observations with Price scraping to understand how displayed prices and discounts relate to product popularity. For example, analysts can examine whether a product's category position changes alongside its displayed price. This is an observation for analysis, not proof that the price change caused the ranking movement.
A useful Amazon monitoring dataset should include:
- ASIN and product title.
- Main category and available subcategory.
- Current Best Sellers Rank.
- Displayed price and discount information.
- Rating and review count.
- Product availability status, where visible.
- Collection timestamp and source URL.
Amazon's documentation explains that BSR is influenced by recent and historical sales rather than page views or customer reviews. Rankings may also differ across categories and stores.
Sources: Amazon Best Sellers Rank explanation and Amazon Sales Rank FAQ.
For sellers and manufacturers, historical observations are more useful than isolated ranking snapshots. A timestamped dataset helps identify recurring category positions, emerging products, and changes in competitive visibility without making unsupported sales-volume assumptions.
How Can Businesses Recognize Emerging Demand Across Indian Marketplaces?
Understanding product demand requires consistent observations across categories, brands, and marketplaces. Businesses should not rely on a single bestseller snapshot because product rankings can change over time and may reflect different marketplace methodologies.
To Track Indian Marketplace Product Trends, companies can compare daily product rankings, category positions, prices, discounts, ratings, and listing availability. These observations can help identify products gaining popularity and categories experiencing changes in visibility.
A Scrape Daily Top-Selling Product Data Feed system should maintain historical snapshots rather than overwriting older records. This enables analysts to compare a product's current position with its previous observations and determine whether a movement is temporary or recurring.
India's e-commerce market provides an important business context for this activity. The following figures are published market estimates and forecasts, not measurements of bestseller scraping activity.
| Year | Indian e-commerce market (US$ billion) | Data classification |
|---|
| 2020 | 30 | Estimate |
| 2021 | 67 | Estimate |
| 2022 | 84 | Estimate |
| 2023 | 102 | Estimate |
| 2024 | 125 | Estimate |
| 2025 | 145 | Forecast |
| 2026 | 163 | Forecast |
Source: Statista – India e-commerce market size. The 2025 and 2026 values are forecasts in the cited series, not confirmed realized results.
Businesses can use this market context to plan product intelligence requirements. A manufacturer may monitor category-level popularity, while a retailer may compare product pricing and bestseller positions before adjusting its assortment.
Useful trend indicators include:
- Daily and weekly ranking movements.
- Newly appearing products in target categories.
- Changes in displayed prices and discounts.
- Product availability observations.
- Rating and review-count changes.
- Brand-level category representation.
These indicators should be evaluated together. A ranking improvement alone does not establish a specific increase in sales, while a higher review count does not necessarily indicate recent purchasing activity.
The objective is to create a consistent evidence base for product research and business planning.
What Product Information Should Be Captured From Fashion Listings?
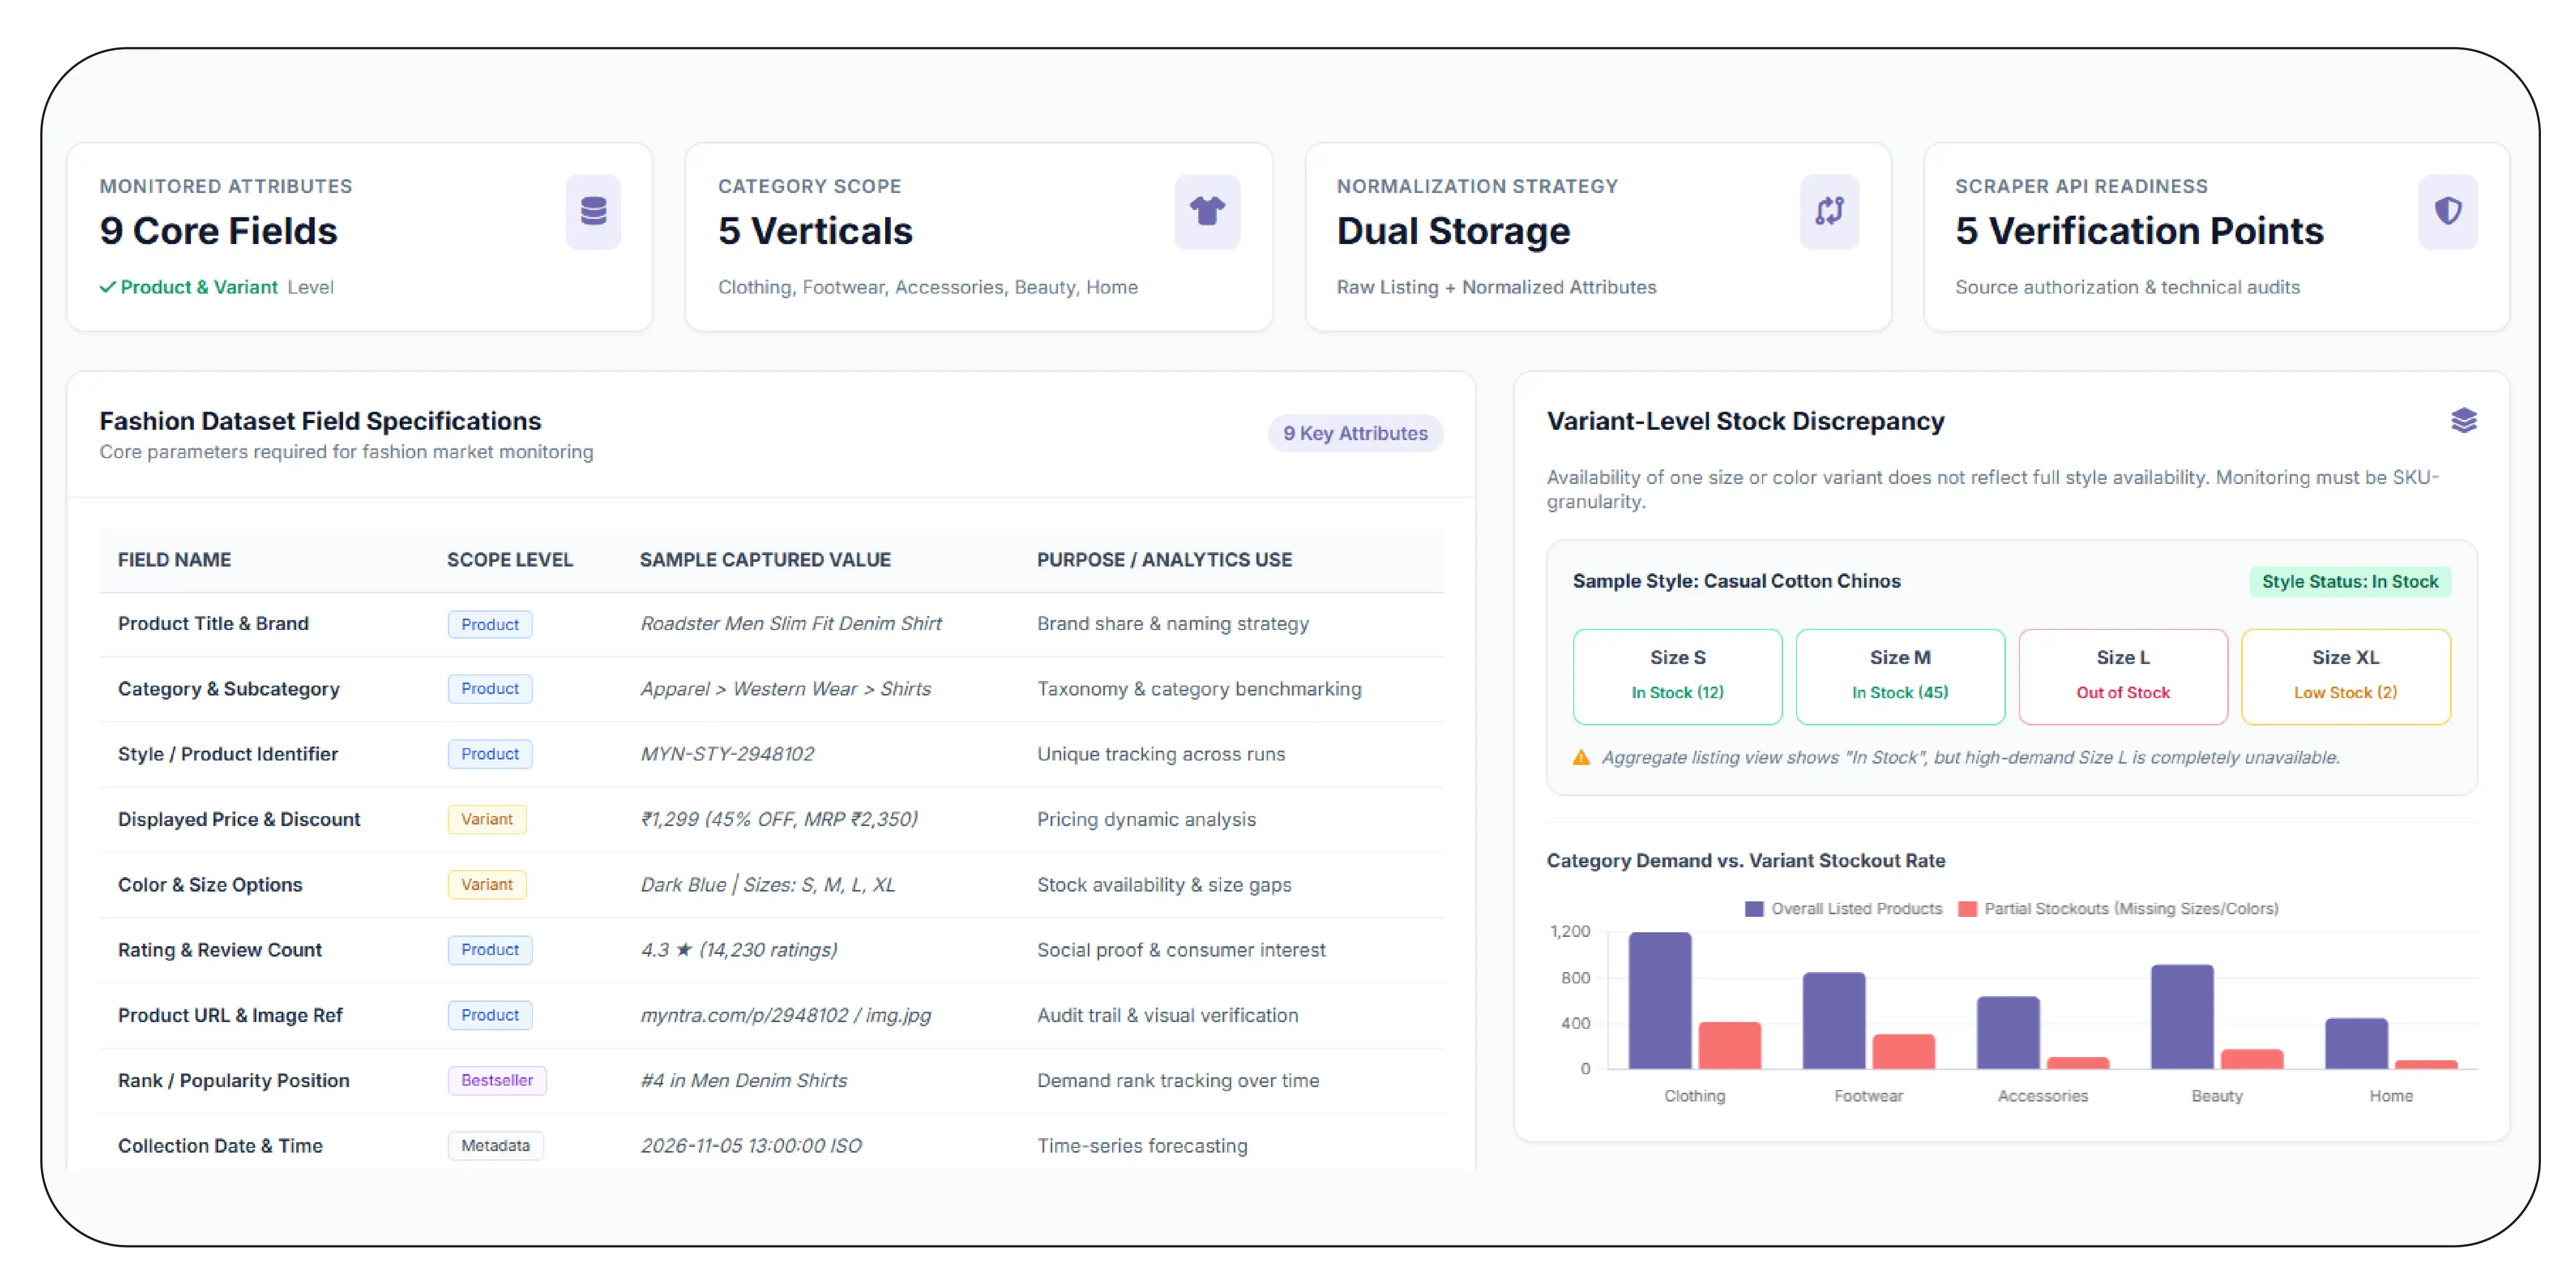
Fashion marketplaces require category-specific monitoring because product popularity can differ across clothing, footwear, accessories, beauty, and home categories. Businesses monitoring fashion demand should collect both product-level and variant-level information to avoid combining different sizes, colors, or styles.
To Extract Myntra Top-Selling Product Data, businesses can examine publicly accessible bestseller pages and collect available information such as product titles, brands, categories, displayed prices, discounts, ratings, review counts, colors, and size information.
Myntra's public bestseller pages provide category and brand filters, price ranges, color filters, discount ranges, and sorting options such as popularity and customer rating. These features offer useful entry points for category-level research. Explore Myntra Bestsellers.
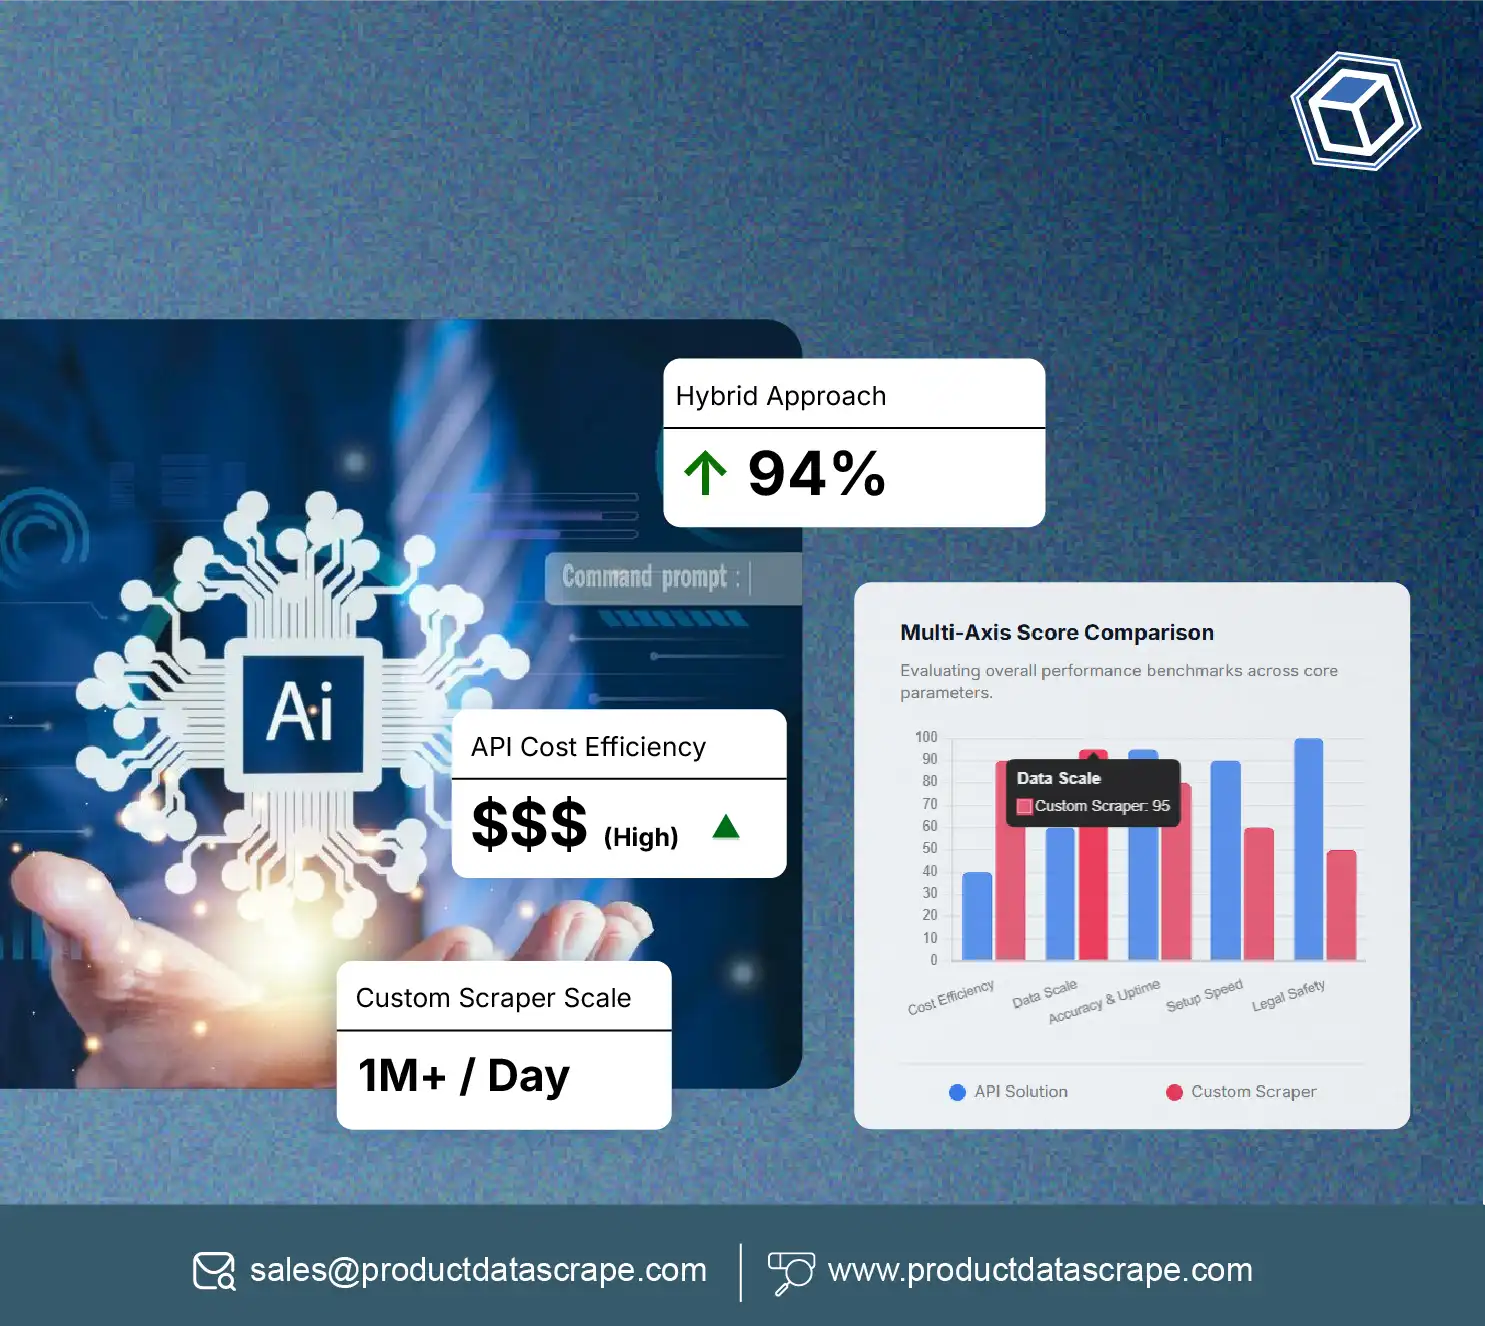
A Myntra Scraper API may be considered when a business needs a structured collection interface. Before choosing a provider, buyers should verify its source authorization, available fields, update frequency, data coverage, and technical documentation. The existence of a public bestseller page should not be interpreted as proof of an officially available public bestseller API.
A fashion-focused dataset should capture:
- Product title and brand.
- Product category and subcategory.
- Available product or style identifier.
- Displayed price and discount.
- Color and size options.
- Rating and review count.
- Product URL and image reference.
- Ranking or popularity position, where displayed.
- Collection date and time.
Product variations need particular attention. A particular style may have multiple sizes and colors, and the availability of one variant does not necessarily represent the availability of every variant.
Businesses should also retain original listing information alongside normalized product attributes. This allows analysts to investigate mismatches and correct records without losing their original source context.
For fashion brands, distributors, and retailers, this information supports assortment research, competitive benchmarking, category monitoring, and product positioning. Historical observations can also help identify products that repeatedly appear in popular categories rather than relying on one-time bestseller positions.
How Can Multiple Marketplaces Be Combined Into One Intelligence System?
Collecting product information from individual marketplaces creates separate datasets. However, businesses operating across several platforms need a consolidated view to compare product popularity, pricing, category representation, and listing changes.
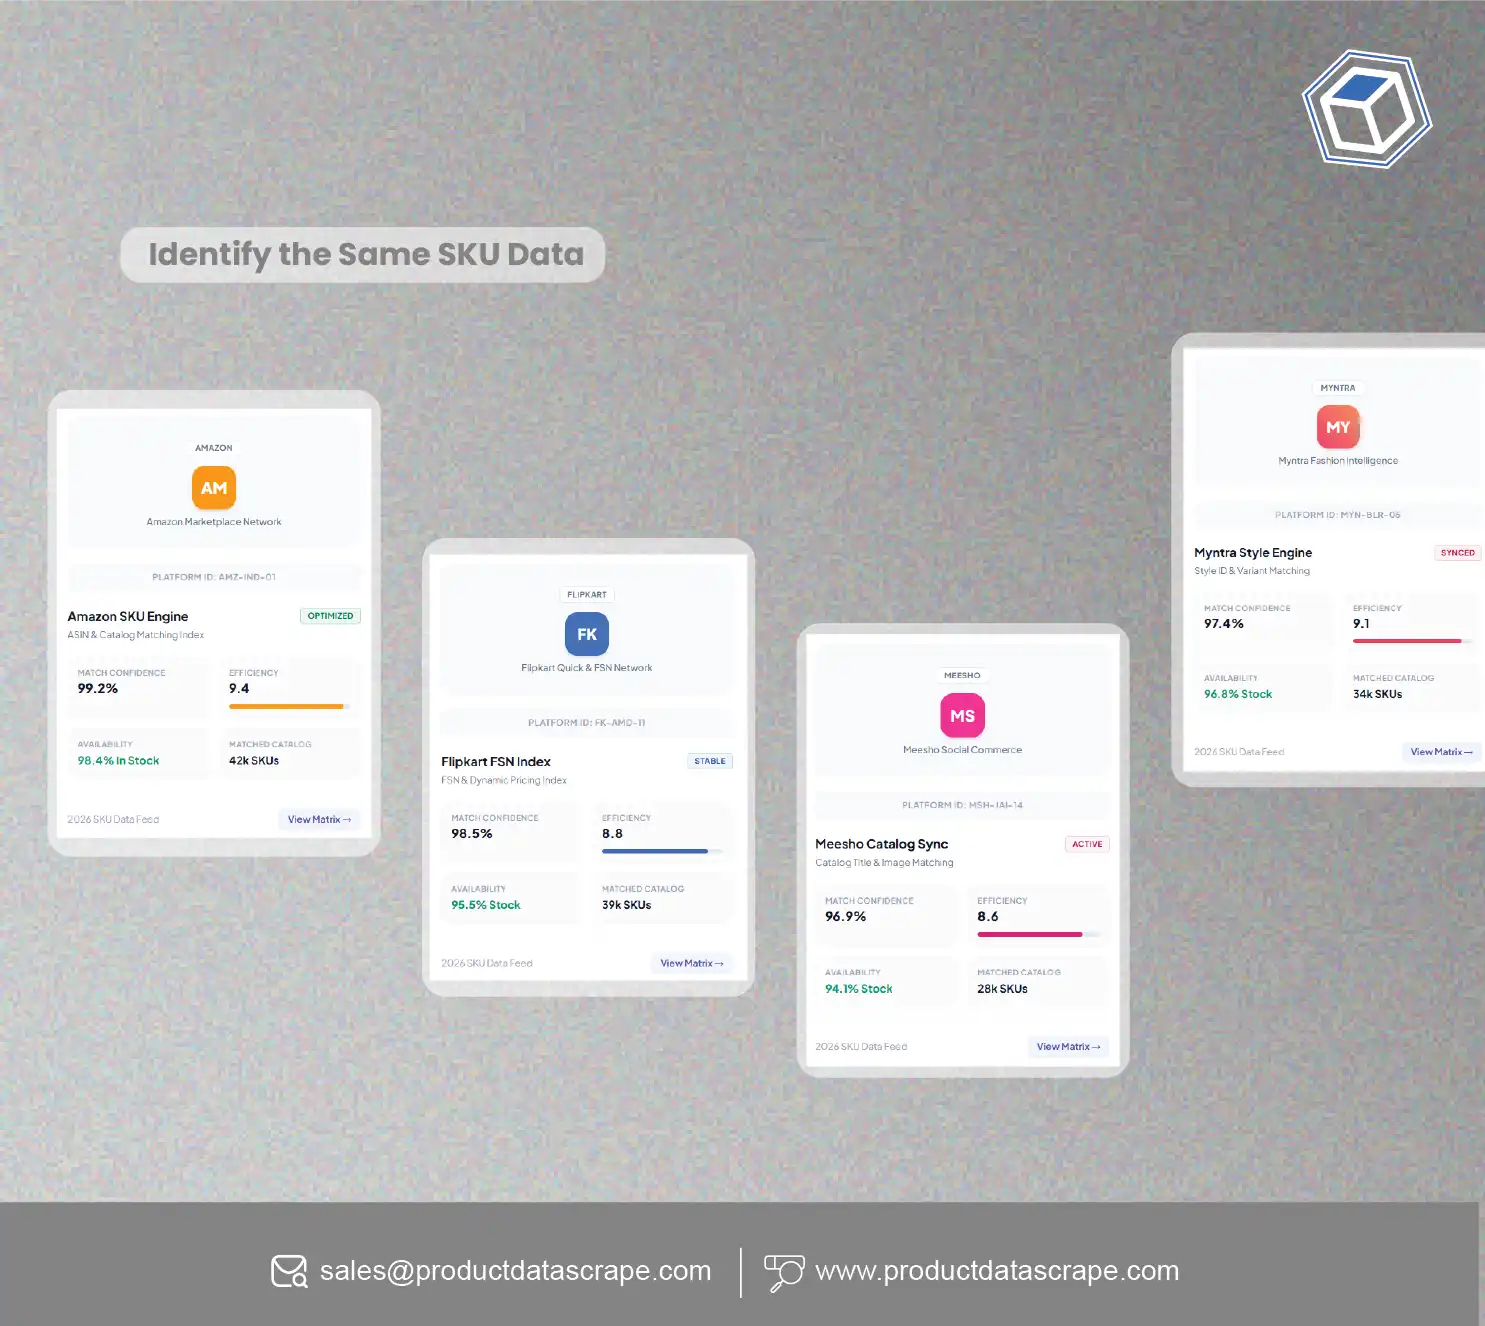
Multi-Marketplace Product Intelligence involves combining product records from different sources while preserving each marketplace's original identifiers and data structure.
For example, the same product may have different titles, seller references, and listing URLs across marketplaces. A standardized internal product ID can help connect equivalent products, provided the matching process verifies brand, model, size, color, and other relevant attributes.
A consolidated feed should contain several important data layers.
| Data layer | Important fields | Business purpose |
|---|
| Product identity | Brand, product ID, model, SKU | Product identification |
| Marketplace reference | Platform, listing ID, URL | Source traceability |
| Popularity | Rank, category, ranking label | Demand indicators |
| Pricing | Displayed price, MRP, discount | Price comparison |
| Customer feedback | Rating, review count | Customer response analysis |
| Availability | Visible stock or listing status | Availability monitoring |
| History | Timestamp, previous observations | Trend analysis |
Businesses should maintain separate records for ranking and pricing. A bestseller position indicates relative popularity within a particular ranking system, whereas a displayed price represents the price observed at the time of collection.
The following practices help improve data consistency:
- Use a common product schema across sources.
- Preserve original product identifiers.
- Normalize brand and category names.
- Separate parent products from variants.
- Record timestamps for every observation.
- Validate missing or conflicting information.
- Retain source URLs for verification.
API integrations can be used where documented and authorized access is available. Flipkart's official developer documentation, for example, describes seller APIs for listing, price, and inventory management. These are seller-management functions and should not be confused with unrestricted access to competitors' sales information. Flipkart Seller API Documentation.
A unified intelligence system allows analysts to compare products across marketplaces without incorrectly assuming that different listing identifiers represent different physical products. It also creates a more reliable foundation for category research and competitive reporting.
How Should Businesses Build and Maintain a Daily Monitoring Feed?
A daily monitoring feed should deliver consistent, timestamped product observations that businesses can use for reporting and decision-making. Its effectiveness depends on source reliability, extraction accuracy, standardized fields, and a clearly defined collection schedule.
Daily Marketplace Product Insights become more useful when businesses retain historical records and compare current observations with previous snapshots. A product's current position alone provides limited context. Its category, previous ranking, price, availability, and collection timestamp help analysts understand what has changed.
A Scrape Daily Top-Selling Product Data Feed workflow should begin with category selection and source verification. The collection system should then retrieve permitted product information, validate the returned records, and store them in a structured database.
A recommended workflow includes:
Step 1: Define monitoring requirements. Select target marketplaces, categories, brands, products, and required attributes.
Step 2: Verify source access. Identify documented APIs or permitted public data sources. Review applicable platform terms, access conditions, and rate limits.
Step 3: Collect product information. Capture available product titles, identifiers, ranking information, displayed prices, discounts, ratings, and listing URLs.
Step 4: Validate records. Check duplicate products, missing attributes, invalid prices, unexpected category changes, and incomplete responses.
Step 5: Store historical snapshots. Preserve each observation with its source and collection timestamp instead of overwriting previous values.
Step 6: Generate business reports. Organize the information into category-level reports, price comparisons, ranking histories, and product trend summaries.
The following sample data structure illustrates the fields that a production feed should support. It is a schema recommendation, not a claim about actual marketplace records.
| Field | Description |
|---|
| Marketplace | Source platform |
| Product ID | Original marketplace identifier |
| Product name | Product title |
| Category | Marketplace category |
| Rank | Observed ranking, if available |
| Displayed price | Price at collection time |
| Discount | Displayed discount, if available |
| Rating | Visible customer rating |
| Reviews | Visible review count |
| Availability | Observed listing status |
| Timestamp | Date and time of collection |
Businesses should also establish error-handling rules. If a page fails to load, a ranking field disappears, or an API response is incomplete, the system should flag the observation rather than automatically treating the product as unavailable.
Collection frequency should be based on business requirements and permitted access limits. A daily schedule is useful for daily reporting, but it does not guarantee real-time visibility or capture every temporary marketplace change.
With these controls, businesses can develop a consistent product intelligence pipeline that supports product research, pricing analysis, and category-level decision-making.
What Do Historical Market Figures Mean for Product Intelligence?
India's e-commerce expansion provides context for why structured marketplace information matters to retailers and manufacturers. The market estimates below show the broader commercial environment, rather than the performance of any individual marketplace or bestseller category.
| Year | Market size (US$ billion) | Classification |
|---|
| 2020 | 30 | Estimate |
| 2021 | 67 | Estimate |
| 2022 | 84 | Estimate |
| 2023 | 102 | Estimate |
| 2024 | 125 | Estimate |
| 2025 | 145 | Forecast |
| 2026 | 163 | Forecast |
Source: Statista, India e-commerce market size series, updated April 2026. Figures for 2025 and 2026 are forecasts in the cited series. View market-size data. The IBEF's August 2025 report independently provides estimates for 2021–2026, including US$67 billion for 2021 and US$163 billion for 2026. View IBEF report.
These figures should be used as market context, not as proof of daily bestseller growth. For data buyers, the practical takeaway is to build datasets that can distinguish marketplace-level demand indicators from broader industry estimates.
Why Choose Product Data Scrape?
Product Data Scrape helps businesses build structured marketplace datasets through customized product information collection, catalog monitoring, and data validation. Its solutions can support Flipkart Plus Pricing Data requirements by organizing available pricing information, discounts, product attributes, and historical observations, subject to source access and permissions. A customized Scrape Daily Top-Selling Product Data Feed workflow can help retailers, manufacturers, and distributors monitor marketplace trends and compare product positioning. The focus is on consistent data delivery, organized records, and actionable insights that support better e-commerce research and business planning.
Conclusion
Tracking bestseller rankings across marketplaces helps businesses understand product popularity, category movements, and competitive positioning. Combining historical observations with pricing and product information creates a stronger foundation for eCommerce Pricing Strategies and assortment planning. A structured Scrape Daily Top-Selling Product Data Feed workflow also helps businesses identify emerging products and monitor changing marketplace conditions.
Ready to improve your marketplace intelligence? Contact Product Data Scrape to discuss a customized product data collection solution and build reliable daily feeds for smarter e-commerce decisions!
FAQs
1. What is a daily top-selling product data feed?
It is a structured dataset containing marketplace product information, bestseller rankings, displayed prices, categories, ratings, and timestamps collected at scheduled intervals.
2. Can bestseller rankings reveal actual product sales?
No. Rankings indicate relative popularity. Actual unit sales require authorized sales reports or reliable sales data from the relevant marketplace or seller account.
3. Which product attributes should businesses monitor?
Businesses should monitor product titles, identifiers, categories, prices, discounts, ratings, reviews, availability indicators, ranking positions, and collection timestamps.
4. How frequently should marketplace product data be collected?
Daily collection supports daily trend analysis. The appropriate frequency depends on business requirements, source availability, platform permissions, and applicable access limits.
5. How can Product Data Scrape help retailers?
Product Data Scrape helps retailers organize marketplace information, monitor product rankings, structure pricing records, and develop historical datasets for competitive research and business planning.


 Singapore
 EMAIL
 PHONE











.webp)