Introduction
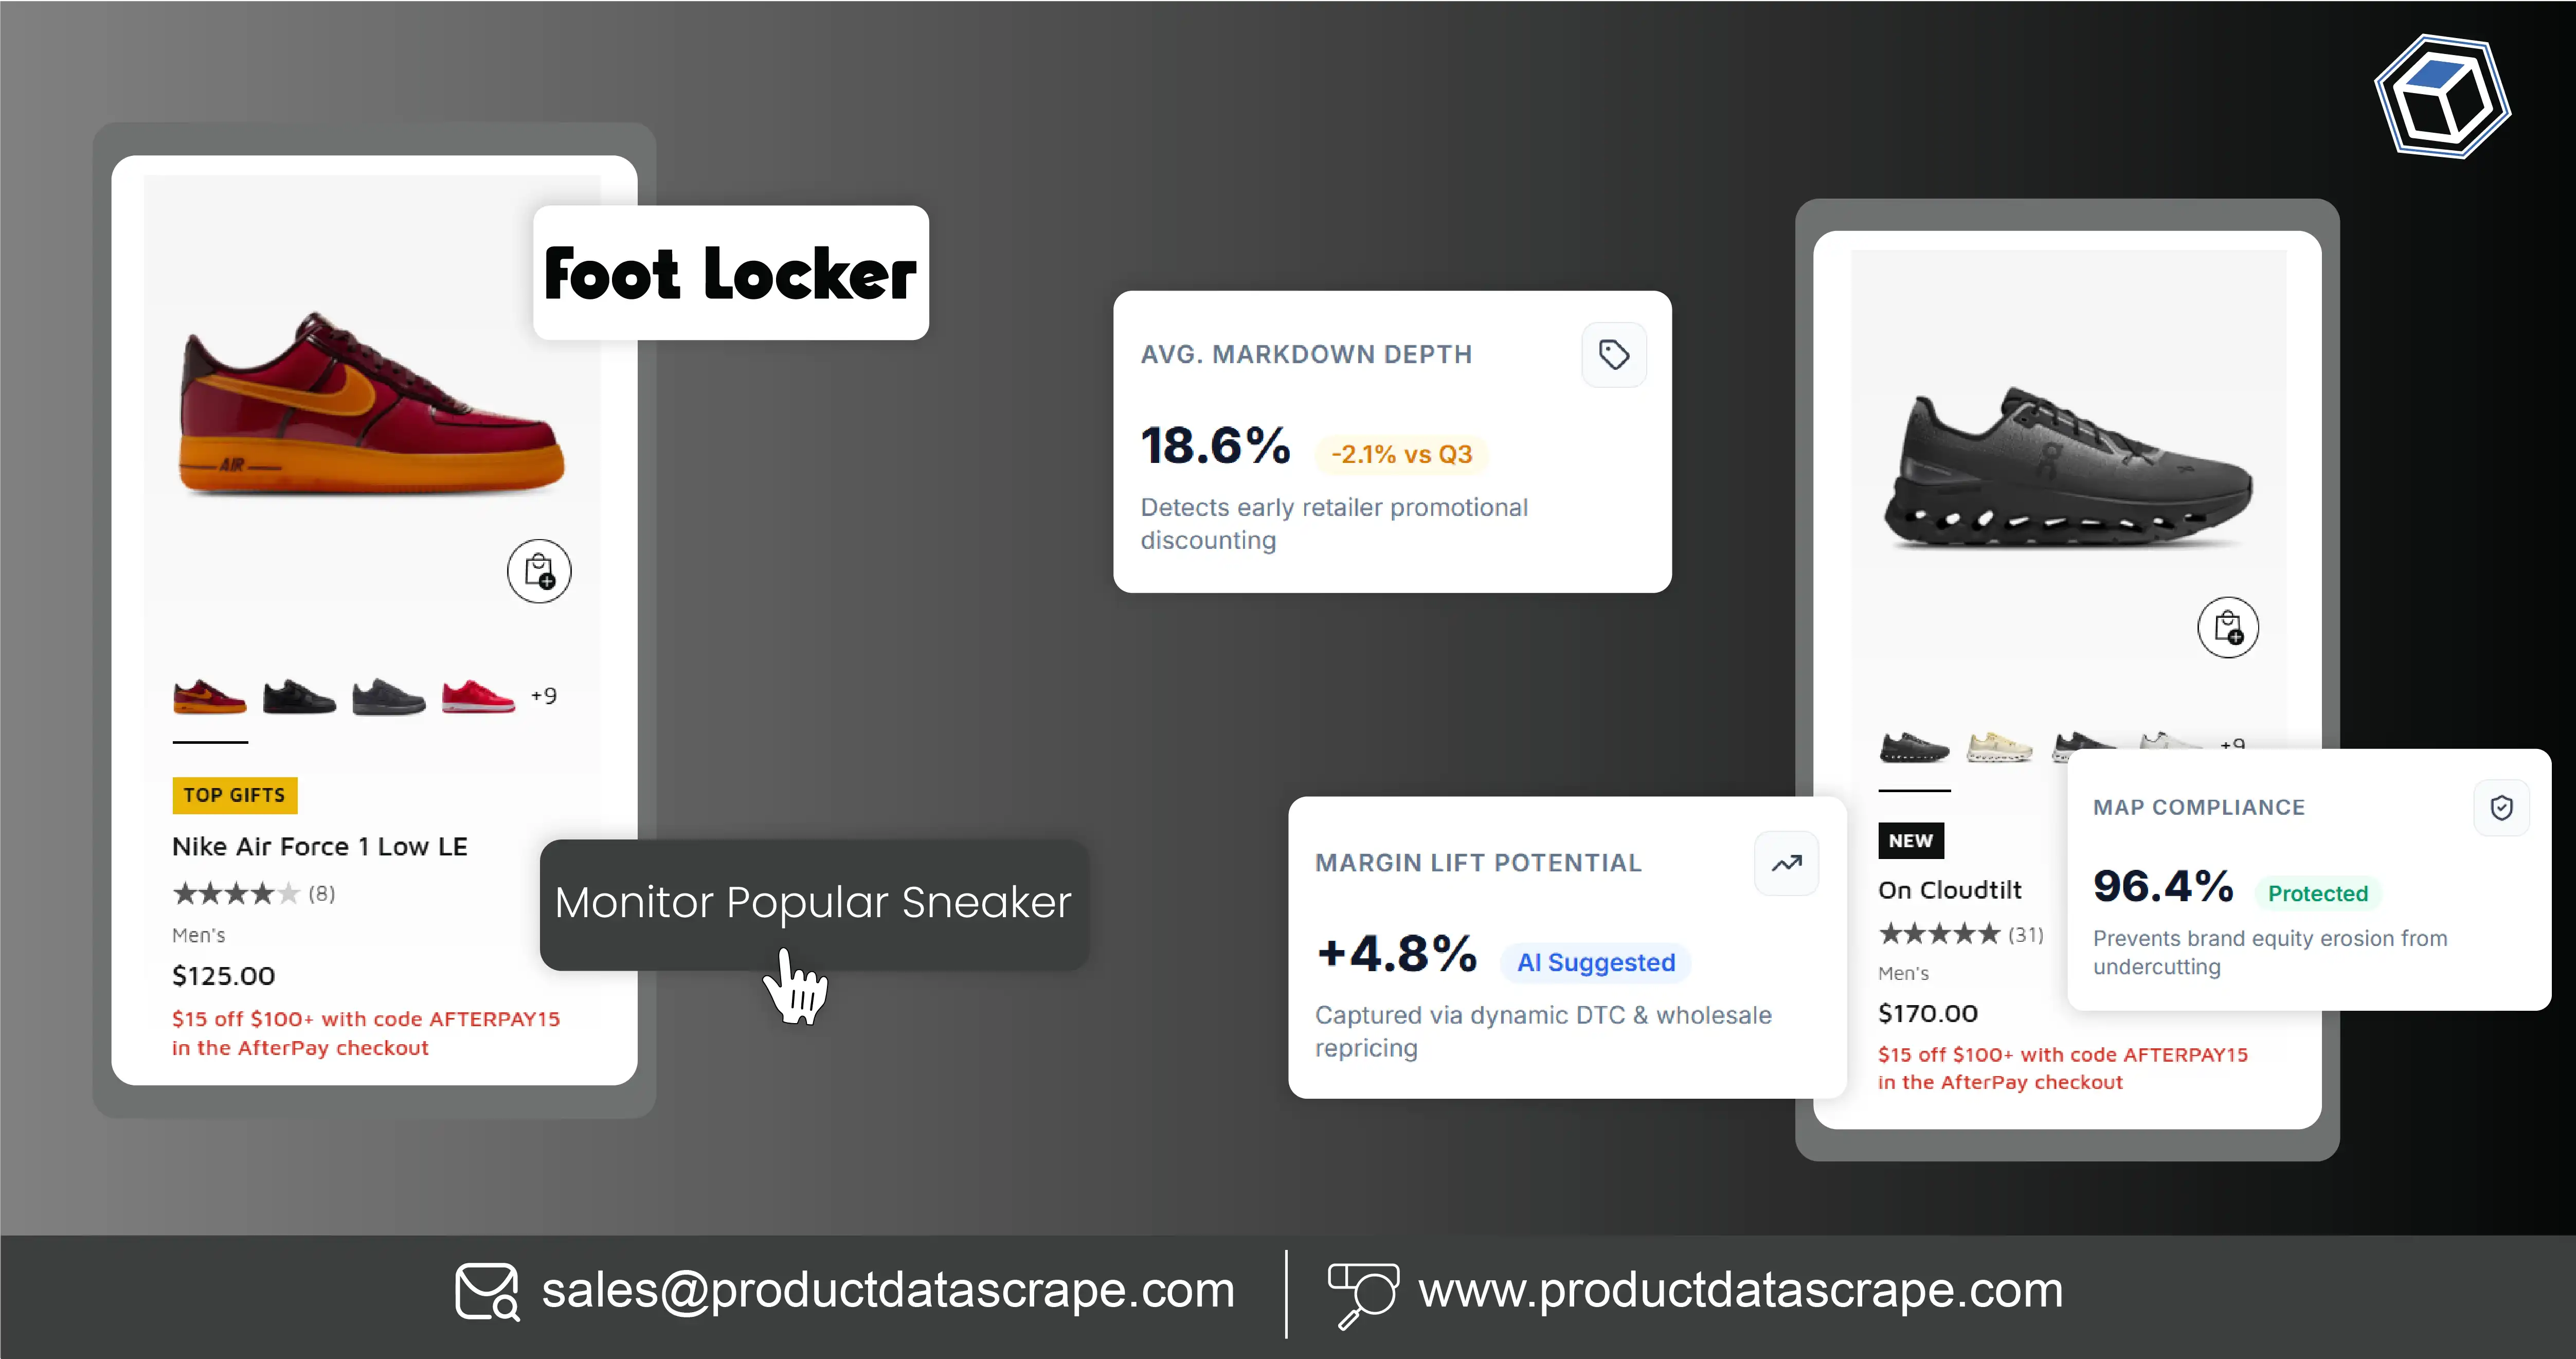
Sneaker brands operate in a highly competitive retail environment where product prices, discounts, availability, and new releases influence purchasing decisions. Monitoring these changes helps brands identify competitive pricing opportunities, understand consumer demand, and improve retail strategies. Foot Locker Sneaker Price Scraping enables businesses to collect structured information about sneaker listings, including product names, brands, prices, sizes, discounts, product URLs, and stock availability. This information helps retailers compare prices across sneaker categories, recognize promotional changes, and evaluate how popular products perform over time.
The importance of reliable retail intelligence is supported by the changing footwear market. According to Circana, U.S. footwear industry sales reached $89.2 billion in 2024. Sport lifestyle footwear generated $31 billion, making it the leading footwear category by sales. These market developments demonstrate why brands need accurate pricing and product intelligence to make informed decisions.
Global Sneaker Market Analysis
Global sneaker competition is influenced by product launches, brand positioning, seasonal promotions, consumer preferences, and inventory availability. Retailers need consistent market information to understand these factors and respond to changing demand. Historical retail information also provides valuable context for identifying long-term pricing movements rather than making decisions based on isolated discounts.
For sneaker manufacturers, distributors, marketplace operators, and e-commerce businesses, structured retail data can support competitor benchmarking, assortment planning, promotional analysis, and pricing optimization. The following sections explain how systematic product monitoring can turn Foot Locker listing information into actionable business intelligence.
How Can Brands Track New Sneaker Prices and Identify Market Trends?
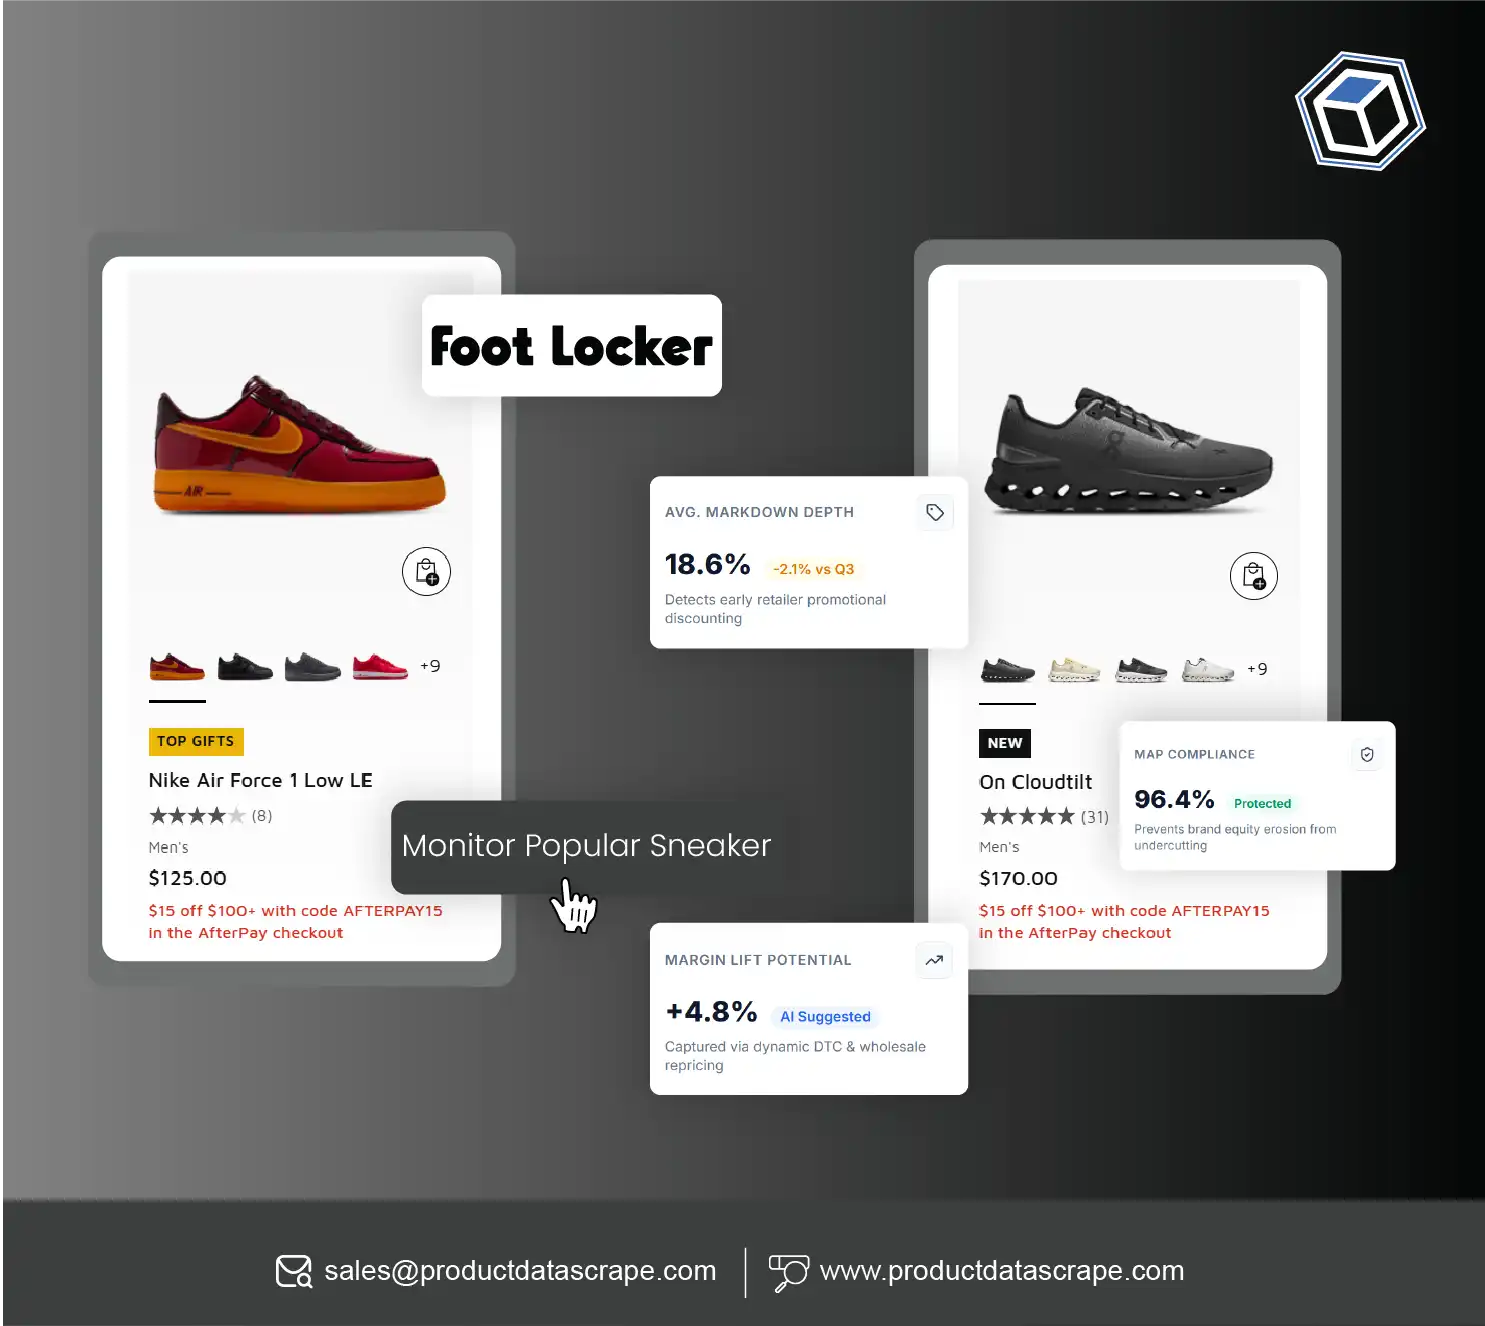
New sneaker arrivals often introduce fresh pricing benchmarks into the footwear market. Brands need to understand how newly listed products are priced, whether promotional offers appear after launch, and how different product categories are positioned. Foot Locker New Arrival Price Tracking helps businesses monitor newly introduced sneakers and organize their prices according to brand, model, category, gender, and product attributes.
For example, a retailer monitoring new running shoes can compare their listed prices with similar lifestyle sneakers. This comparison helps pricing teams understand differences in product positioning and identify opportunities to adjust their own assortment. Tracking prices over several weeks can also reveal whether products maintain their original prices or receive promotional reductions.
Sneaker Price Trends become more useful when businesses maintain historical records instead of collecting individual snapshots. A structured dataset can show original prices, current prices, percentage discounts, and changes over selected periods.
Foot Locker's historical financial information demonstrates why market monitoring matters. Its reported total sales declined from $8.759 billion in fiscal 2022 to $8.168 billion in fiscal 2023 and $7.971 billion in fiscal 2024. These company-wide figures are not sneaker price indicators, but they provide important retail performance context.
What historical retail indicators should brands monitor?
| Year | Foot Locker total sales (USD billion) | Business context |
|---|
| 2020 | 7.548 | Pandemic-era retail conditions |
| 2021 | 9.456 | Strong recovery year |
| 2022 | 8.759 | Sales moderated |
| 2023 | 8.168 | Lower annual sales |
| 2024 | 7.971 | Continued sales decline |
| 2025 | Not directly comparable | Acquisition by DICK'S |
| 2026 | Not directly comparable | Integrated reporting period |
Source: Foot Locker historical annual reporting and DICK'S Sporting Goods SEC filings. Fiscal years differ from calendar years. 2025 and 2026 are not presented as standalone Foot Locker annual sales figures.
By analyzing product-level pricing alongside broader retail performance, brands can identify pricing opportunities, understand market positioning, and develop more informed promotional strategies.
How Does Inventory Intelligence Help Brands Avoid Sneaker Stock Gaps?
Price information alone does not provide a complete picture of the sneaker market. A product may have an attractive price but limited size availability, while another model may remain available across multiple sizes. Businesses therefore need to monitor product availability alongside prices.
Foot Locker Sneaker Stock Monitoring helps brands collect publicly accessible listing information such as availability indicators, displayed sizes, product status, and changes in product listings. This information can help retailers identify products that appear to be selling quickly or experiencing changes in availability.
Combining this information with E-commerce data scraping allows businesses to organize product details from multiple authorized online retail sources into consistent datasets. Product matching is particularly important because the same sneaker may appear under different titles, abbreviations, or product descriptions across retail websites.
For example, businesses can use product identifiers, model names, brand information, and color descriptions to distinguish similar sneaker variations. This improves comparisons and reduces the risk of treating different products as identical.
Foot Locker's fiscal 2024 annual report recorded merchandise inventory of approximately $1.525 billion, compared with $1.509 billion in fiscal 2023 and $1.643 billion in fiscal 2022. Its reported inventory turnover was 2.8 times in 2024, compared with 2.7 times in 2023 and 3.1 times in 2022. These figures show why inventory efficiency is an important retail performance measure.
Which inventory indicators are useful?
| Data field | Business application |
|---|
| Product availability | Identify listed products that are available or unavailable |
| Size availability | Compare displayed size options |
| Product status | Monitor active, unavailable, or removed listings |
| Current price | Compare pricing against availability |
| Discount percentage | Identify promotional products |
| Product URL | Maintain a traceable listing reference |
Brands can use these records to identify potential stock gaps, compare assortment coverage, and improve inventory planning. However, a website's displayed availability is not the same as confirmed warehouse inventory or actual sales velocity.
How Can Brands Monitor New Sneaker Releases and Launch Pricing?
Sneaker launches create important pricing and assortment opportunities for footwear brands. New models, collaborations, and seasonal collections can attract attention from consumers, retailers, and competitors. Monitoring launch information helps businesses understand how new products enter the market and how their displayed prices evolve.
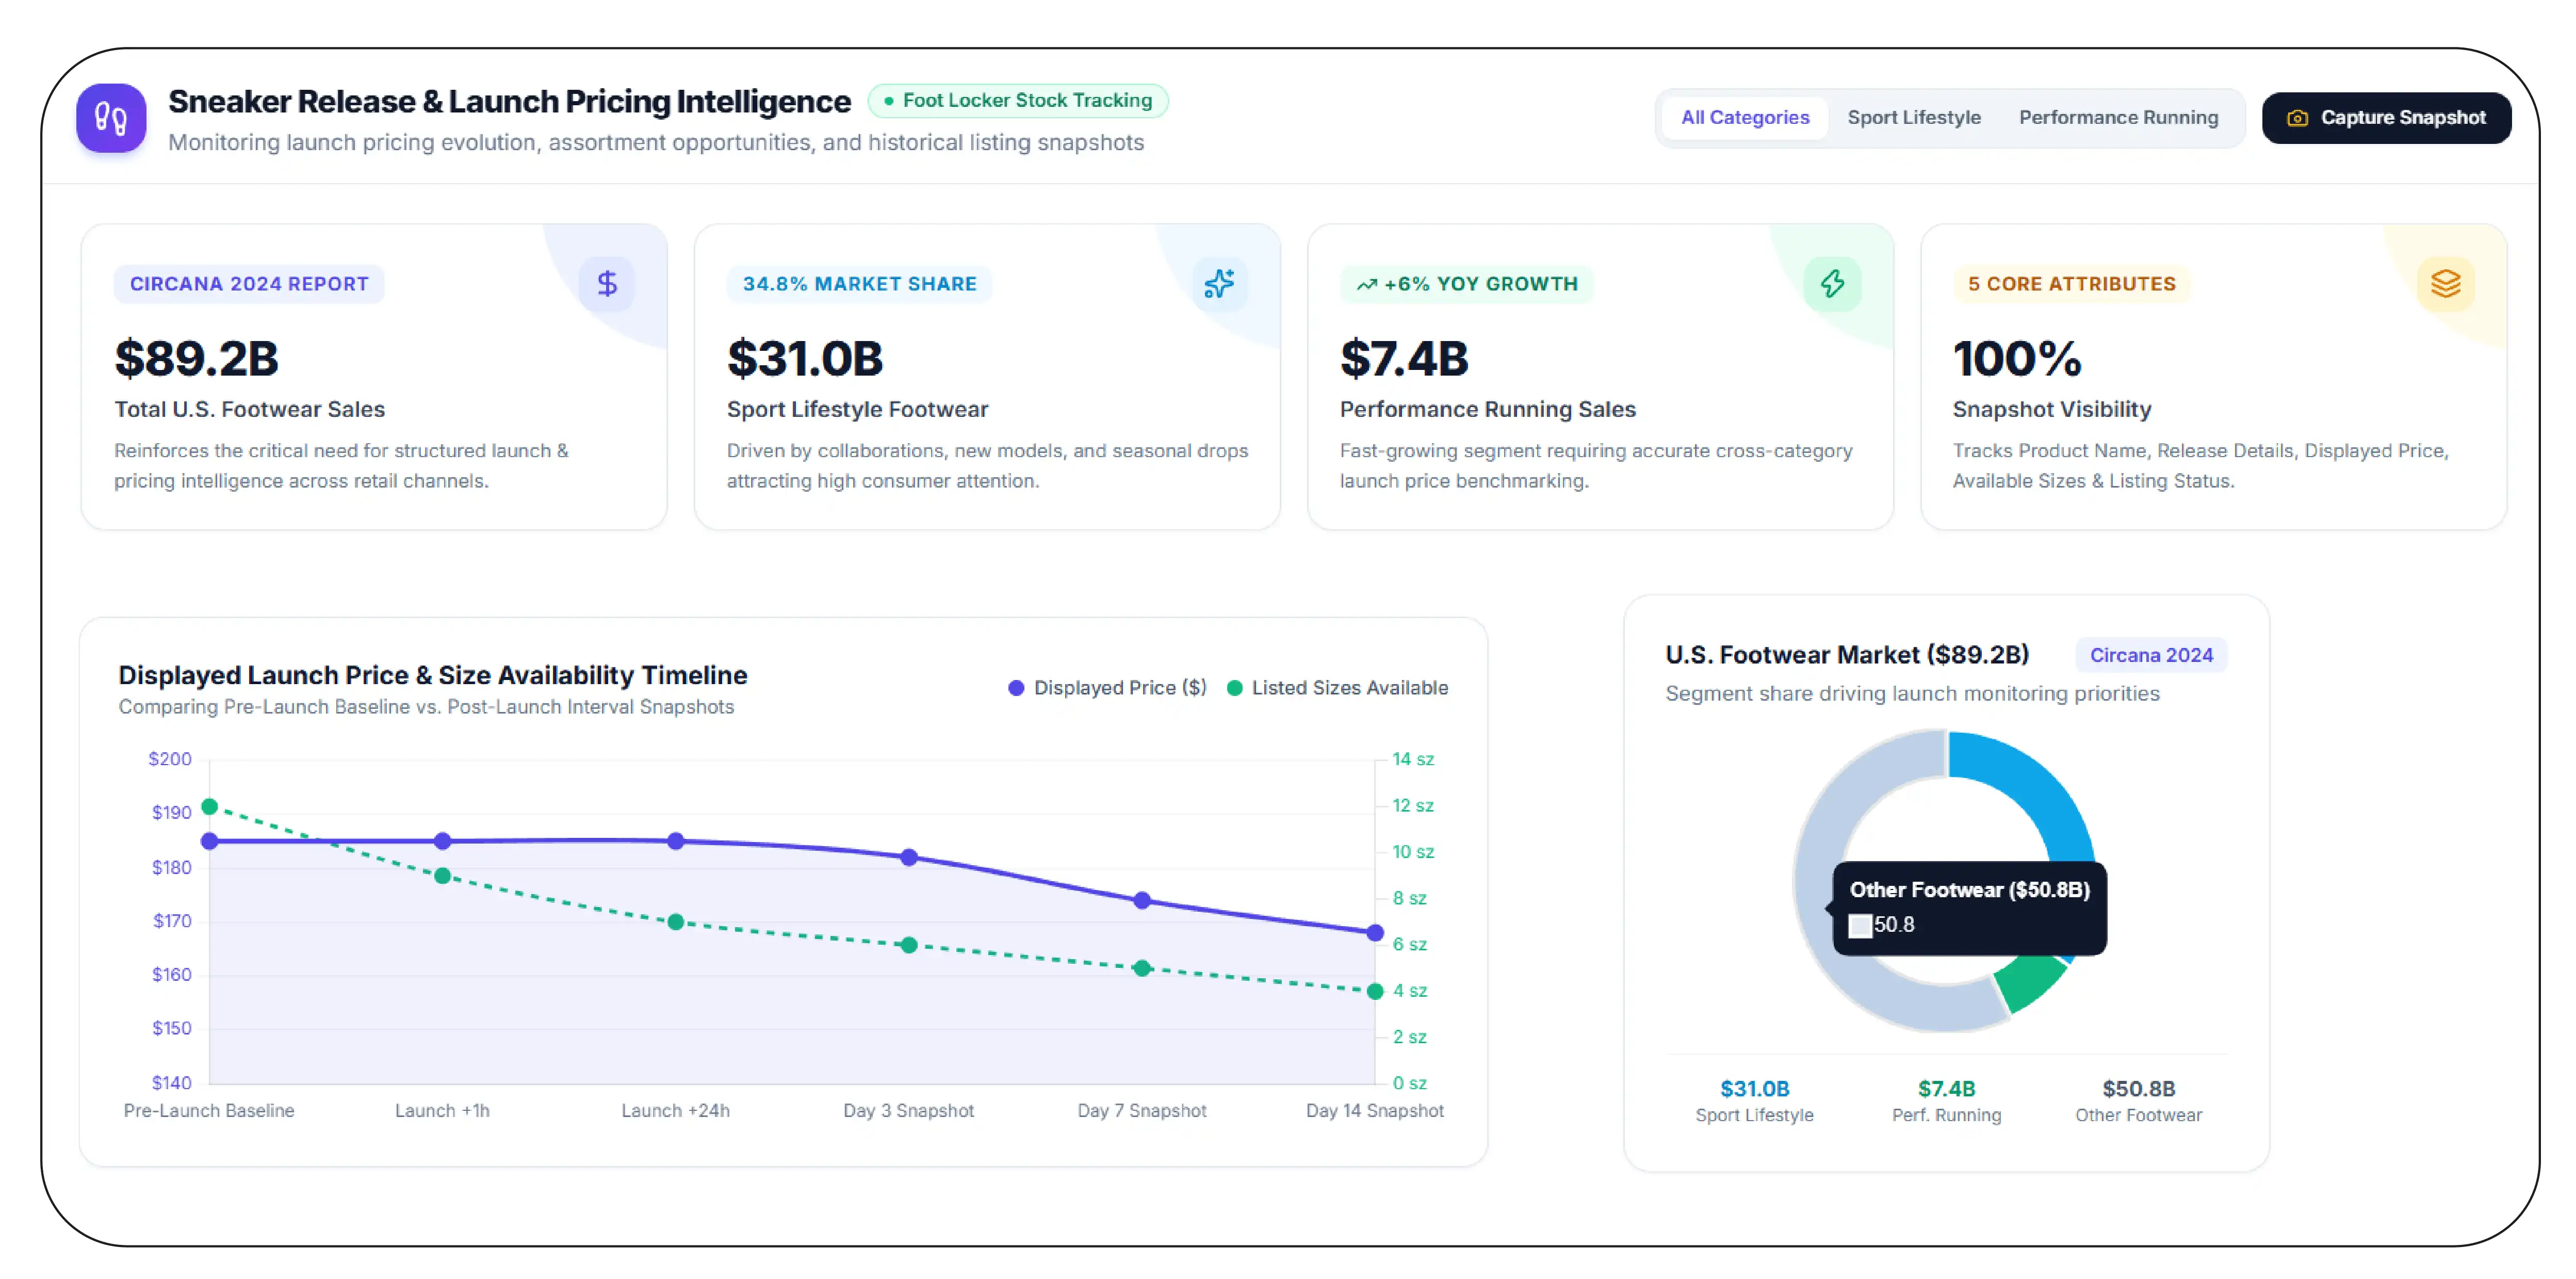
Foot Locker Sneaker Launch Stock Tracking focuses on collecting launch-related product information, including product names, release details where published, displayed prices, available sizes, and listing status. Brands can use these records to compare launch pricing across different sneaker categories and identify changes in product availability.
A useful approach is to establish a baseline before a launch and collect subsequent listing snapshots at appropriate intervals. This creates a historical record of the product's displayed price and availability without assuming that a stock change necessarily represents a sale.
The need for this intelligence is reinforced by the broader footwear market. Circana reported that U.S. footwear sales totaled $89.2 billion in 2024. Sport lifestyle footwear accounted for $31 billion, while performance running footwear generated $7.4 billion in sales, increasing by more than 6% year over year.
How can launch information support pricing decisions?
| Launch monitoring field | Strategic value |
|---|
| Product name and model | Identify the exact sneaker |
| Brand and collection | Organize competing product launches |
| First observed listing date | Establish a monitoring reference |
| Displayed retail price | Record the listed launch price |
| Discount information | Identify subsequent promotions |
| Available sizes | Understand displayed assortment coverage |
| Listing status | Monitor changes in product visibility |
Brands can combine launch records with competitor product information to evaluate whether their pricing is aligned with comparable sneakers. This approach also helps product teams distinguish between premium launches, everyday footwear, and promotional collections.
A consistent dataset makes it easier to identify price changes, review product positioning, and evaluate how sneaker assortments evolve throughout the year.
Why Is Continuous Product Catalog Monitoring Important for Retail Brands?
Sneaker catalogs change regularly as retailers introduce new collections, update product descriptions, modify prices, and remove discontinued listings. Brands that rely on occasional manual checks may miss important changes in their competitive environment.
Foot Locker New Arrival Catalog Monitoring helps businesses maintain structured records of newly listed and existing sneakers. The process can capture product titles, brand names, model identifiers, colors, categories, sizes, displayed prices, discount details, and listing URLs.
One important application is product assortment comparison. A footwear brand can examine which models are listed within particular categories and compare their displayed prices with similar products. This helps identify assortment gaps and understand how competing products are positioned.
Catalog monitoring also supports product matching. Retailers frequently use different naming conventions for similar sneaker models. Standardizing brand names, model numbers, colors, and product attributes makes cross-retailer comparisons more reliable.
The following historical figures demonstrate the scale of Foot Locker's retail operations:
| Fiscal year | Owned stores at year-end |
|---|
| 2020 | 2,998 |
| 2021 | 2,858 |
| 2022 | 2,714 |
| 2023 | 2,523 |
| 2024 | 2,410 |
| 2025 | Not directly comparable |
| 2026 | Not directly comparable |
Source: Foot Locker's fiscal 2024 Form 10-K. Figures for 2020–2024 are historical year-end store counts. The 2025 acquisition and subsequent integration changed the reporting structure.
For brands, catalog intelligence can support:
- Assortment benchmarking: Compare sneaker categories and model coverage.
- Product identification: Match products using model numbers and attributes.
- Price positioning: Understand how competing products are priced.
- Catalog change detection: Identify newly appearing, updated, or removed listings.
- Market reporting: Maintain historical product records for analysis.
Continuous monitoring makes product intelligence more useful because businesses can analyze changes over time instead of relying on isolated observations.
How Can Brands Evaluate Sneaker Discounts and Promotional Pricing?
Discounts influence sneaker purchasing decisions and provide valuable information about retail positioning. Brands need to understand when promotional prices appear, how deeply products are discounted, and whether discounts remain consistent across different product categories.
Foot Locker Shoe Drop Price Monitoring helps businesses record displayed prices before and after promotional changes. This information can be organized into historical pricing records to evaluate discount patterns and compare promotional activity across sneaker models.
Combining this process with Foot Locker Sneaker Price Scraping allows businesses to compare regular prices, displayed sale prices, discount percentages, and product availability. For example, a pricing analyst can examine whether similar running shoes are being promoted at different discount levels and identify products that maintain their original listed prices.
Retail market information supports the importance of this analysis. Circana reported that U.S. footwear sales during the 2024 holiday period, from Black Friday week through the end of the year, increased 3% compared with the equivalent period in 2023. Its reporting also highlighted consumer willingness to pay close to full price for popular footwear products.
Which pricing indicators should businesses compare?
| Pricing indicator | Calculation or purpose |
|---|
| Original displayed price | Listed regular price |
| Current displayed price | Latest observed price |
| Discount amount | Original price minus current price |
| Discount percentage | Discount amount ÷ original price × 100 |
| Price movement | Difference between two observations |
| Promotional duration | Time between first and last observed promotional prices |
| Availability status | Product's displayed availability at observation time |
A historical pricing dataset helps brands distinguish between temporary promotional activity and longer-lasting price reductions. It can also support seasonal campaign evaluation, competitor benchmarking, and retail pricing reviews.
However, displayed prices should not automatically be treated as completed transaction prices. Shipping costs, taxes, location-based offers, membership benefits, and checkout discounts may affect the final amount paid by customers.
Brands should therefore retain timestamps, currency information, geographic market details, and source URLs with every observation. This makes pricing comparisons more transparent and reliable.
How Can Structured Launch Data Improve Sneaker Pricing Decisions?
Brands need more than individual product listings to understand the competitive sneaker landscape. They need structured datasets that connect products, prices, availability, launch information, and historical observations.
A Foot Locker Shoe Launch Price Dataset can bring these elements together in a standardized format. It allows businesses to compare sneaker models, monitor displayed prices, identify promotional activity, and study product availability across defined periods.
The value of structured retail intelligence is particularly relevant in 2026. According to Circana's August 17, 2026 footwear market update, U.S. footwear industry sales increased 1% in the first half of 2026 compared with the same period in 2025. Performance footwear dollar sales increased 6%, while running shoes recorded 13% growth in both dollar sales and units sold.
These figures highlight the importance of monitoring individual footwear categories rather than relying exclusively on overall market performance.
What should a structured sneaker dataset contain?
| Dataset component | Recommended information |
|---|
| Product identity | Brand, model, SKU, product title |
| Product classification | Sneaker type, category, gender |
| Product attributes | Color, size, material where listed |
| Price information | Original price, current price, currency |
| Promotional details | Discount amount and percentage |
| Availability | Displayed size and product availability |
| Launch information | Published release date and first observation date |
| Source information | Retailer, product URL, collection timestamp |
| Historical records | Previous prices and listing changes |
For business intelligence teams, this dataset can support several important applications. Pricing analysts can compare similar products and review promotional changes. Merchandising teams can identify catalog gaps and evaluate product assortment. Brand managers can study competitor positioning and identify categories that deserve closer attention.
A well-designed dataset should also include validation rules. Duplicate product records should be identified, missing prices should be flagged, and inconsistent product identifiers should be reviewed before analysis.
The result is a more dependable foundation for sneaker pricing decisions, competitive research, and assortment planning.
Why Choose Product Data Scrape?
Reliable retail intelligence requires accurate extraction, structured datasets, and consistent monitoring. The solution combines automated collection, product identification, data cleaning, and historical price tracking to help businesses understand competitive footwear markets. Its Foot Locker Product Data Scraping API approach can support customized data collection based on product categories, pricing fields, availability indicators, and reporting requirements. Businesses can use the resulting information for competitor benchmarking, promotional analysis, assortment planning, and pricing research. Flexible delivery formats and scheduled collection workflows also help data teams integrate retail intelligence into their existing analytical processes.
Conclusion
Sneaker brands need accurate retail intelligence to understand competitor pricing, promotional activity, and changing product availability. Sneaker Pricing Data Scraping helps businesses transform online product listings into structured information for better pricing and merchandising decisions. By combining historical prices, product attributes, discounts, and availability records, businesses can identify market opportunities and improve competitive positioning.
Foot Locker Sneaker Price Scraping provides a practical approach to understanding sneaker retail activity and building consistent pricing datasets.
Ready to strengthen your sneaker market intelligence? Contact Product Data Scrape today to discuss customized sneaker data extraction, competitor price monitoring, and structured retail datasets for smarter business decisions!
FAQs
1. What is sneaker price scraping?
Sneaker price scraping collects publicly accessible product prices, discounts, availability, and product details from retail websites to support competitor analysis, pricing research, and retail intelligence.
2. Why should brands monitor Foot Locker prices?
Monitoring Foot Locker prices helps brands understand competitor positioning, promotional activity, product availability, and changes in sneaker pricing across different product categories.
3. Which data fields can businesses collect?
Businesses can collect product names, brands, SKUs, prices, discounts, sizes, colors, availability indicators, product URLs, and timestamps for structured retail analysis.
4. How frequently should sneaker prices be monitored?
Monitoring frequency depends on business requirements. Daily collection may support regular pricing analysis, while more frequent checks can help track important launches and promotional changes.
5. How can Product Data Scrape help sneaker businesses?
Product Data Scrape provides customized data extraction, product matching, validation, and structured datasets to help sneaker businesses improve competitor monitoring and pricing intelligence.


 Singapore
 EMAIL
 PHONE










.webp)