Introduction
Food-delivery platforms have become an important part of Southeast Asia's digital commerce ecosystem, with delivery fees forming a visible component of the total cost paid by consumers. For restaurants, food brands, retailers, and marketplace researchers, monitoring these charges over time can provide a structured view of how delivery economics vary by geography, distance, promotions, order conditions, and service models.
This report examines GrabFood Weekly Delivery Fee Benchmark Report 2026 across the Philippines, Singapore, and Malaysia. Grab states that GrabFood delivery fees are influenced by operational factors such as distance between the restaurant and customer, while the exact fee is displayed in the platform before checkout. (Grab)
The 2020–2026 period is particularly relevant because food delivery expanded rapidly during and after the pandemic, while platforms introduced different delivery options, promotions, minimum-order conditions, and service formats. Grab has also documented that its delivery fees are kept constant while users browse, providing greater visibility before an order is placed. This creates opportunities for an FMCG & Food Scraper to collect and analyze recurring delivery-fee observations across markets, merchants, and service conditions. (Grab)
For businesses, weekly monitoring can transform individual delivery-fee observations into a historical dataset. This can support regional comparisons, merchant benchmarking, pricing analysis, promotional tracking, and operational research.
Comparing Delivery Charges Across the Philippine Market
The Philippine food-delivery market has undergone considerable change since 2020. During the early pandemic period, online food ordering became an important channel for restaurants and consumers as movement restrictions affected traditional dining. Grab expanded its delivery ecosystem while merchants increasingly depended on digital ordering and delivery infrastructure.
Historical Grab Philippines information demonstrates that delivery fees can be connected to distance and that the amount paid by customers can differ from the underlying fare paid to delivery partners. For example, a Grab Philippines driver-information page published in 2019 described a P49 customer delivery fee in a particular fare scheme and additional earnings adjustments based on distance. This is historical information and should not be treated as the current consumer fee. (Grab)
By 2023–2025, delivery-fee analysis had become more relevant as consumers encountered different promotions, restaurant locations, delivery options, and order conditions. In 2026, businesses can use Philippines GrabFood Delivery Fee Benchmark datasets to compare observations across cities, restaurant categories, distance bands, and weeks.
Philippine Monitoring Framework
| Metric |
Example Analysis |
| Delivery fee |
Weekly fee movement |
| Distance |
Fee versus delivery distance |
| Restaurant category |
Fee differences by segment |
| Location |
Metro/city comparison |
| Minimum order |
Conditions attached to delivery |
| Promotion |
Free or discounted delivery |
| Delivery time |
Fee versus estimated time |
2020–2026 Development
From 2020 through 2022, pandemic-driven changes made delivery a central operating channel for many restaurants. From 2023 onward, the market shifted toward more normalized digital ordering, greater promotional variety, and more sophisticated delivery options. In 2026, historical weekly data can help distinguish one-time promotions from recurring fee patterns. Rather than treating one displayed fee as representative of an entire market, businesses can use Singapore GrabFood Weekly Delivery Data Scraping to capture the same restaurants, locations, and order conditions repeatedly and calculate weekly averages, medians, ranges, and fee distributions.
This approach is especially useful because Grab's Philippines platform confirms that delivery fees are calculated based on distance between the restaurant and customer. (Grab)
Understanding Regional Pricing and Delivery Economics
Southeast Asia does not operate as a single uniform food-delivery market. Currency, geography, urban density, restaurant concentration, delivery distances, consumer behavior, and platform promotions can all influence the final delivery charge observed by customers. Malaysia Weekly GrabFood Delivery Fee Tracking can help businesses monitor these market-specific variations and identify recurring changes in delivery fees across Malaysian locations and restaurant segments.
Grab's current consumer information for the Philippines, Singapore, and Malaysia states that delivery fees are calculated based on distance between the pickup and drop-off locations. (Grab) This provides an important basis for cross-market monitoring: comparisons should account for location and distance rather than simply comparing nominal fees between countries.
The GrabFood Delivery Fee Trends Across Southeast Asia dataset can therefore organize weekly observations by market, city, restaurant, distance, order value, promotion status, and delivery option.
Regional Comparison Structure
| Variable |
Philippines |
Singapore |
Malaysia |
| Currency |
PHP |
SGD |
MYR |
| Distance-based fee calculation |
Yes |
Yes |
Yes |
| Free-delivery offers |
Available |
Available |
Available |
| Location sensitivity |
High |
High |
High |
| Weekly benchmarking |
Applicable |
Applicable |
Applicable |
Platform fee policies can vary by order, merchant, location, and promotion; these fields should be captured at observation level.
2020–2026 Development
Between 2020 and 2022, delivery became a critical alternative to physical restaurant visits. By 2023–2024, platforms were developing more differentiated delivery products and promotional mechanisms. Grab Singapore, for example, introduced a 99-cent pre-order delivery pilot in 2023 for selected locations and also promoted delivery-fee-saving mechanisms. (Grab)
By 2025–2026, fee monitoring therefore needs to capture more than the headline delivery charge. Businesses should record whether a fee is standard, discounted, waived, capped, or connected to a specific promotion. A structured Pricing intelligence workflow can then distinguish base pricing from promotional pricing and help businesses understand weekly movements without confusing temporary offers with underlying fee structures.
Building a Weekly Dataset for Singapore
Singapore provides a particularly useful market for structured delivery-fee monitoring because GrabFood operates across clearly identified geographic zones. Grab's Singapore platform currently describes 11 GrabFood zones covering areas including Central, North, Northeast, East, Southeast, Downtown, Southwest, West, and Northwest. Extract GrabFood Grocery & Gourmet Food Data can help businesses capture structured product, pricing, category, and availability information across these geographic segments. (Grab)
GrabFood Singapore states that delivery fees depend on operational factors such as distance from the restaurant to the customer's location. It also provides a free-delivery section where participating restaurants may offer zero delivery fees. (GrabFood)
Singapore GrabFood Weekly Delivery Data Scraping can therefore focus on collecting recurring observations across selected zones and merchant categories.
Singapore Data Fields
| Field |
Purpose |
| Restaurant |
Merchant identification |
| Restaurant zone |
Geographic comparison |
| Delivery fee |
Primary benchmark |
| Estimated delivery time |
Service comparison |
| Order minimum |
Cost-condition analysis |
| Promotion |
Identify discounted delivery |
| Cuisine/category |
Segment analysis |
| Timestamp |
Weekly trend tracking |
2020–2026 Development
Singapore's dense urban environment and geographically defined delivery zones provide useful conditions for comparing delivery fees across locations. During 2020–2021, delivery became especially important as restaurants adapted to pandemic restrictions. In 2022–2023, platforms experimented with alternative ordering and delivery formats. Grab Singapore's 2023 pre-order pilot, for example, offered selected customers a 99-cent delivery fee for qualifying orders. (Grab)
By 2024–2026, monitoring can focus on the interaction between delivery charges, promotions, restaurant location, and delivery times. Weekly collection can identify whether a particular fee remains stable, changes during specific periods, or is frequently offset by free-delivery campaigns.
Monitoring Weekly Changes in Malaysia
Malaysia represents another important market for regional delivery-fee benchmarking. Grab Malaysia states that delivery fees are calculated based on distance between pickup and drop-off locations, while the exact amount is shown through the food-delivery app. The platform also identifies participating restaurants offering free delivery. (Grab)
Historical Grab Malaysia initiatives show how delivery-fee promotions have been used to influence affordability and ordering behavior. In 2020, Grab Malaysia announced delivery fees as low as RM2 for selected nearby restaurants and described subsidies for fees below RM5. (Grab) Another 2020 announcement described selected local favourites with delivery fees as low as 50 cents and reported that orders with delivery fees below RM5 had increased more than threefold in Klang Valley following an earlier fee initiative. (Grab) These figures are historical and should not be interpreted as current 2026 fee levels.
Malaysia Monitoring Metrics
| Metric |
Application |
| Weekly delivery fee |
Trend measurement |
| Distance |
Fee relationship |
| City/region |
Geographic comparison |
| Merchant type |
Segment benchmarking |
| Promotional status |
Promotion analysis |
| Delivery estimate |
Service comparison |
| Order conditions |
Total-cost context |
2020–2026 Development
The 2020–2022 period demonstrated how delivery subsidies and low-fee campaigns could be used during a period of unusual market disruption. From 2023 onward, businesses increasingly had to distinguish between standard delivery pricing and promotional offers. In 2026, weekly collection can provide a more consistent baseline by recording the same merchant and location combinations over time.
This creates a historical view of fee volatility and promotional frequency. It also allows businesses to compare Malaysian observations with corresponding Philippine and Singaporean datasets after converting currencies and normalizing distance bands.
Establishing Comparable Cost Benchmarks
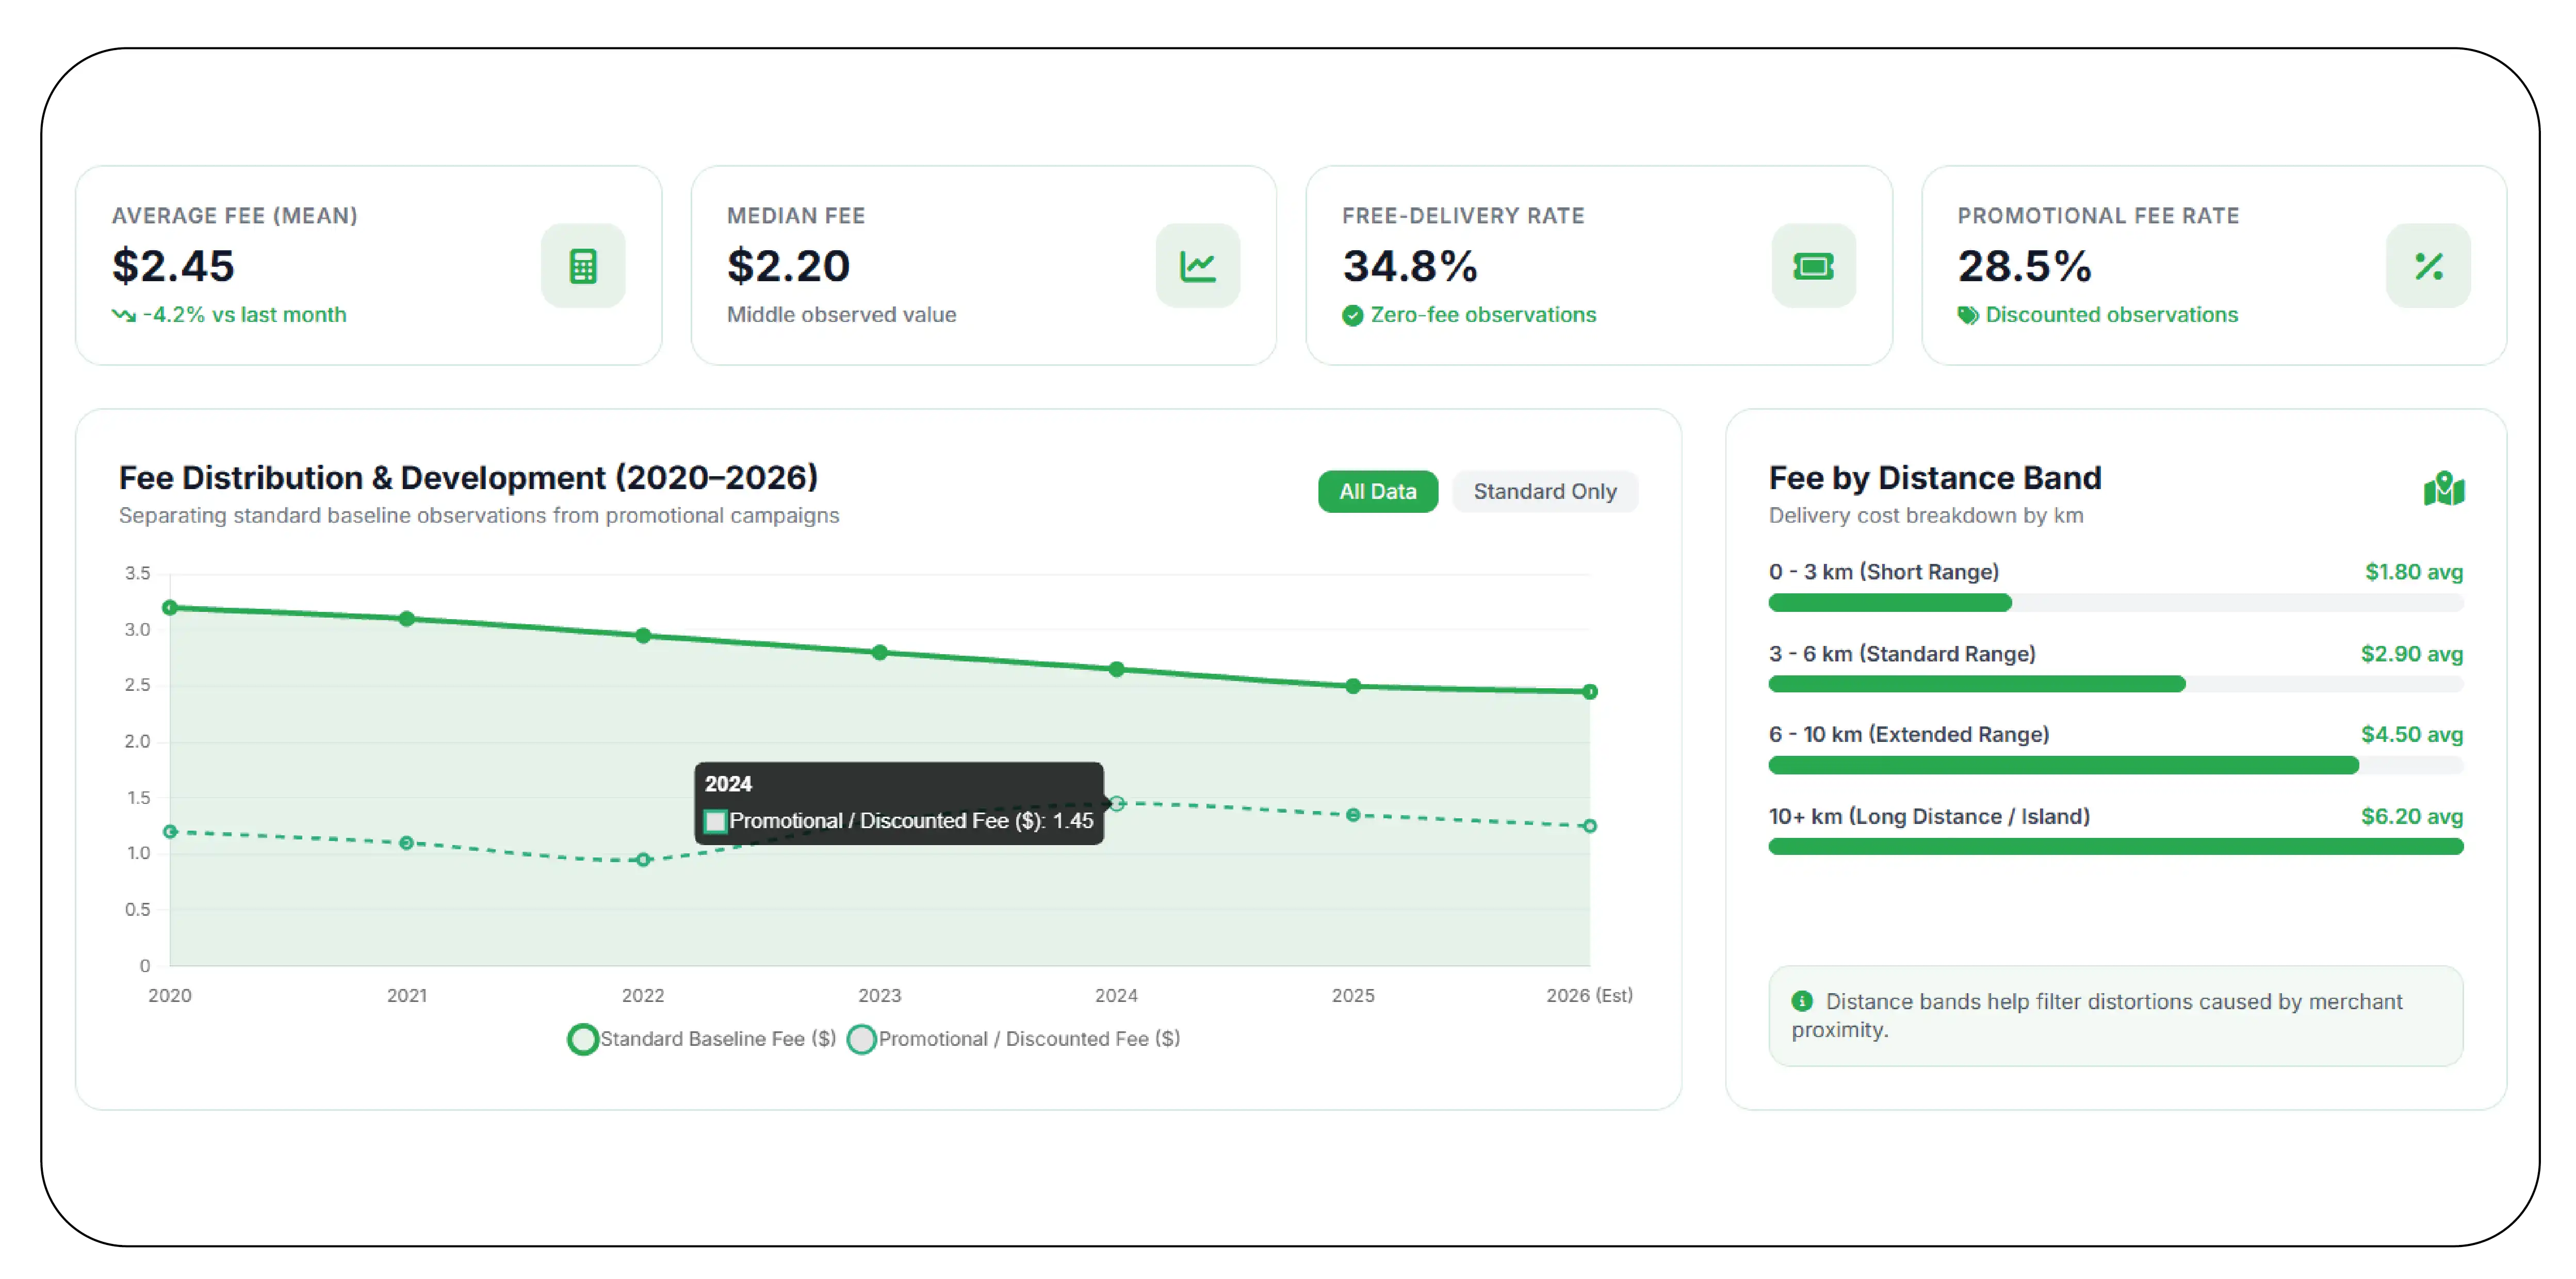
A useful delivery-fee benchmark needs standardized methodology. Simply collecting the lowest visible delivery charge each week can produce an incomplete picture because the lowest fee may be connected to a promotion, a specific distance, a particular merchant, or an order threshold.
The GrabFood Weekly Delivery Cost Benchmark 2026 should therefore separate standard observations from promotional observations and record the conditions attached to every fee.
Recommended Benchmark Metrics
| Benchmark |
Calculation |
| Average fee |
Mean weekly delivery fee |
| Median fee |
Middle observed value |
| Minimum fee |
Lowest observed fee |
| Maximum fee |
Highest observed fee |
| Fee range |
Maximum minus minimum |
| Free-delivery rate |
Share of zero-fee observations |
| Promotional fee rate |
Share of discounted observations |
| Fee by distance |
Delivery cost by distance band |
2020–2026 Development
During 2020–2022, promotional pricing played an important role in keeping delivery accessible while restaurants faced major operating disruptions. By 2023–2024, consumers encountered a wider mix of standard fees, free-delivery campaigns, subscription-style benefits, and special delivery formats. Singapore's 2023 initiatives illustrate how alternative delivery arrangements can produce significantly different fee observations. (Grab)
By 2025–2026, weekly benchmarking can provide a stronger analytical foundation because businesses can distinguish the underlying distribution of fees from short-term promotions. The methodology should also preserve country-specific currencies rather than combining raw monetary values. Currency conversion can be added as a separate analytical layer when regional comparisons are required.
Combining Delivery Cost and Service-Time Observations
Delivery cost is only one component of the food-delivery experience. Businesses may also need to understand how fees relate to estimated delivery times, restaurant distance, order conditions, and delivery options.
Grab has historically introduced delivery features designed around different customer priorities. In Malaysia, for example, GrabFood promoted a Premium Delivery option that offered guaranteed delivery times for eligible orders, illustrating how delivery speed can be packaged separately from standard delivery service. (Grab)
A structured Delivery fee & time tracking dataset can therefore connect delivery charges with estimated time rather than analyzing them independently.
Fee and Time Framework
| Data Point |
Analysis |
| Delivery fee |
Cost comparison |
| Estimated time |
Speed comparison |
| Distance |
Operational context |
| Restaurant location |
Geographic factor |
| Order value |
Cost-condition analysis |
| Delivery option |
Service-level comparison |
| Promotion |
Adjusted fee analysis |
| Timestamp |
Historical tracking |
2020–2026 Development
The 2020–2022 period accelerated consumer adoption of delivery services and made delivery times a prominent operational consideration. From 2023 onward, platforms increasingly differentiated delivery experiences through pre-ordering, free-delivery campaigns, alternative service options, and merchant-specific offers. Grab Singapore's 2023 99-cent pre-order pilot is one documented example. (Grab)
By 2026, businesses can combine weekly fee and delivery-time observations to study whether lower fees are associated with different estimated delivery windows, whether promotional offers affect service expectations, and how these patterns differ between countries. This creates a richer dataset than fee-only monitoring.
Why Choose Product Data Scrape?
Product Data Scrape can support organizations that need structured, recurring datasets from digital marketplaces, food-delivery platforms, retail websites, and other online sources. For delivery-fee research, the objective is to transform individual platform observations into standardized historical records that can be analyzed over weeks and months. GrabFood Weekly Delivery Fee Benchmark Report 2026 provides a structured framework for tracking delivery charges, pricing variations, promotional patterns, and regional fee trends over time.
A specialized workflow can capture fields such as restaurant name, cuisine, location, delivery fee, estimated delivery time, promotional status, order conditions, timestamp, and market. These fields can then be normalized across countries to create a consistent analytical structure.
For organizations requiring Data scraping for Singapore retailers, the workflow can be configured around specific geographic zones, merchant categories, restaurant lists, and observation schedules. Grab Singapore's 11 published GrabFood zones provide one possible geographic framework for location-based monitoring. (Grab)
Key capabilities can include:
- Scheduled weekly data collection
- Restaurant and merchant monitoring
- Delivery-fee tracking
- Estimated delivery-time tracking
- Promotion and free-delivery identification
- Geographic segmentation
- Currency normalization
- Historical data storage
- Data validation and deduplication
- Analytics-ready structured datasets
The resulting information can support restaurant benchmarking, competitive research, pricing analysis, marketplace studies, and regional market reports.
Conclusion
Food delivery across the Philippines, Singapore, and Malaysia has developed considerably since 2020. Delivery fees are not necessarily fixed across all orders; Grab's current country-specific information states that fees are influenced by distance and that exact charges can be checked through the platform before checkout. This makes GrabFood Weekly Delivery Fee Benchmark Report 2026 useful for tracking recurring delivery-fee patterns, regional differences, and changes in customer-facing delivery costs. (Grab)
The availability of different promotions and service options makes weekly monitoring useful for businesses that need to understand changes rather than isolated fee observations. Historical examples from Malaysia and Singapore also demonstrate that delivery-fee structures and promotional mechanisms can evolve over time. (Grab)
For brands and restaurant groups, Market Share Analytics for Brands can be complemented by delivery-cost observations to provide additional context around marketplace positioning, geographic coverage, and consumer-facing delivery economics. These datasets should be interpreted alongside restaurant availability, order conditions, promotions, and location because a single delivery-fee figure does not represent the full market.
The 2026 research environment therefore benefits from consistent collection, standardized fields, weekly timestamps, and country-specific benchmarking. Such an approach can help businesses identify recurring patterns, compare markets, monitor promotions, and maintain a historical reference for future analysis.
Build a structured weekly delivery-fee dataset with Product Data Scrape to monitor pricing, delivery times, promotions, and regional trends across the Philippines, Singapore, and Malaysia!


 Singapore
 EMAIL
 PHONE














.webp)