At a glance
| Item |
Detail |
| Client |
Multi-store stationery and general-merchandise retailer launching online ordering |
| Market |
India |
| Sources |
Major e-commerce marketplaces and brand websites |
| Scope |
18,000 stationery, office and FMCG products |
| Output |
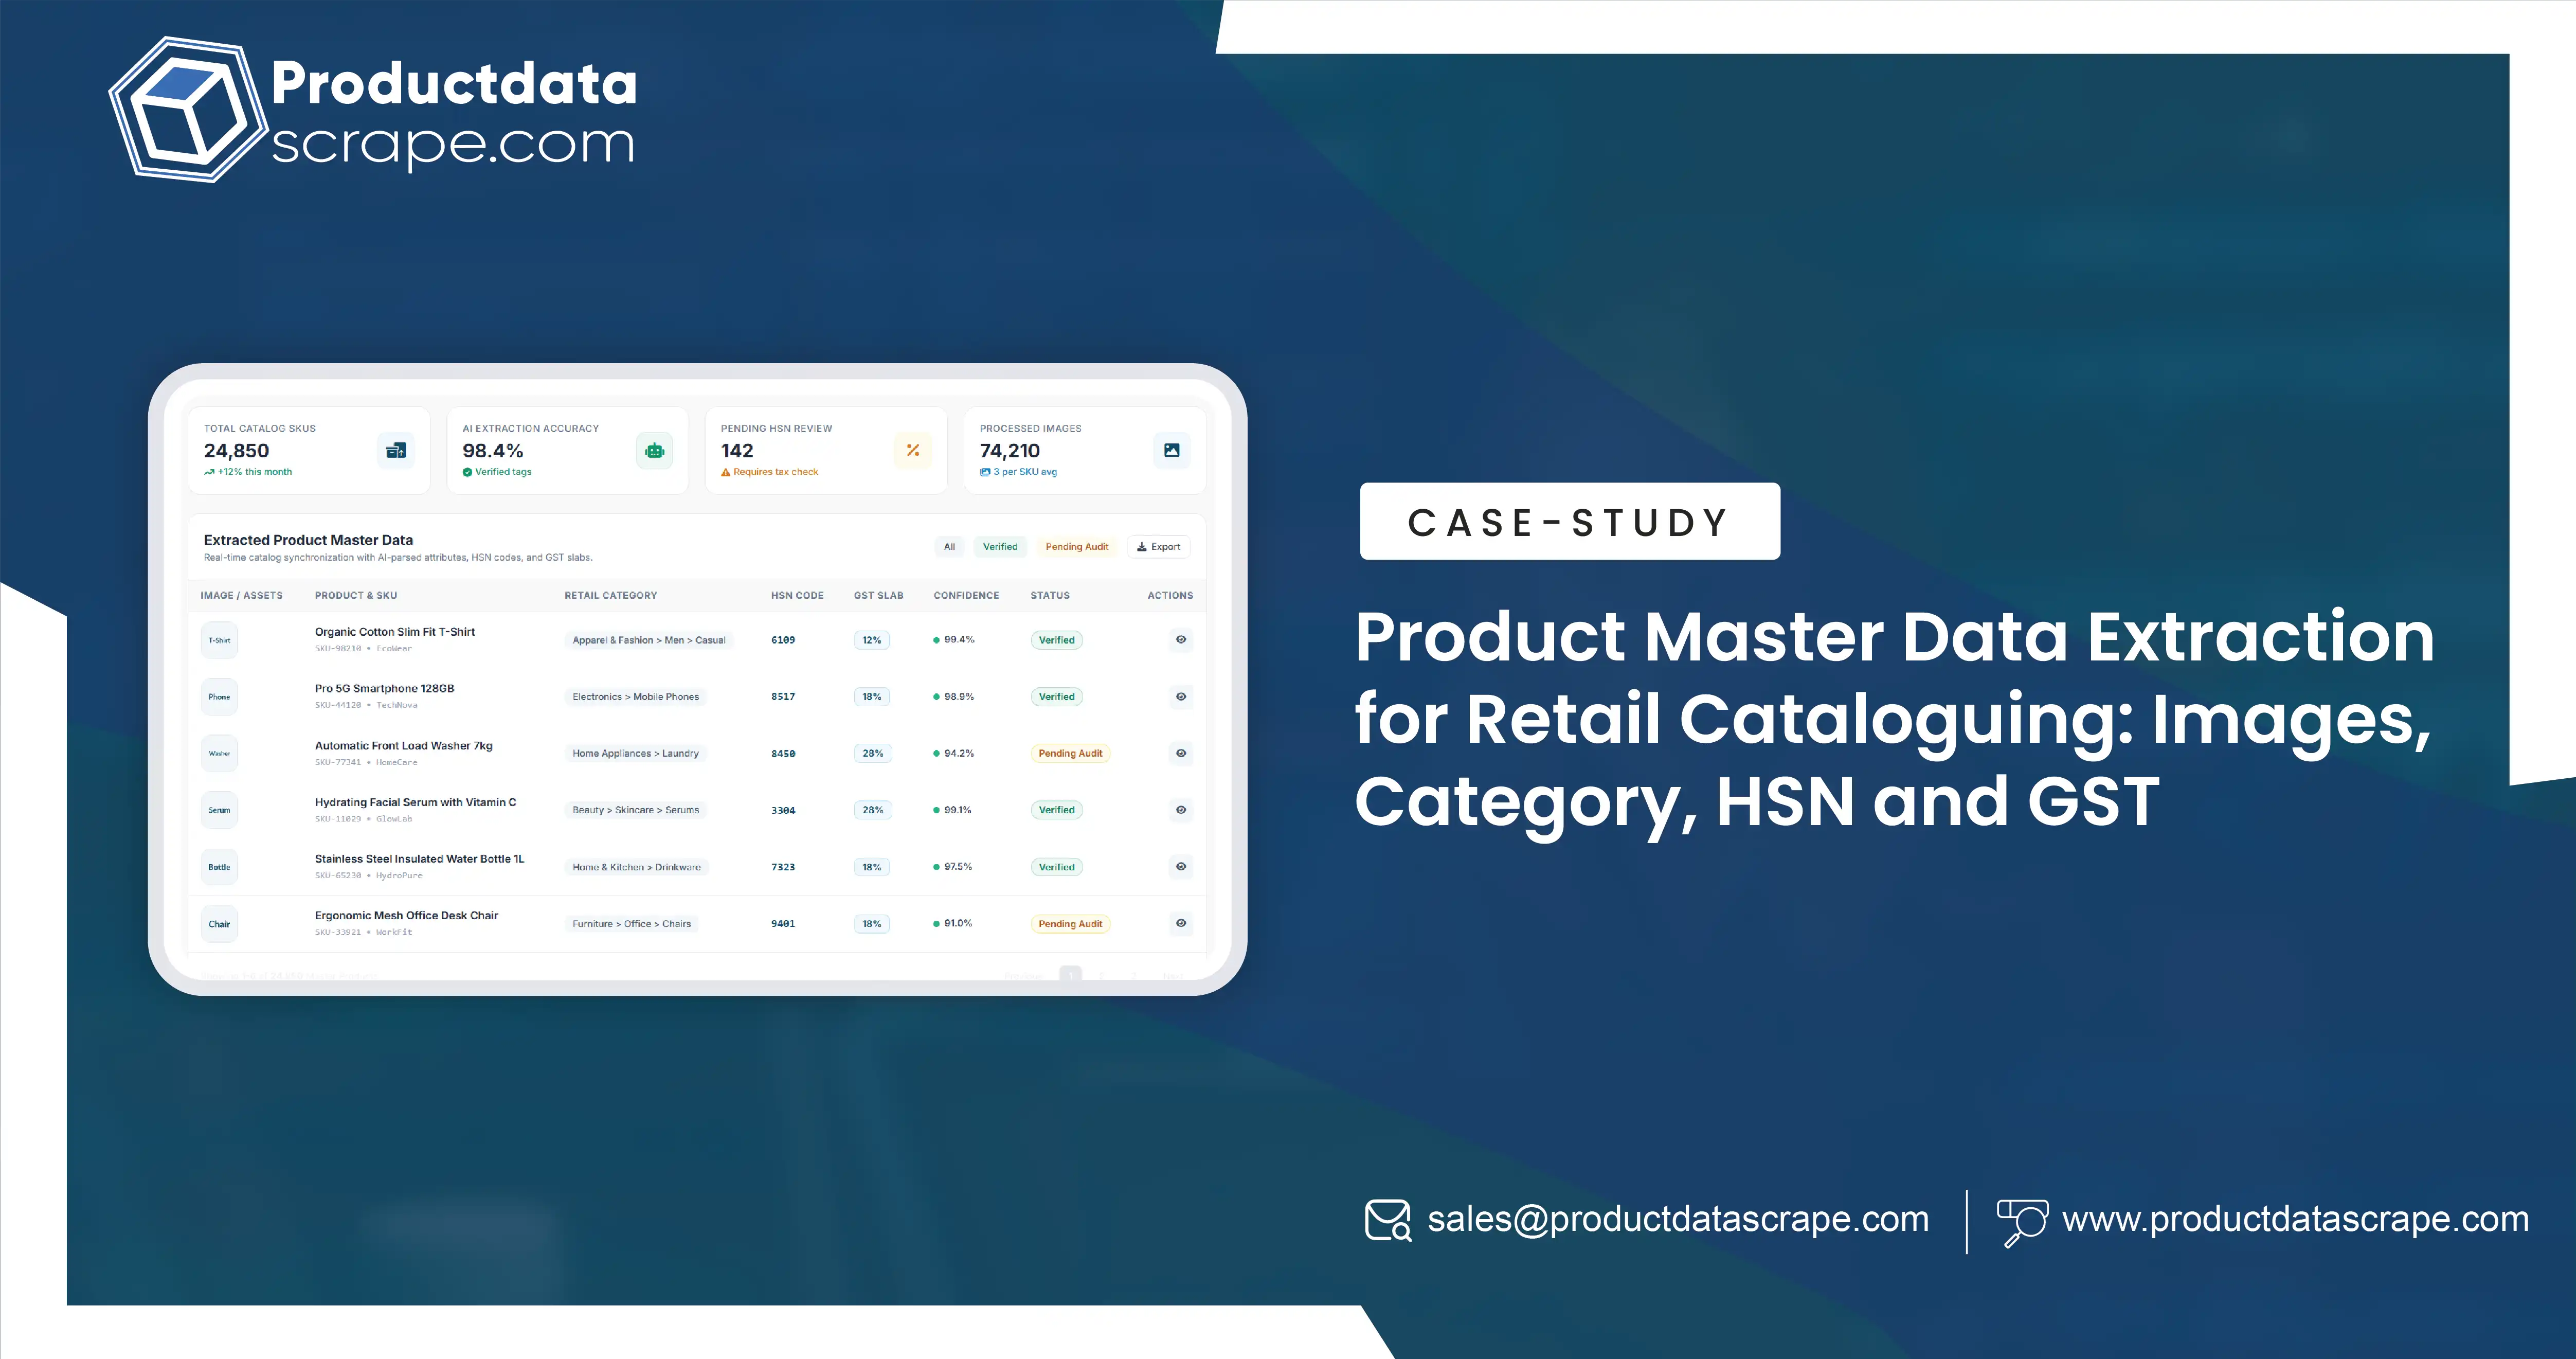
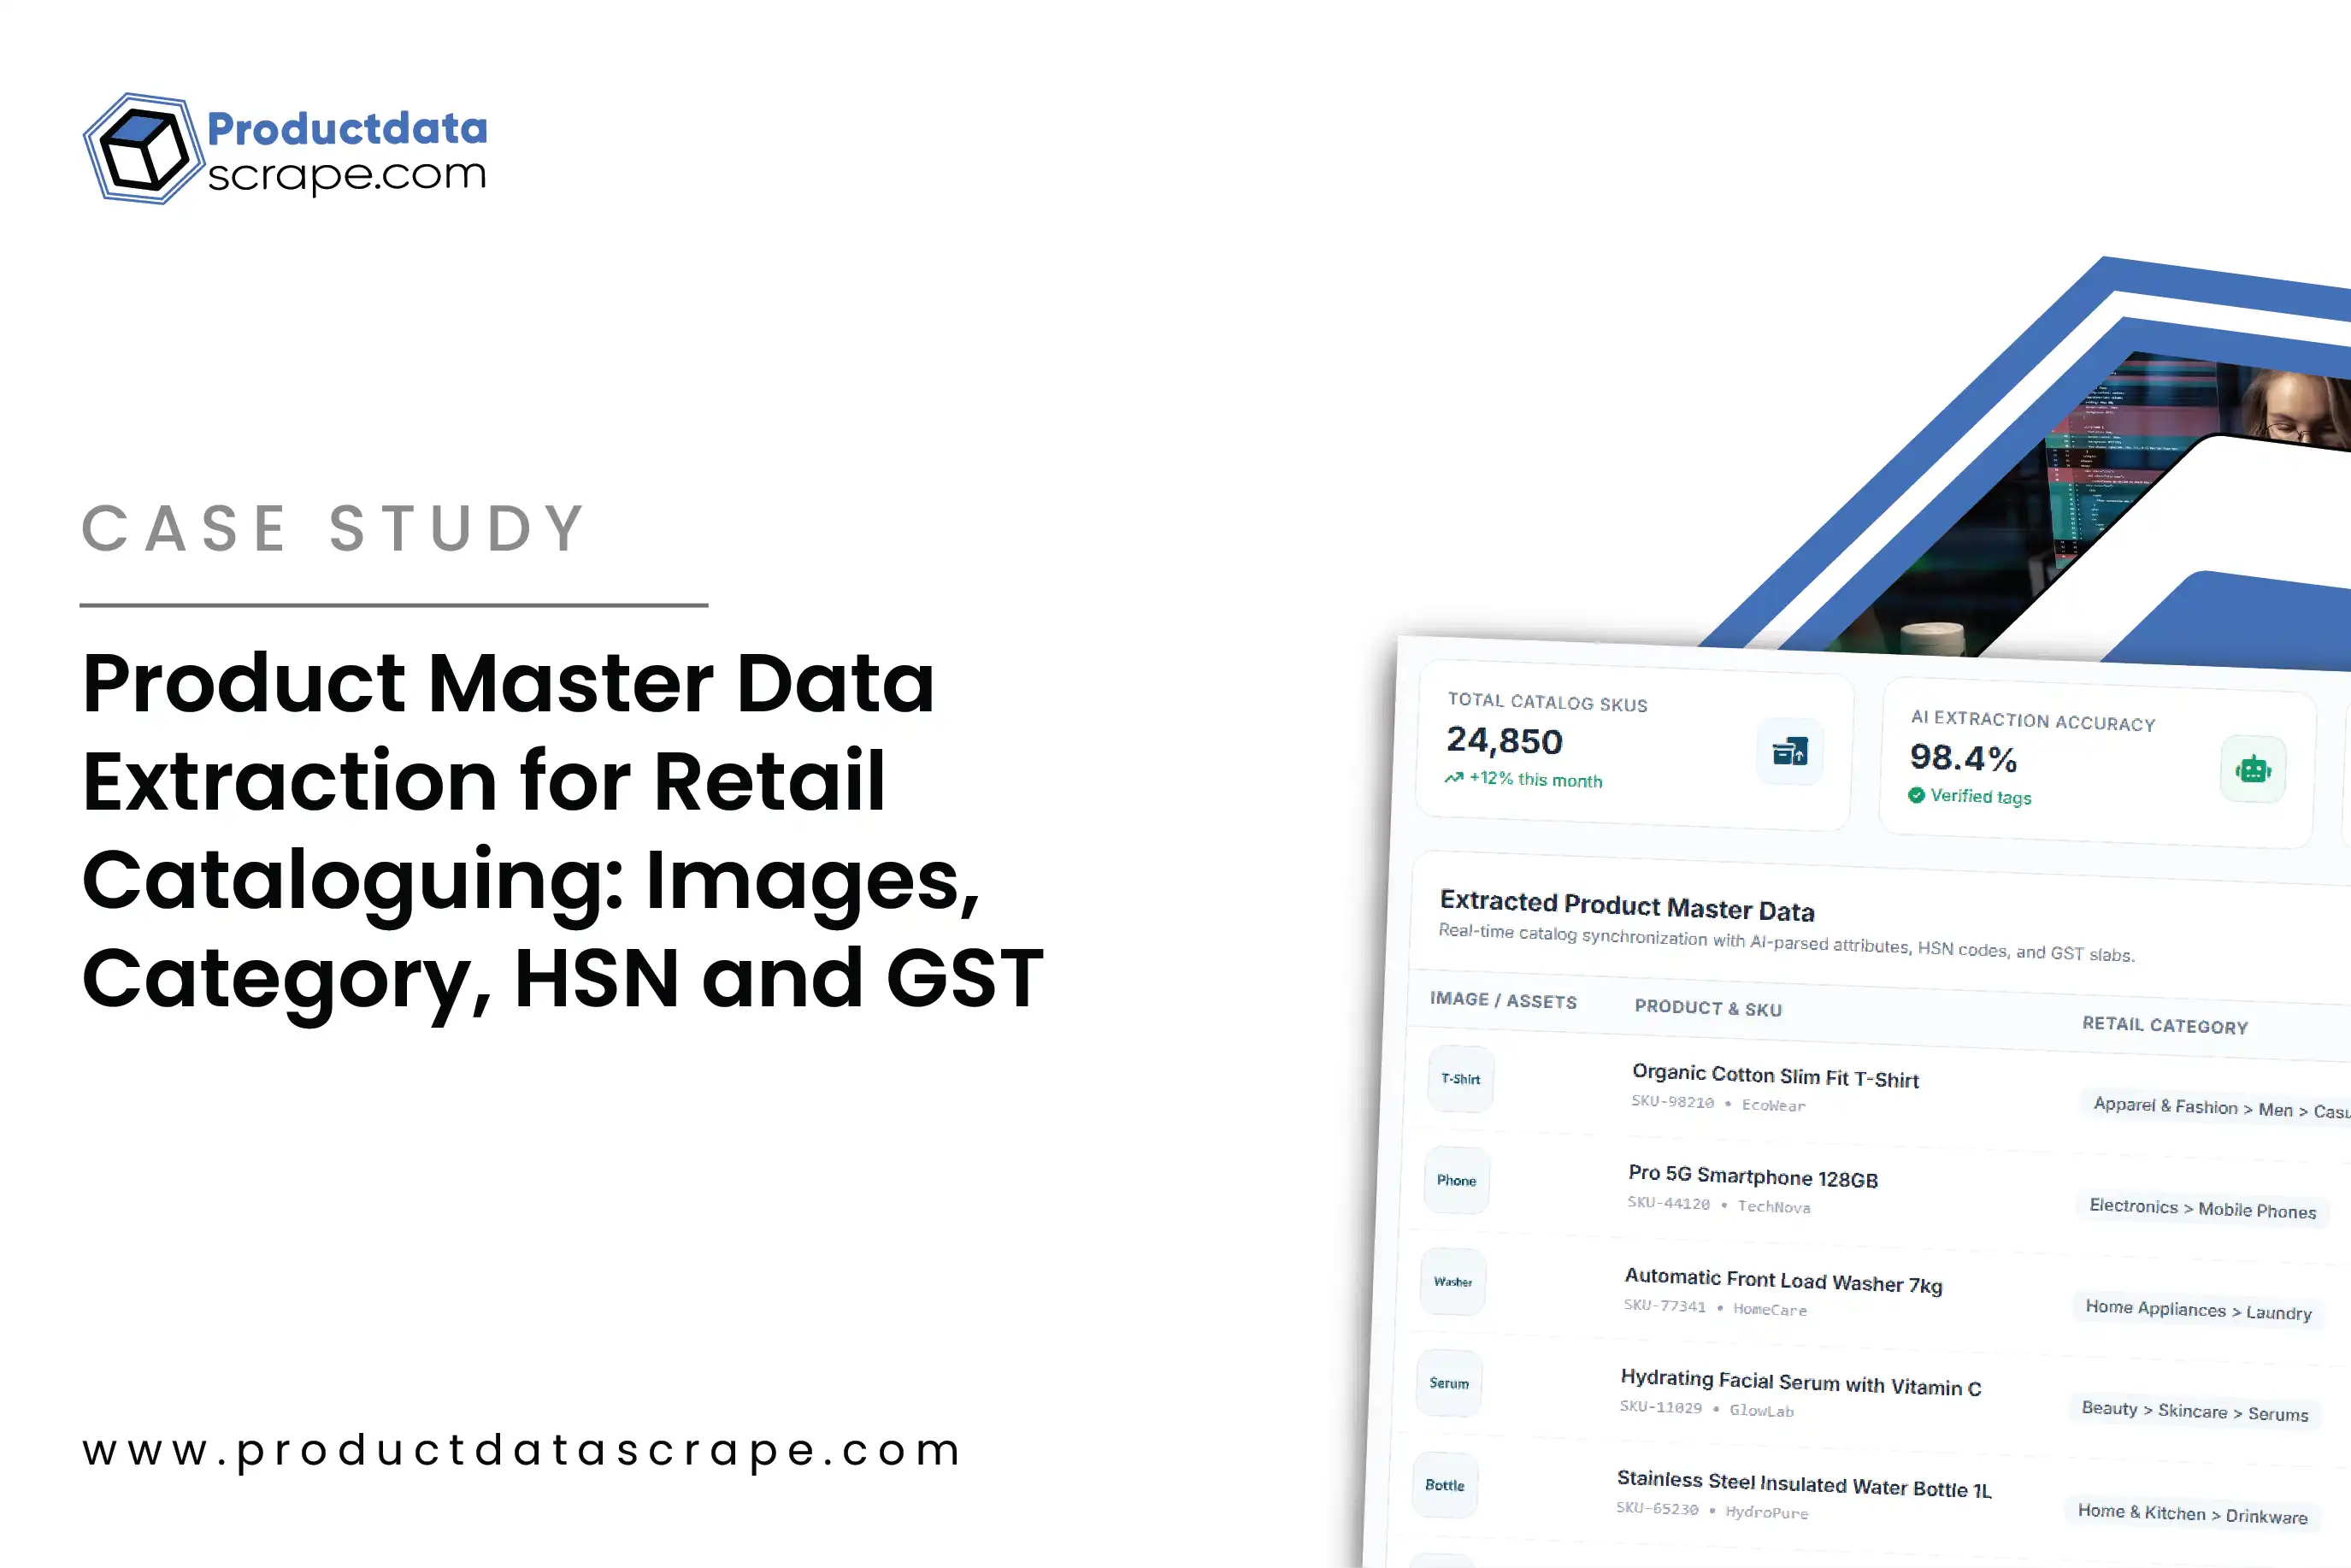
Product master sheet with images, categories, HSN codes, GST rates, MRP and attributes |
| Delivery |
Excel and CSV, with image files organised by SKU |
| Service |
Product master data extraction by Product Data Scrape |
The client
The client runs stationery and general-merchandise stores and was launching online ordering and a new billing system. It needed a "readymade master data sheet for stationery products (images, categories, HSN code, GST, rates)." Similar requests reached Product Data Scrape from other businesses: a company seeking a database of FMCG products "useful for cataloguing, product listing and product intelligence," and a buyer needing barcode, product name, brand, category and image for FMCG items.
Building a catalogue manually would have taken the client's team months.
The challenge
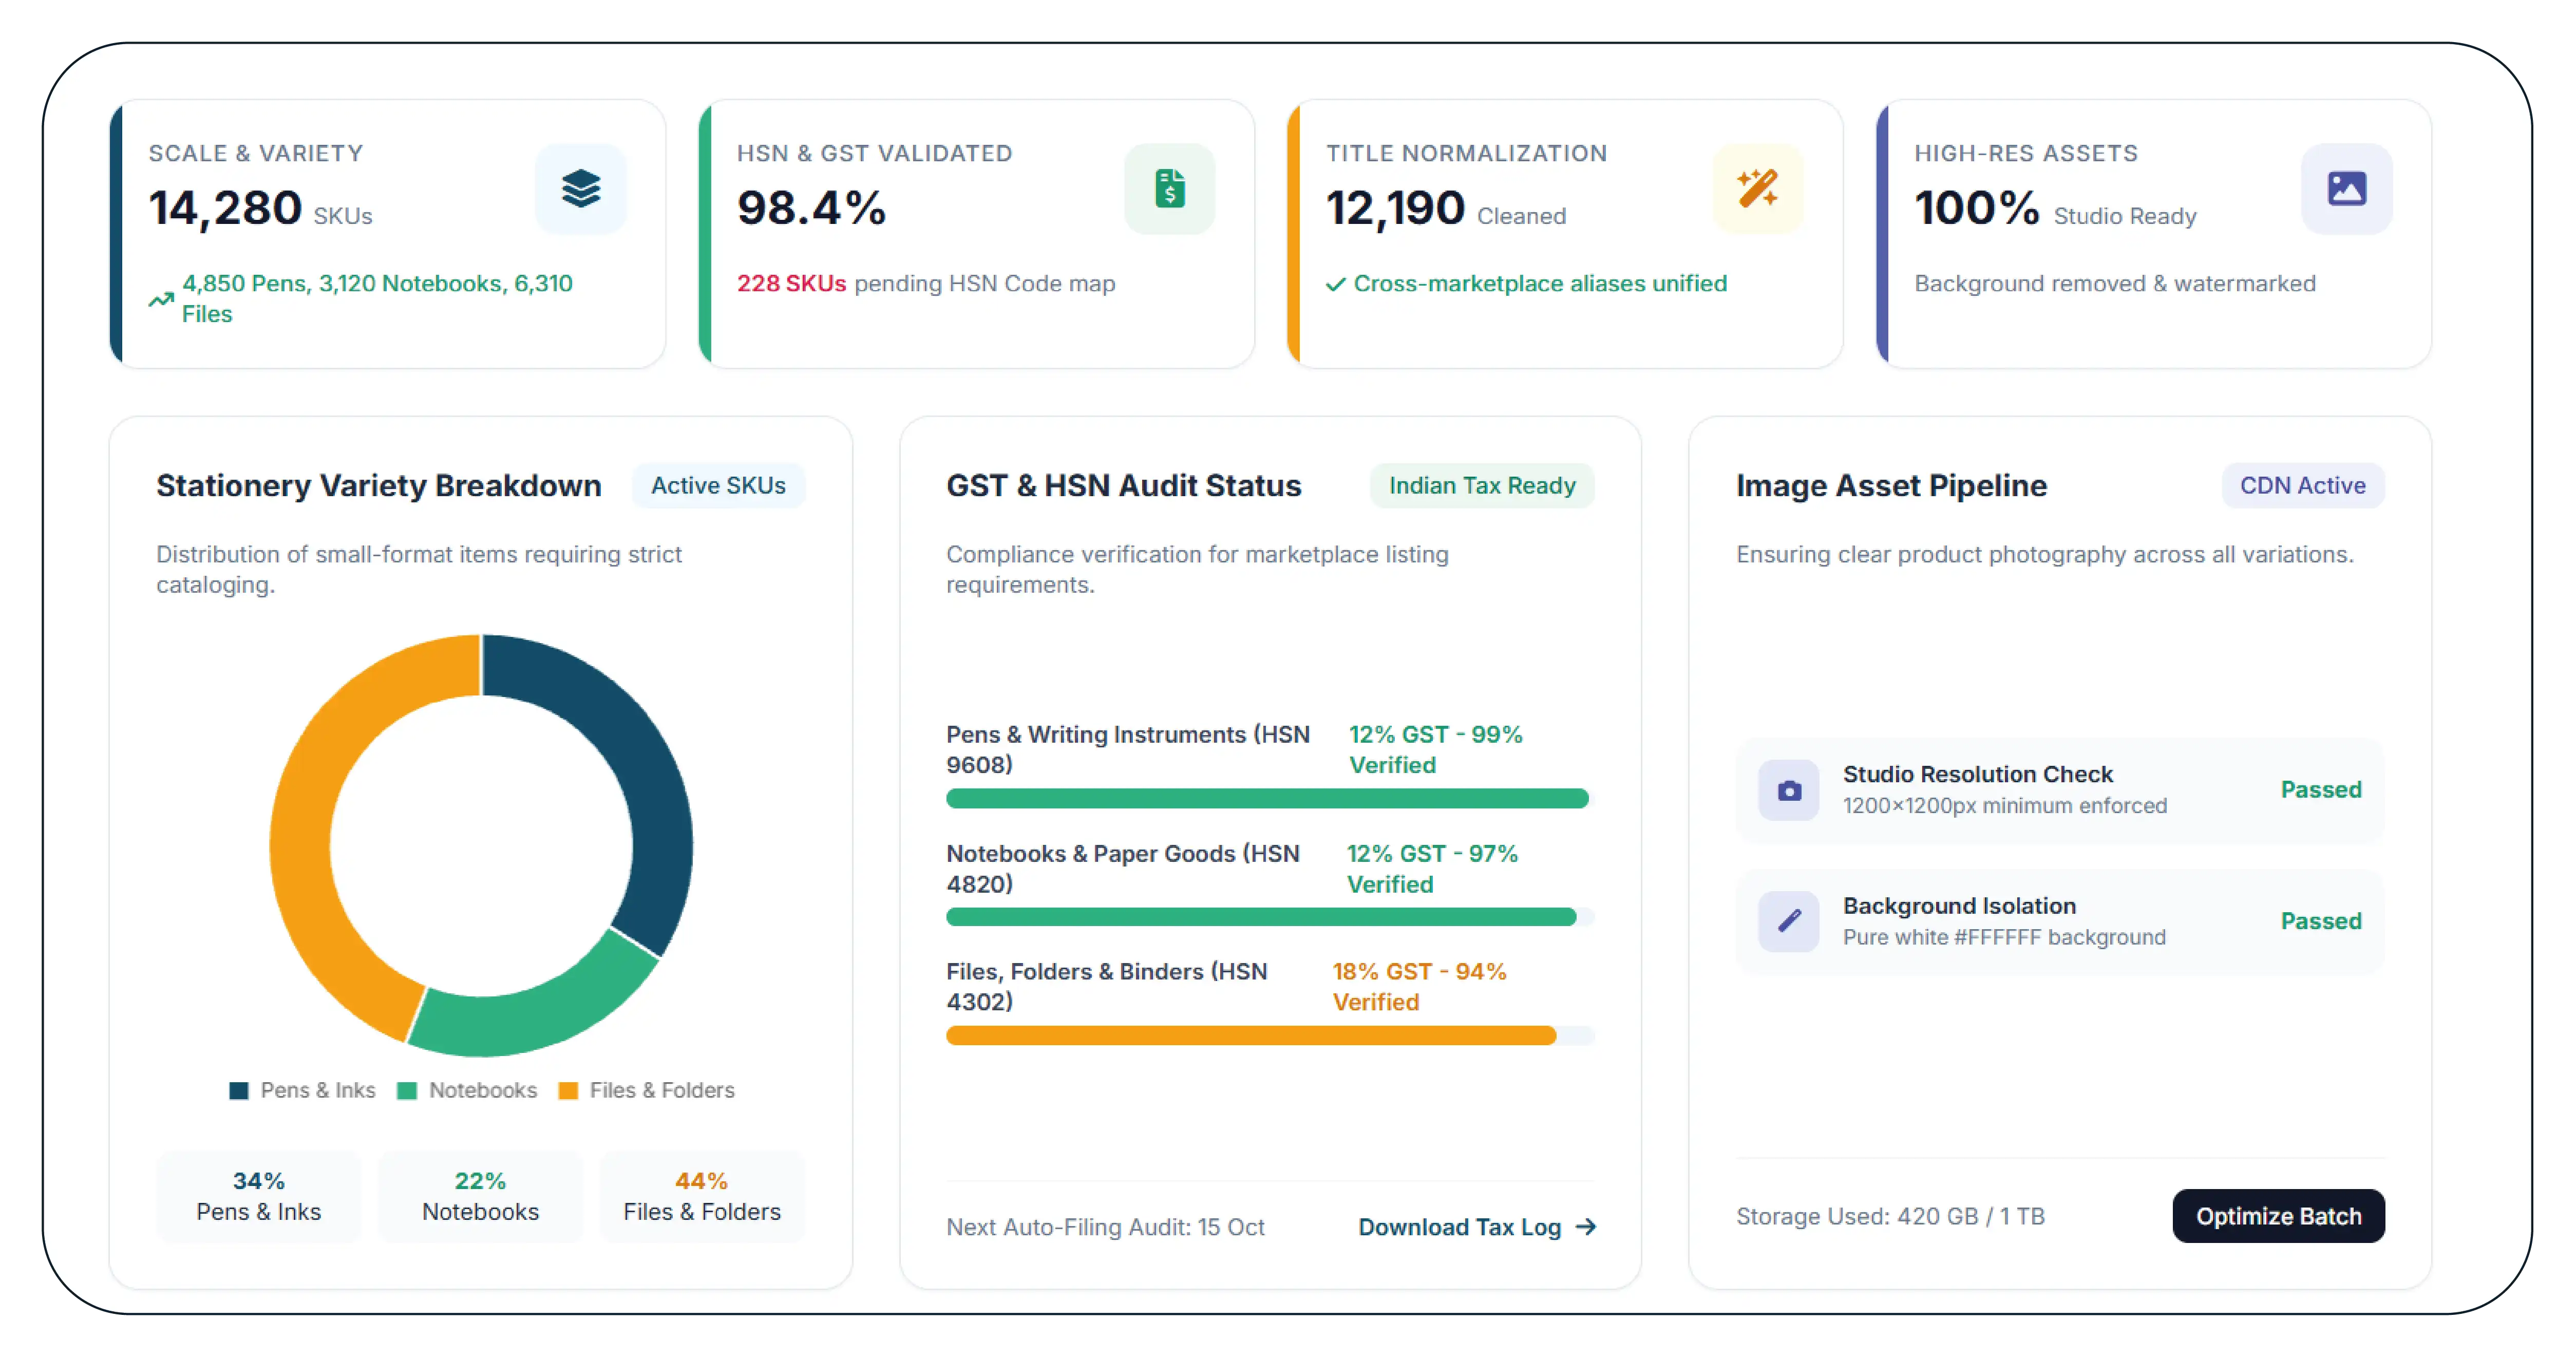
Scale and variety. Stationery has thousands of small, similar products: pens in many colours, notebooks in many page counts, files in many sizes.
Tax data. Indian billing needs the correct HSN code and GST rate for each product. Marketplaces do not always show these, and HSN codes must be consistent with the product type.
Inconsistent naming. The same product appears with different titles on different sites.
Image quality. The new online store needed clear product images for every SKU.
The solution
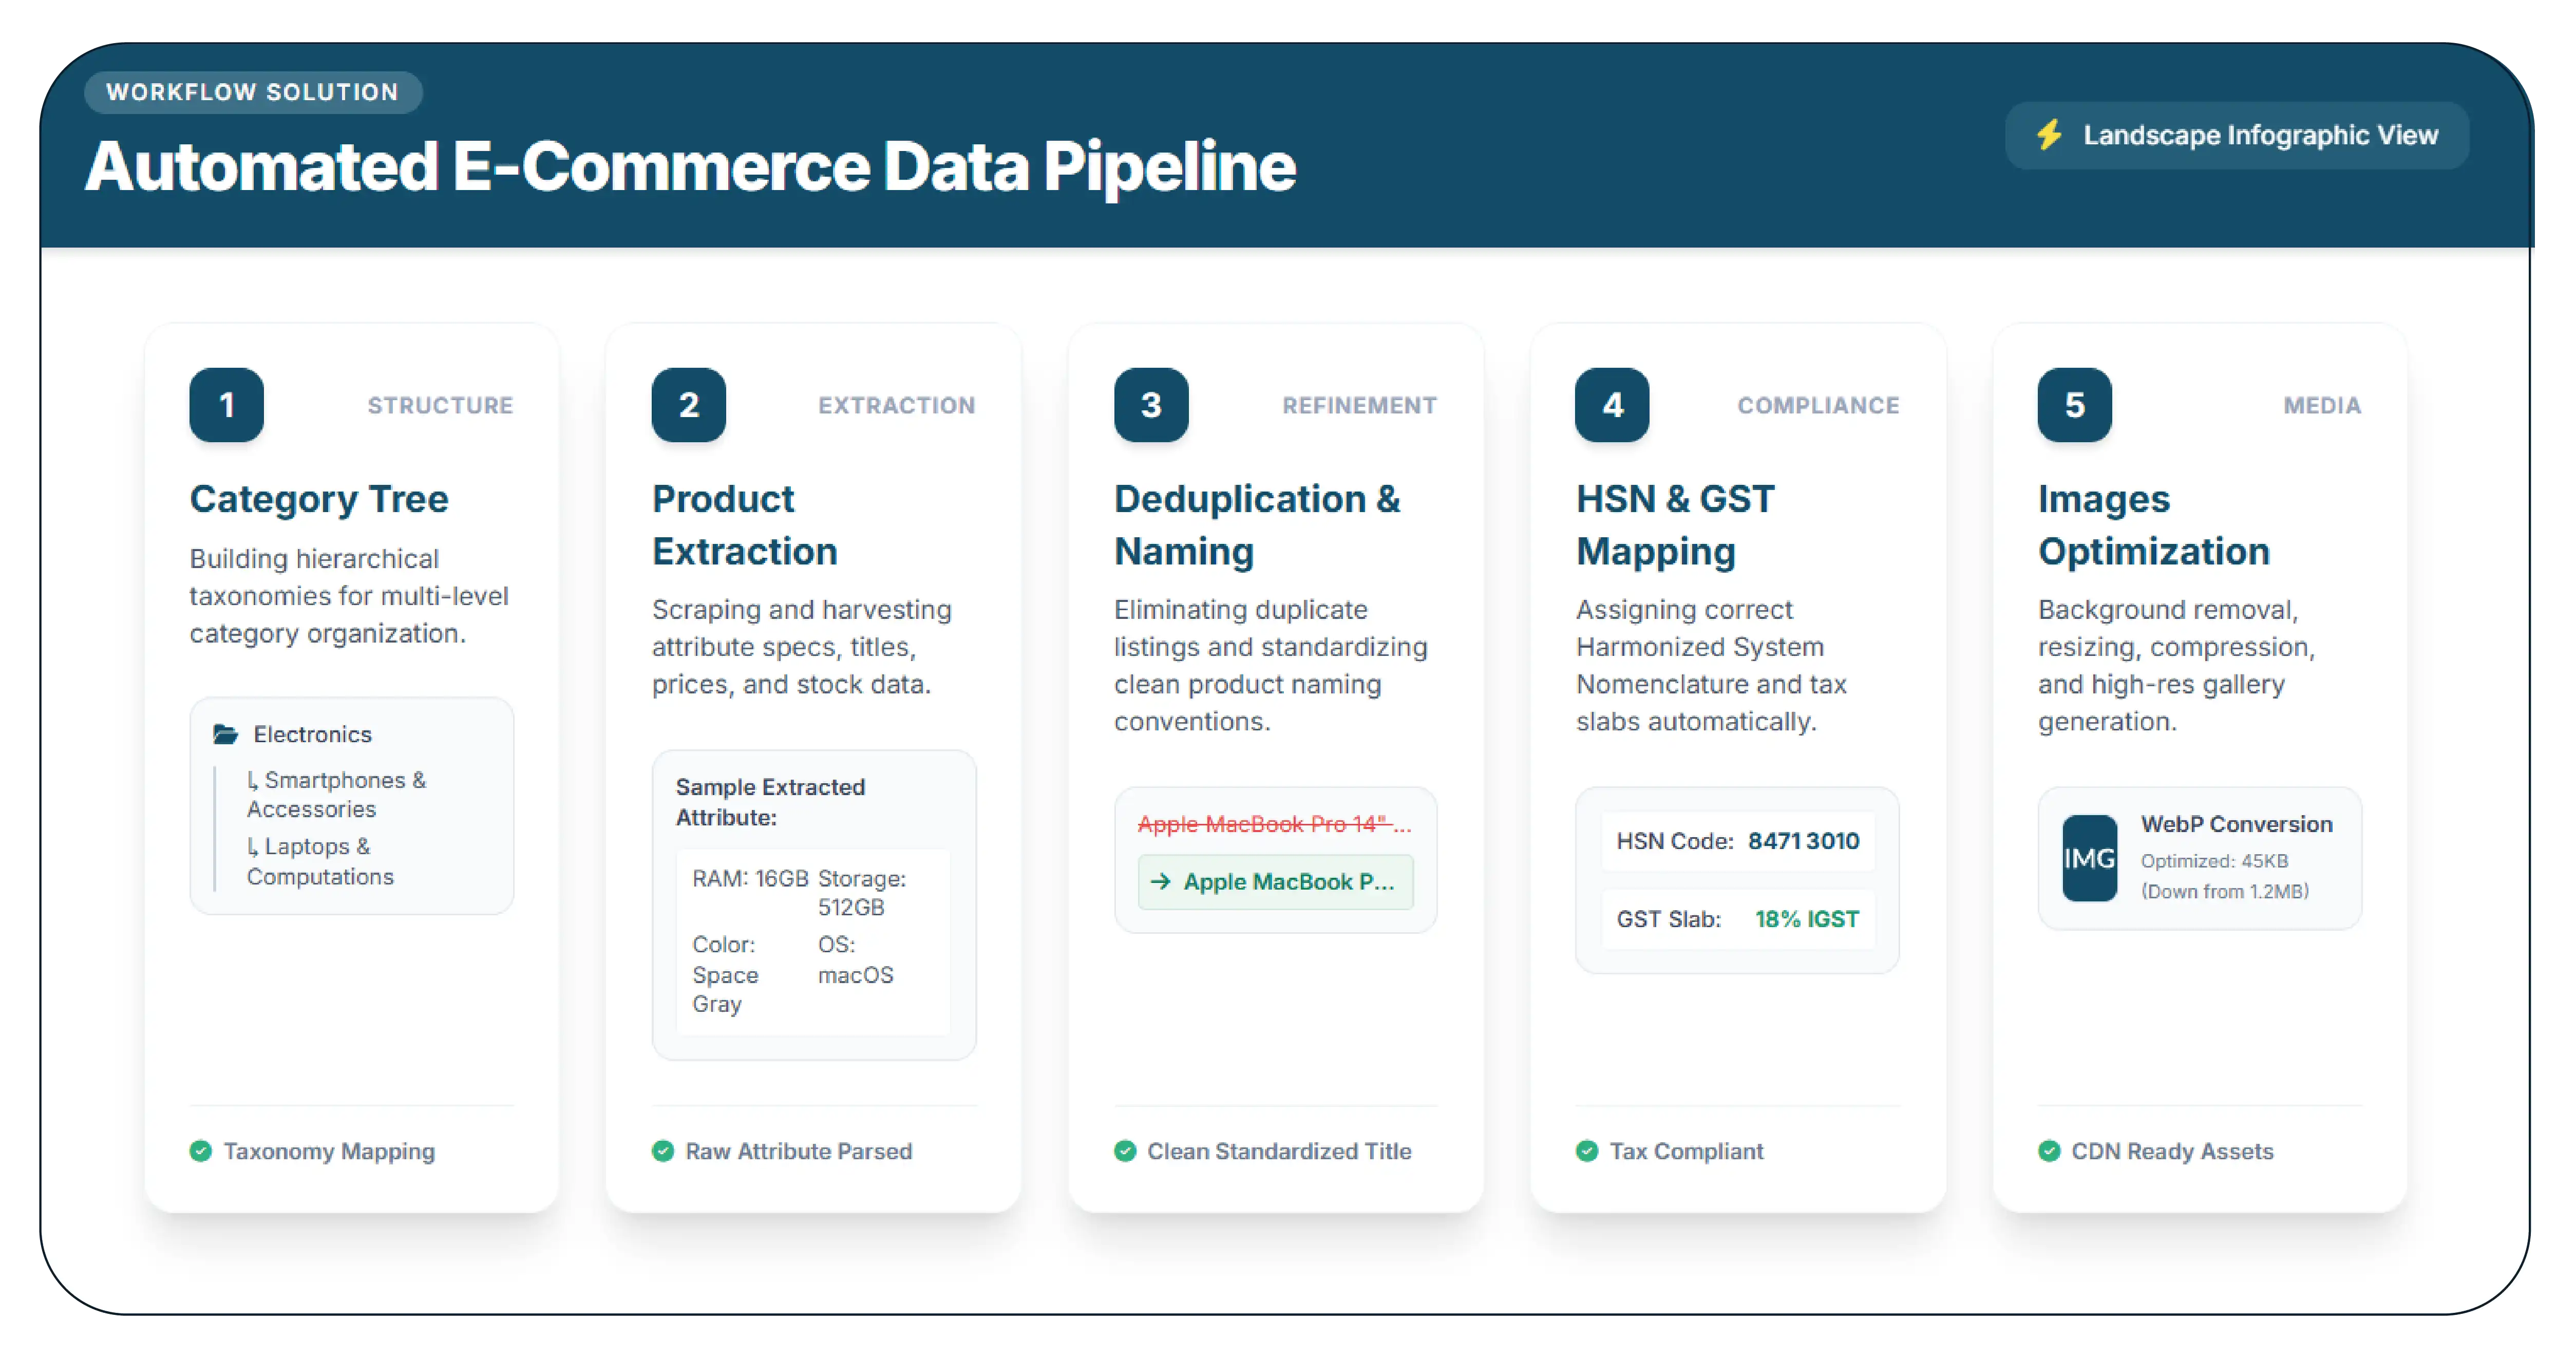
Step 1: Category tree
Product Data Scrape designed a three-level category tree for the client (for example, "Writing Instruments > Pens > Gel Pens") and mapped marketplace categories to it.
Step 2: Product extraction
Products were collected from marketplaces and brand sites with title, brand, model, pack size, colour, MRP, selling price, barcode where shown, description, key attributes and image URLs.
Step 3: Deduplication and naming
Listings for the same product were grouped by barcode or by brand, model and pack size. A clean, standard product name was created using a consistent pattern: Brand + Product type + Key attribute + Pack size, for example "Sample Brand Gel Pen Blue 0.5 mm (Pack of 10)".
Step 4: HSN and GST mapping
Each product type was mapped to an HSN code and GST rate using published tariff classifications, then reviewed by category. Where a product page showed an HSN code, it was cross-checked. The client's accountant reviewed the mapping before use.
Step 5: Images
Image URLs for each SKU were collected and organised by SKU code. The client confirmed image usage rights with its suppliers and brands before publishing images on its store.
Sample data delivered
{
  "sku": "STN-GP-000412",
  "product_name": "Sample Brand Gel Pen Blue 0.5 mm (Pack of 10)",
  "brand": "Sample Brand",
  "category_l1": "Writing Instruments",
  "category_l2": "Pens",
  "category_l3": "Gel Pens",
  "pack_size": 10,
  "colour": "Blue",
  "tip_size_mm": 0.5,
  "barcode": "8900000000000",
  "mrp_inr": 100,
  "typical_selling_price_inr": 90,
  "hsn_code": "9608",
  "gst_rate_pct": 18,
  "image_urls": ["https://www.example.com/img/gp412_1.jpg"],
  "sources": 3
}
| Category |
SKUs |
Barcode fill rate |
HSN mapped |
Images available |
| Writing instruments |
4,200 |
81% |
100% |
97% |
| Notebooks and paper |
3,600 |
74% |
100% |
95% |
| Office supplies |
3,100 |
69% |
100% |
93% |
| Art and craft |
2,800 |
66% |
100% |
92% |
| FMCG and household |
4,300 |
88% |
100% |
98% |
All figures are illustrative.
Results
| Metric |
Outcome (illustrative) |
| SKUs delivered |
18,000 |
| Time to deliver |
4 weeks |
| Duplicate listings merged |
41,000 raw listings into 18,000 SKUs |
| Manual catalogue effort saved |
About 1,500 staff hours |
The client loaded the master sheet into its billing system and online store in one week. Correct HSN codes and GST rates were in place from day one, and every product had a standard name and category.
Quality checks applied
| Check |
Rule |
| Duplicate SKUs |
No two SKUs share a barcode or the same brand + model + pack size |
| Naming pattern |
Every product name follows Brand + Type + Attribute + Pack size |
| Category completeness |
Every SKU has all three category levels |
| Price sanity |
Selling price is not above MRP; MRP within expected range for the category |
| Image check |
At least one image URL resolves for each SKU |
| HSN consistency |
All SKUs of the same product type share the same HSN mapping |
Keeping the catalogue fresh
After launch, the client subscribed to a monthly update that adds new products in its categories and refreshes MRP and selling prices. New products are flagged so the purchasing team can decide whether to stock them.
What this project is not
Product master data extraction provides product information from public sources. It is not a substitute for tax advice; HSN and GST mappings should be reviewed by the client's accountant. The HSN code and GST rate in the sample record are illustrative only, and because GST rates in India were restructured in 2025, current rates must be checked against official notifications before use. Image rights remain with brands and sites; the client confirmed usage permissions before publishing images.
Frequently asked questions
Can product master data extraction cover my exact categories?
Yes. The category tree and fields are designed around your catalogue.
Do you provide barcodes for every product?
Barcodes are included where published. Fill rates vary by category, as shown above.
Can the data be delivered in my ERP format?
Yes. Output can match your ERP, POS or marketplace template.
Build your product master
Product Data Scrape delivers product master data extraction for retailers, distributors and B2B platforms in India and beyond. Share your categories and template, and we will send a free 1,000-record sample.



 Singapore
 EMAIL
EMAIL
 PHONE
PHONE











.webp)