At a glance
| Item |
Detail |
| Client |
Early-stage e-commerce market-intelligence platform |
| Market |
Argentina first, then Mexico and Brazil |
| Platform |
Mercado Libre |
| Scope |
Listings, prices, sellers, seller reputation, sales indicators and category rankings |
| Frequency |
Daily for top categories, weekly for the long tail |
| Delivery |
Parquet files and API |
| Service |
Mercado Libre seller data scraping by Product Data Scrape |
The client
The client was building a SaaS platform for Mercado Libre sellers, "focused initially on Mercado Libre Argentina", which needed "product and market data for broad discovery." A second company building a SaaS for "mid to large Mercado Libre sellers" made a similar request in the same month. Both wanted to help sellers answer three questions: what sells, who sells it, and at what price.
The challenge
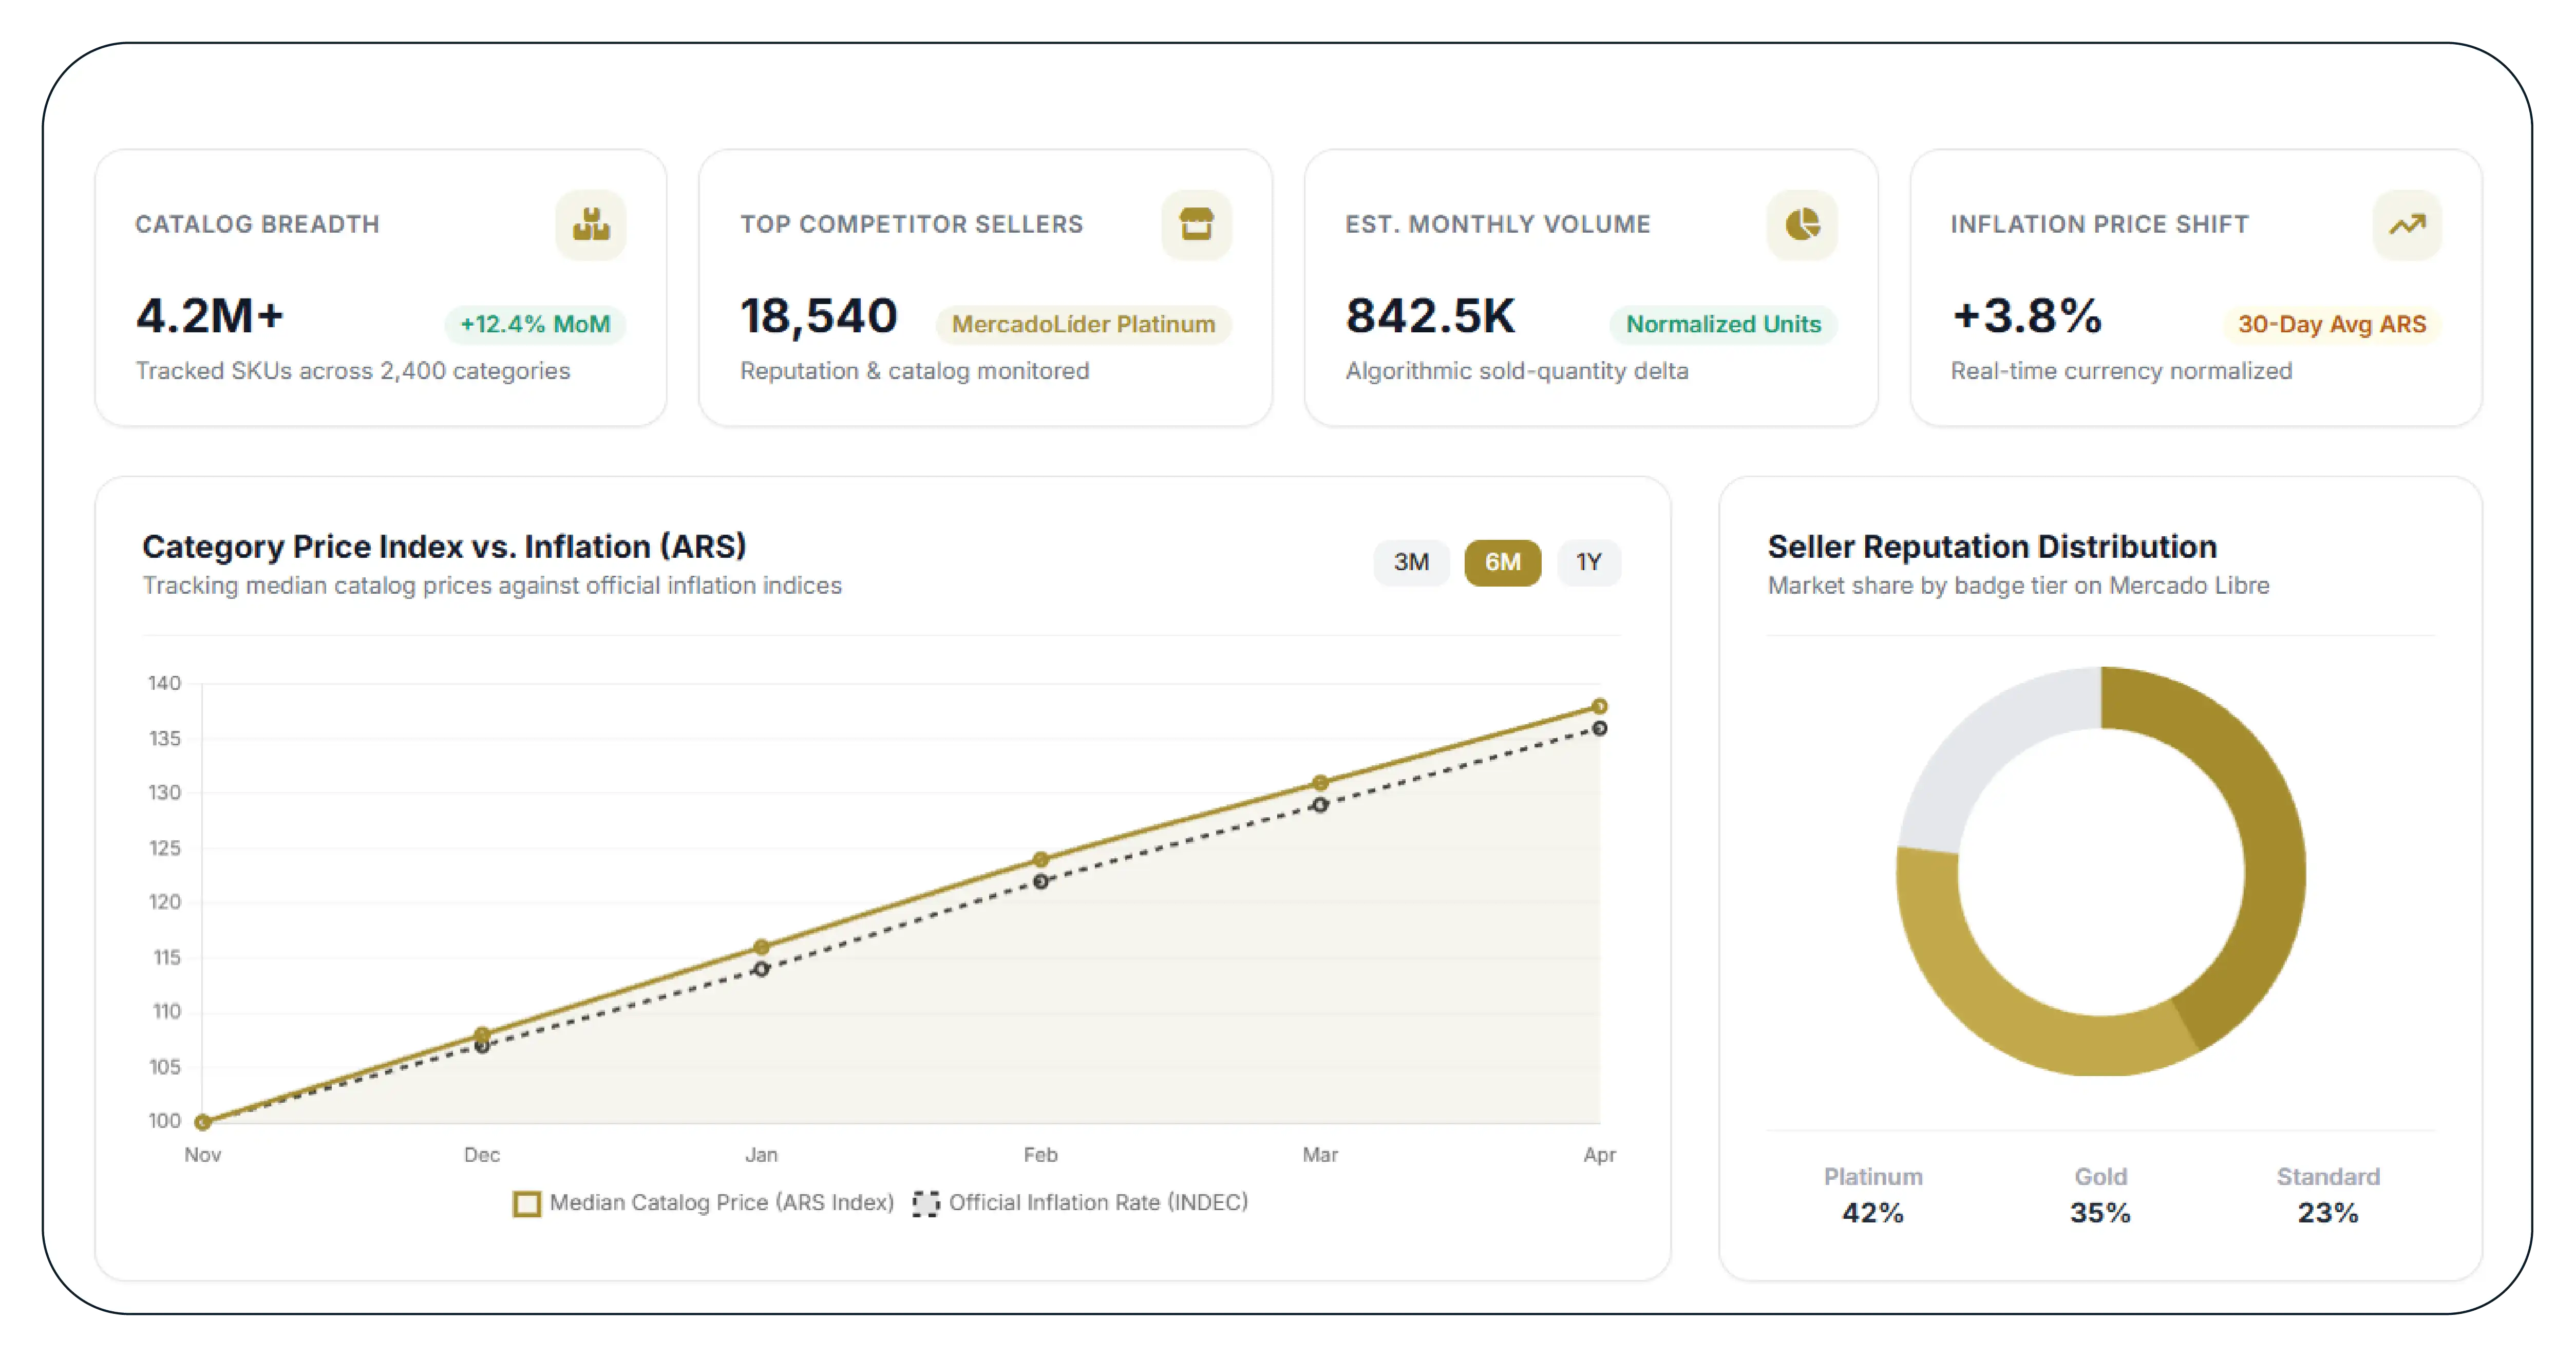
Breadth. Mercado Libre Argentina lists millions of products across thousands of categories. The client needed broad discovery, not a short SKU list.
Seller-level insight. Sellers wanted to see competitors' catalogues, prices and reputation, not just product prices.
Sales indicators. Mercado Libre shows sold-quantity indicators on many listings, but these are cumulative and often rounded.
Inflation and currency. Argentina's high inflation means prices change quickly, so comparisons over time need care.
The solution
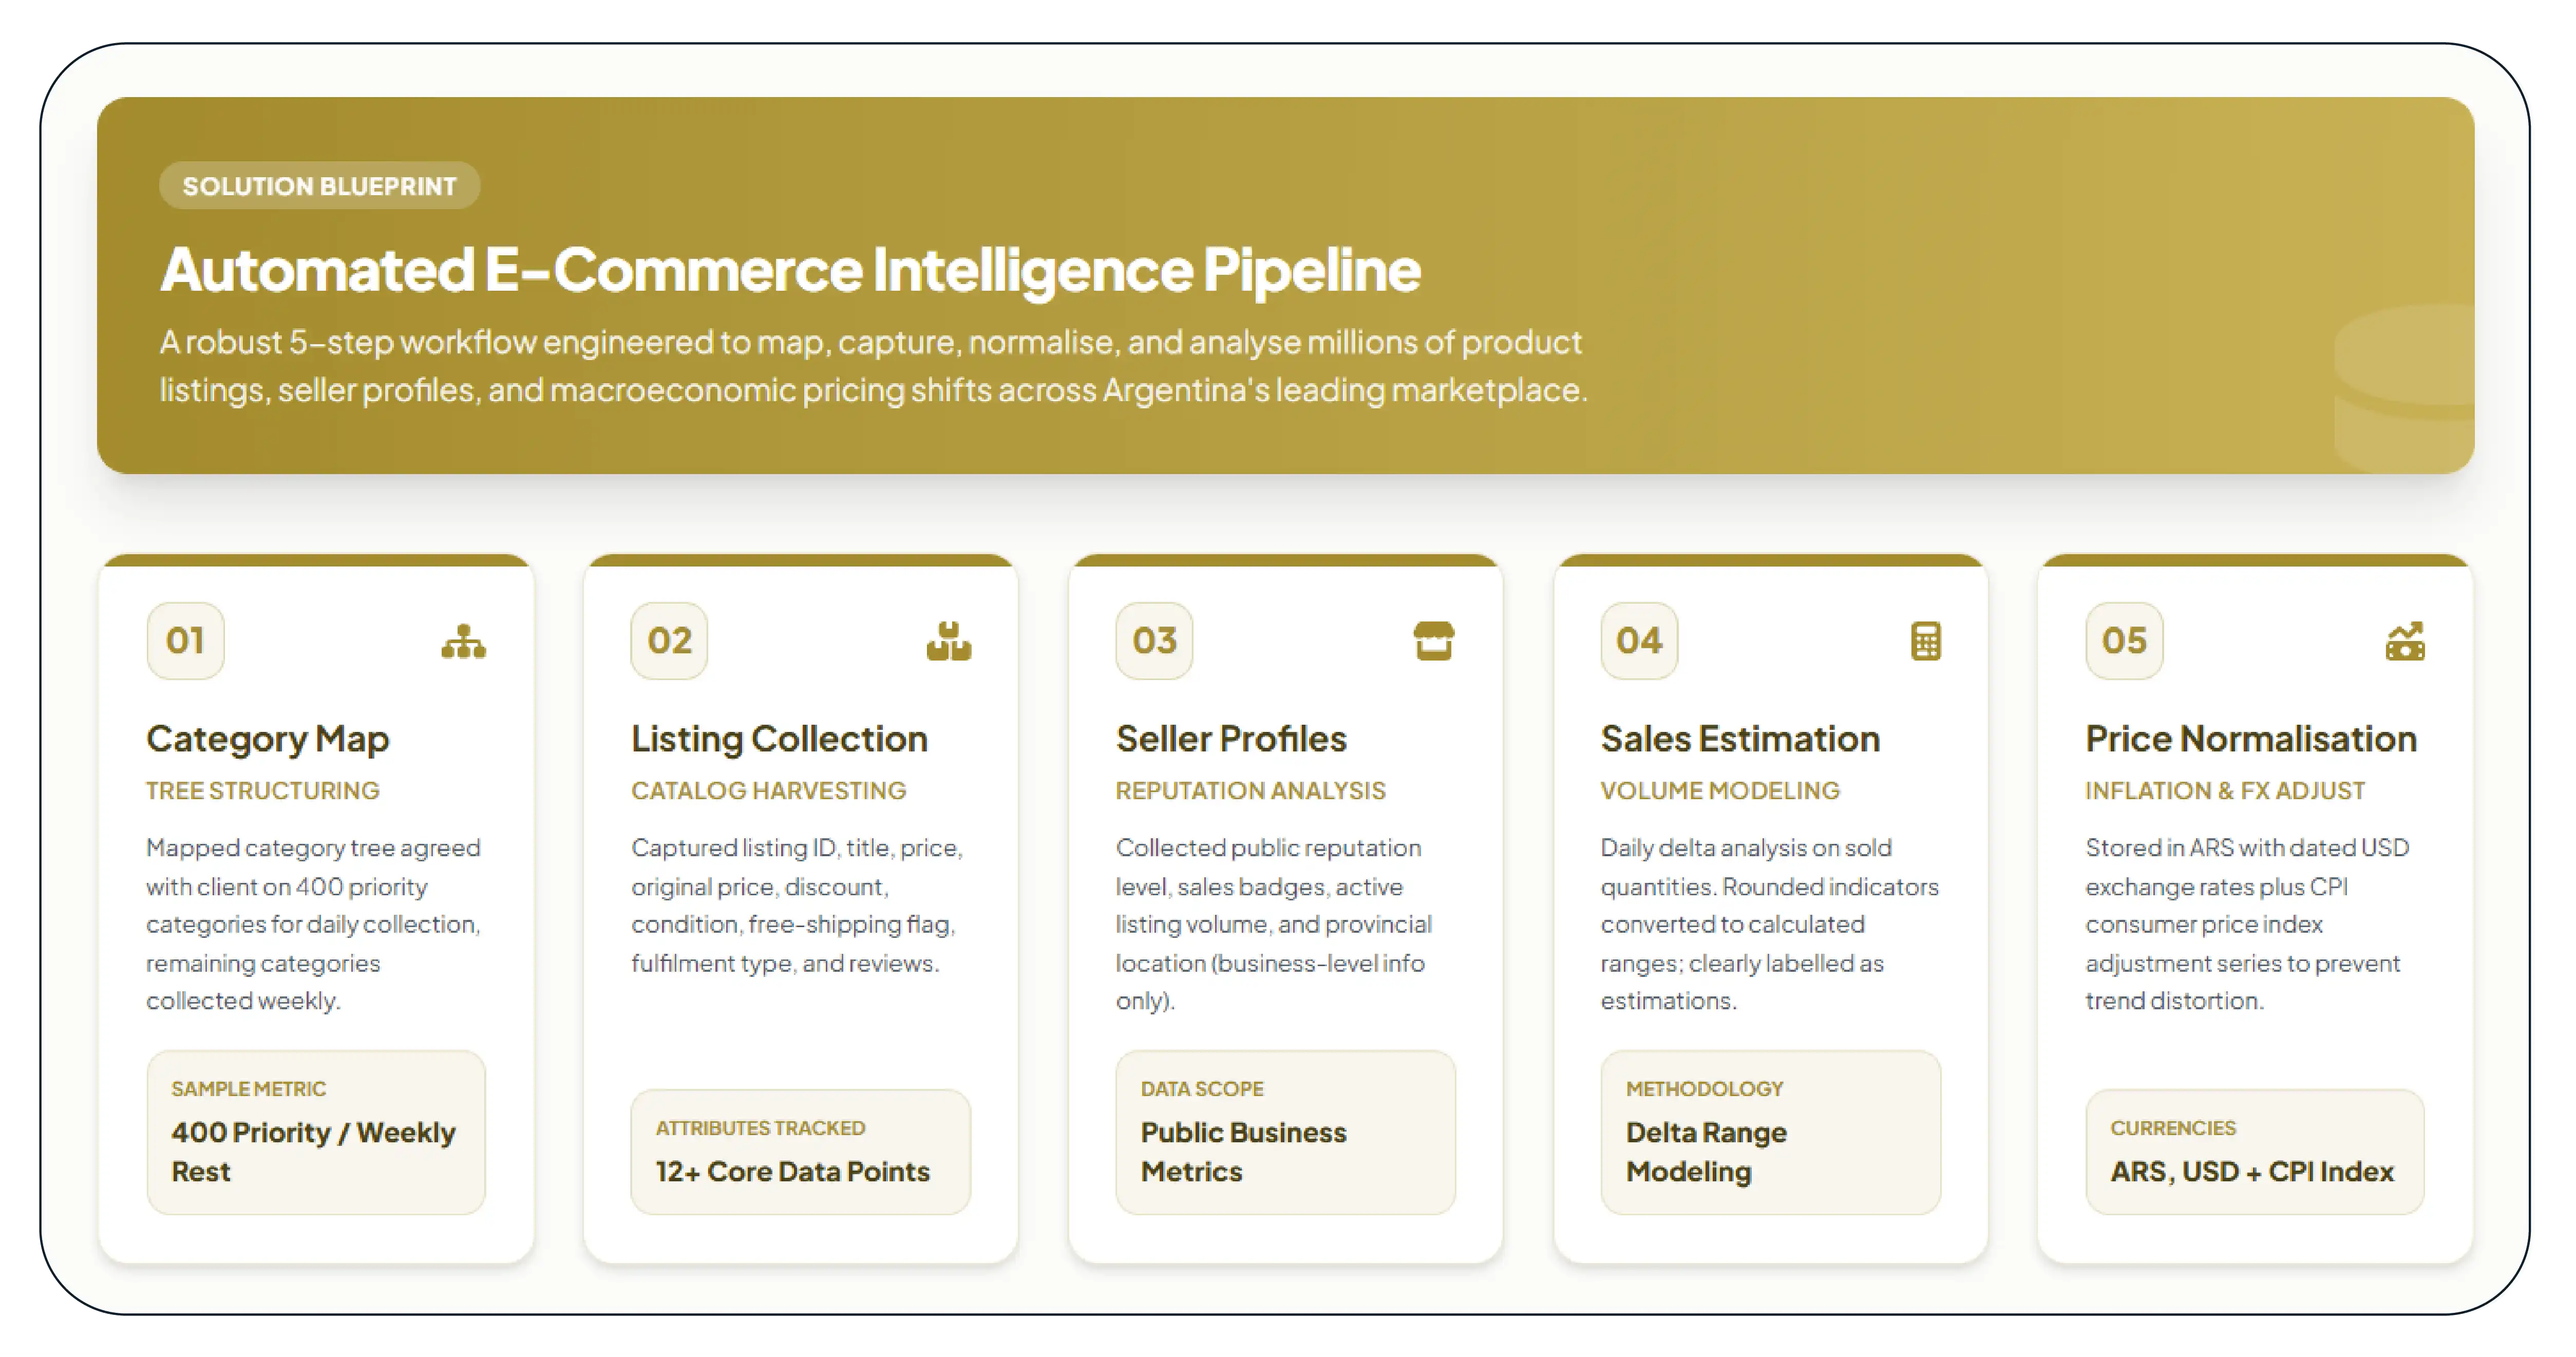
Step 1: Category map
Product Data Scrape mapped Mercado Libre Argentina's category tree and agreed with the client on 400 priority categories for daily collection, with the rest collected weekly.
Step 2: Listing collection
For each category, collectors captured listing ID, title, price, original price, discount, condition (new or used), free-shipping flag, fulfilment type, installment offers, sold-quantity indicator, rating and review count.
Step 3: Seller profiles
For each seller found, public reputation data was collected: reputation level, sales-level badge where shown, number of active listings, and location (province). Only public business-level seller information was collected.
Step 4: Sales estimation
Daily changes in the sold-quantity indicator were used to estimate units sold per listing per period. Where indicators were rounded, a range was calculated. Estimates were labelled clearly as estimates.
Step 5: Price normalisation
Prices were stored in Argentine pesos with a dated exchange rate to US dollars, and an inflation-adjusted series was calculated using the monthly consumer price index, so trends were not distorted by inflation.
Sample data delivered
{
  "site": "MLA",
  "listing_id": "MLA0000000000",
  "category": "Celulares y Smartphones",
  "title": "Smartphone Example X 128GB",
  "price_ars": 489999,
  "original_price_ars": 559999,
  "price_usd_ref": 412.60,
  "condition": "new",
  "free_shipping": true,
  "fulfilment": "full",
  "installments": "6 cuotas sin interés",
  "sold_indicator": "+500 vendidos",
  "est_units_sold_7d": "35-45",
  "seller_name": "EXAMPLE TECH",
  "seller_reputation": "green",
  "seller_badge": "MercadoLíder Platinum",
  "seller_province": "Buenos Aires",
  "rating": 4.7,
  "reviews": 318,
  "collected_at": "2026-10-05"
}
| Category (Illustrative) |
Active Sellers |
Top 10 Sellers' Share of Estimated Units |
Median Price Change (30 Days, Inflation-Adjusted) |
| Smartphones |
2,140 |
46% |
-2.1% |
| Running Shoes |
1,380 |
31% |
+0.8% |
| Kitchen Appliances |
3,050 |
27% |
-0.5% |
| Kids' Footwear |
960 |
38% |
+1.4% |
Results
| Metric |
Value |
| Listings Collected per Day |
1.8 million |
| Sellers Profiled |
210,000 |
| Categories with Daily Seller Rankings |
400 |
| Time to Launch First Dashboard |
7 weeks |
The client launched three modules: a category explorer showing estimated demand and competition, a seller tracker that lets users follow competitors' catalogues and prices, and a price-position tool showing where a seller's price sits in the category. After Argentina, the same pipeline was extended to Mexico and Brazil.
What sellers see in the platform
| Module |
Built From |
Example Question Answered |
| Category Explorer |
Listings, estimated units, seller counts |
Is this category growing, and how crowded is it? |
| Seller Tracker |
Seller catalogues, prices, reputation |
What did my top competitor change this week? |
| Price Position |
Price distribution per product type |
Am I priced in the top, middle or bottom of the market? |
| Opportunity Finder |
Demand estimates vs seller count |
Which products have high demand and few strong sellers? |
| Fulfilment View |
Full vs non-full listings |
Do fulfilment-backed listings win more sales here? |
Lessons learned
Seller data is the differentiator. Users valued competitor seller tracking more than product prices alone.
Estimates need ranges. Rounded sold indicators mean point estimates can mislead; ranges are more honest.
Inflation adjustment is essential in Argentina. Without it, every price looks like it is rising.
Start with priority categories. Daily collection on 400 categories and weekly on the rest kept costs manageable.
How this differs from market-entry research
Market-entry studies, such as assessing whether a footwear brand should launch on Mercado Libre, usually need a one-time snapshot of prices and competitors. A SaaS product needs continuous daily data, history and seller-level detail. Product Data Scrape supports both, but the pipeline design is different.
Frequently asked questions
Does Mercado Libre seller data scraping include seller contact details?
No. Only public business information such as seller name, reputation and listing data is collected.
Can it cover other Mercado Libre countries?
Yes. Mexico, Brazil, Chile, Colombia and other Mercado Libre sites can be added.
Are units sold exact?
No. Sold indicators are converted into estimated ranges and labelled as estimates.
Build on Mercado Libre data
Product Data Scrape delivers Mercado Libre seller data scraping, category rankings and price feeds for SaaS builders, sellers and brands across Latin America. Request a free 1,000-record sample for your categories.



 Singapore
 EMAIL
EMAIL
 PHONE
PHONE













.webp)