Introduction
Product Sentiment Analysis helps brands convert large volumes of customer opinions into structured signals about satisfaction, complaints, product quality, and buying preferences. Scraping Blinkit Reviews & Ratings Data can support this process by organizing publicly available review and rating information into datasets that can be analyzed by product, category, location, rating, theme, and time period.
The opportunity is significant because Blinkit has expanded rapidly. Its FY25 results reported 424 million orders, 10.2 million average monthly transacting customers, 1,301 stores, and presence in more than 100 cities. By September 2026, Eternal reported more than 2,700 Blinkit stores across 400+ cities. BSE India
For FMCG brands, retailers, consumer-electronics companies, beauty businesses, and market-research teams, review intelligence can reveal issues that sales numbers alone cannot explain. A high-selling product may still attract complaints about packaging, freshness, quality, availability, or value. Conversely, consistently positive feedback can identify product attributes worth emphasizing in marketing.
The important distinction is that review scraping should not simply count stars. Effective analysis connects rating values with review text, product attributes, timestamps, categories, and geography. This enables buyers to identify recurring themes and prioritize measurable actions.
India's quick-commerce market is also becoming more commercially important. IBEF reports that Indians spent about ₹64,000 crore on quick-commerce platforms in FY25, more than double FY24's ₹30,000 crore. India Brand Equity Foundation
How Are Blinkit Review Trends Changing Customer Intelligence?
Blinkit Review Trends and Product Sentiment Tracking can help brands monitor how customer perception changes over time. Instead of treating a four-star or five-star score as the complete story, analysts can connect ratings with review themes such as product quality, delivery, packaging, availability, pricing, and customer service.
A related dataset can incorporate Blinkit Keyword and Dark Store Search Rank Data where such information is lawfully and reliably available. This creates a broader view of product visibility: what consumers are discussing, which products are appearing prominently, and whether customer perception is improving or deteriorating.
Blinkit's scale makes longitudinal monitoring particularly relevant. Its reported store count increased from 377 in March 2023 to 526 in March 2024, while average monthly transacting customers rose from 2.9 million to 5.1 million. BSE India
| Year | Verified Blinkit / market milestone | Why it matters for review intelligence |
|---|
| 2020 | Online grocery purchases increased 80% to about ₹23,951 crore, according to an IIM Ahmedabad study cited by IBEF | Establishes the acceleration of online grocery adoption |
| 2021 | No comparable Blinkit review metric identified in the cited sources | Avoids unsupported historical estimates |
| 2022 | Blinkit acquisition by Zomato completed in August | Marks the beginning of Blinkit's consolidation within Zomato/Eternal |
| 2023 | 377 stores; 2.9M average monthly transacting customers | Larger operating footprint creates more customer touchpoints |
| 2024 | 526 stores; 5.1M average monthly transacting customers | Expanding scale increases the value of systematic feedback analysis |
| 2025 | 1,301 stores; 10.2M average monthly transacting customers | Review monitoring becomes relevant across a much wider network |
| 2026 | 2,700+ stores across 400+ cities reported by Eternal | Geographic and category-level monitoring becomes increasingly important |
Sources: IBEF and Eternal/Zomato corporate disclosures. India Brand Equity Foundation
For brands, the practical workflow is straightforward: collect permitted public review information, normalize product names, remove duplicates, classify review themes, calculate rating distributions, and monitor changes by period. Sentiment should then be interpreted alongside actual review text rather than used as a standalone score.
This approach is particularly useful for identifying products where ratings remain stable but the underlying complaint mix changes. A brand could therefore detect emerging quality or packaging concerns before they become obvious through broader market-performance indicators.
How Can Brands Turn Blinkit Feedback Into Actionable Intelligence?
Blinkit Product Feedback Intelligence for Brands becomes more useful when review signals are organized by product, category, geography, and time. Brands selling across multiple cities can investigate whether customer complaints are widespread or concentrated around particular markets.
This is where Blinkit Multi-Location Data Scraping can support structured analysis when information is publicly accessible and collection complies with applicable terms and laws. Location-level datasets can help businesses compare product visibility, availability signals, ratings, and review themes across service areas.
Blinkit's operating model makes geography especially relevant. Corporate disclosures describe dark stores generally operating within a 2–3 km radius of customers, allowing localized fulfilment. BSE India
| Year | Verified operational indicator | Intelligence implication |
|---|
| 2020 | Online grocery purchases rose 80% | Consumer adoption accelerated |
| 2021 | No verified comparable Blinkit location dataset found | Data should not be estimated |
| 2022 | Blinkit acquisition completed by Zomato | Platform structure changed |
| 2023 | 19 cities and 377 stores in March | Initial disclosed network baseline |
| 2024 | 26 cities and 526 stores in March | Wider location coverage |
| 2025 | 100+ cities and 1,301 stores in March | Substantially broader geographic footprint |
| 2026 | 400+ cities and 2,700+ stores reported by Eternal | Large-scale geographic monitoring opportunity |
Sources: IBEF and Eternal/Zomato disclosures. India Brand Equity Foundation
For a consumer brand, the value comes from asking better questions. Are negative comments concentrated in a specific market? Does the same SKU receive different feedback across locations? Are complaints associated with freshness, handling, packaging, or availability? Are positive comments consistently linked to convenience or product quality?
Location-aware analysis should also avoid overinterpreting small samples. A handful of reviews from one locality cannot establish a city-wide trend. Robust dashboards should therefore display review counts alongside sentiment percentages and rating distributions.
Brands can combine these indicators with inventory, pricing, and competitor observations to build a more complete view of marketplace performance.
How Can Reviews Reveal Product Performance Problems?
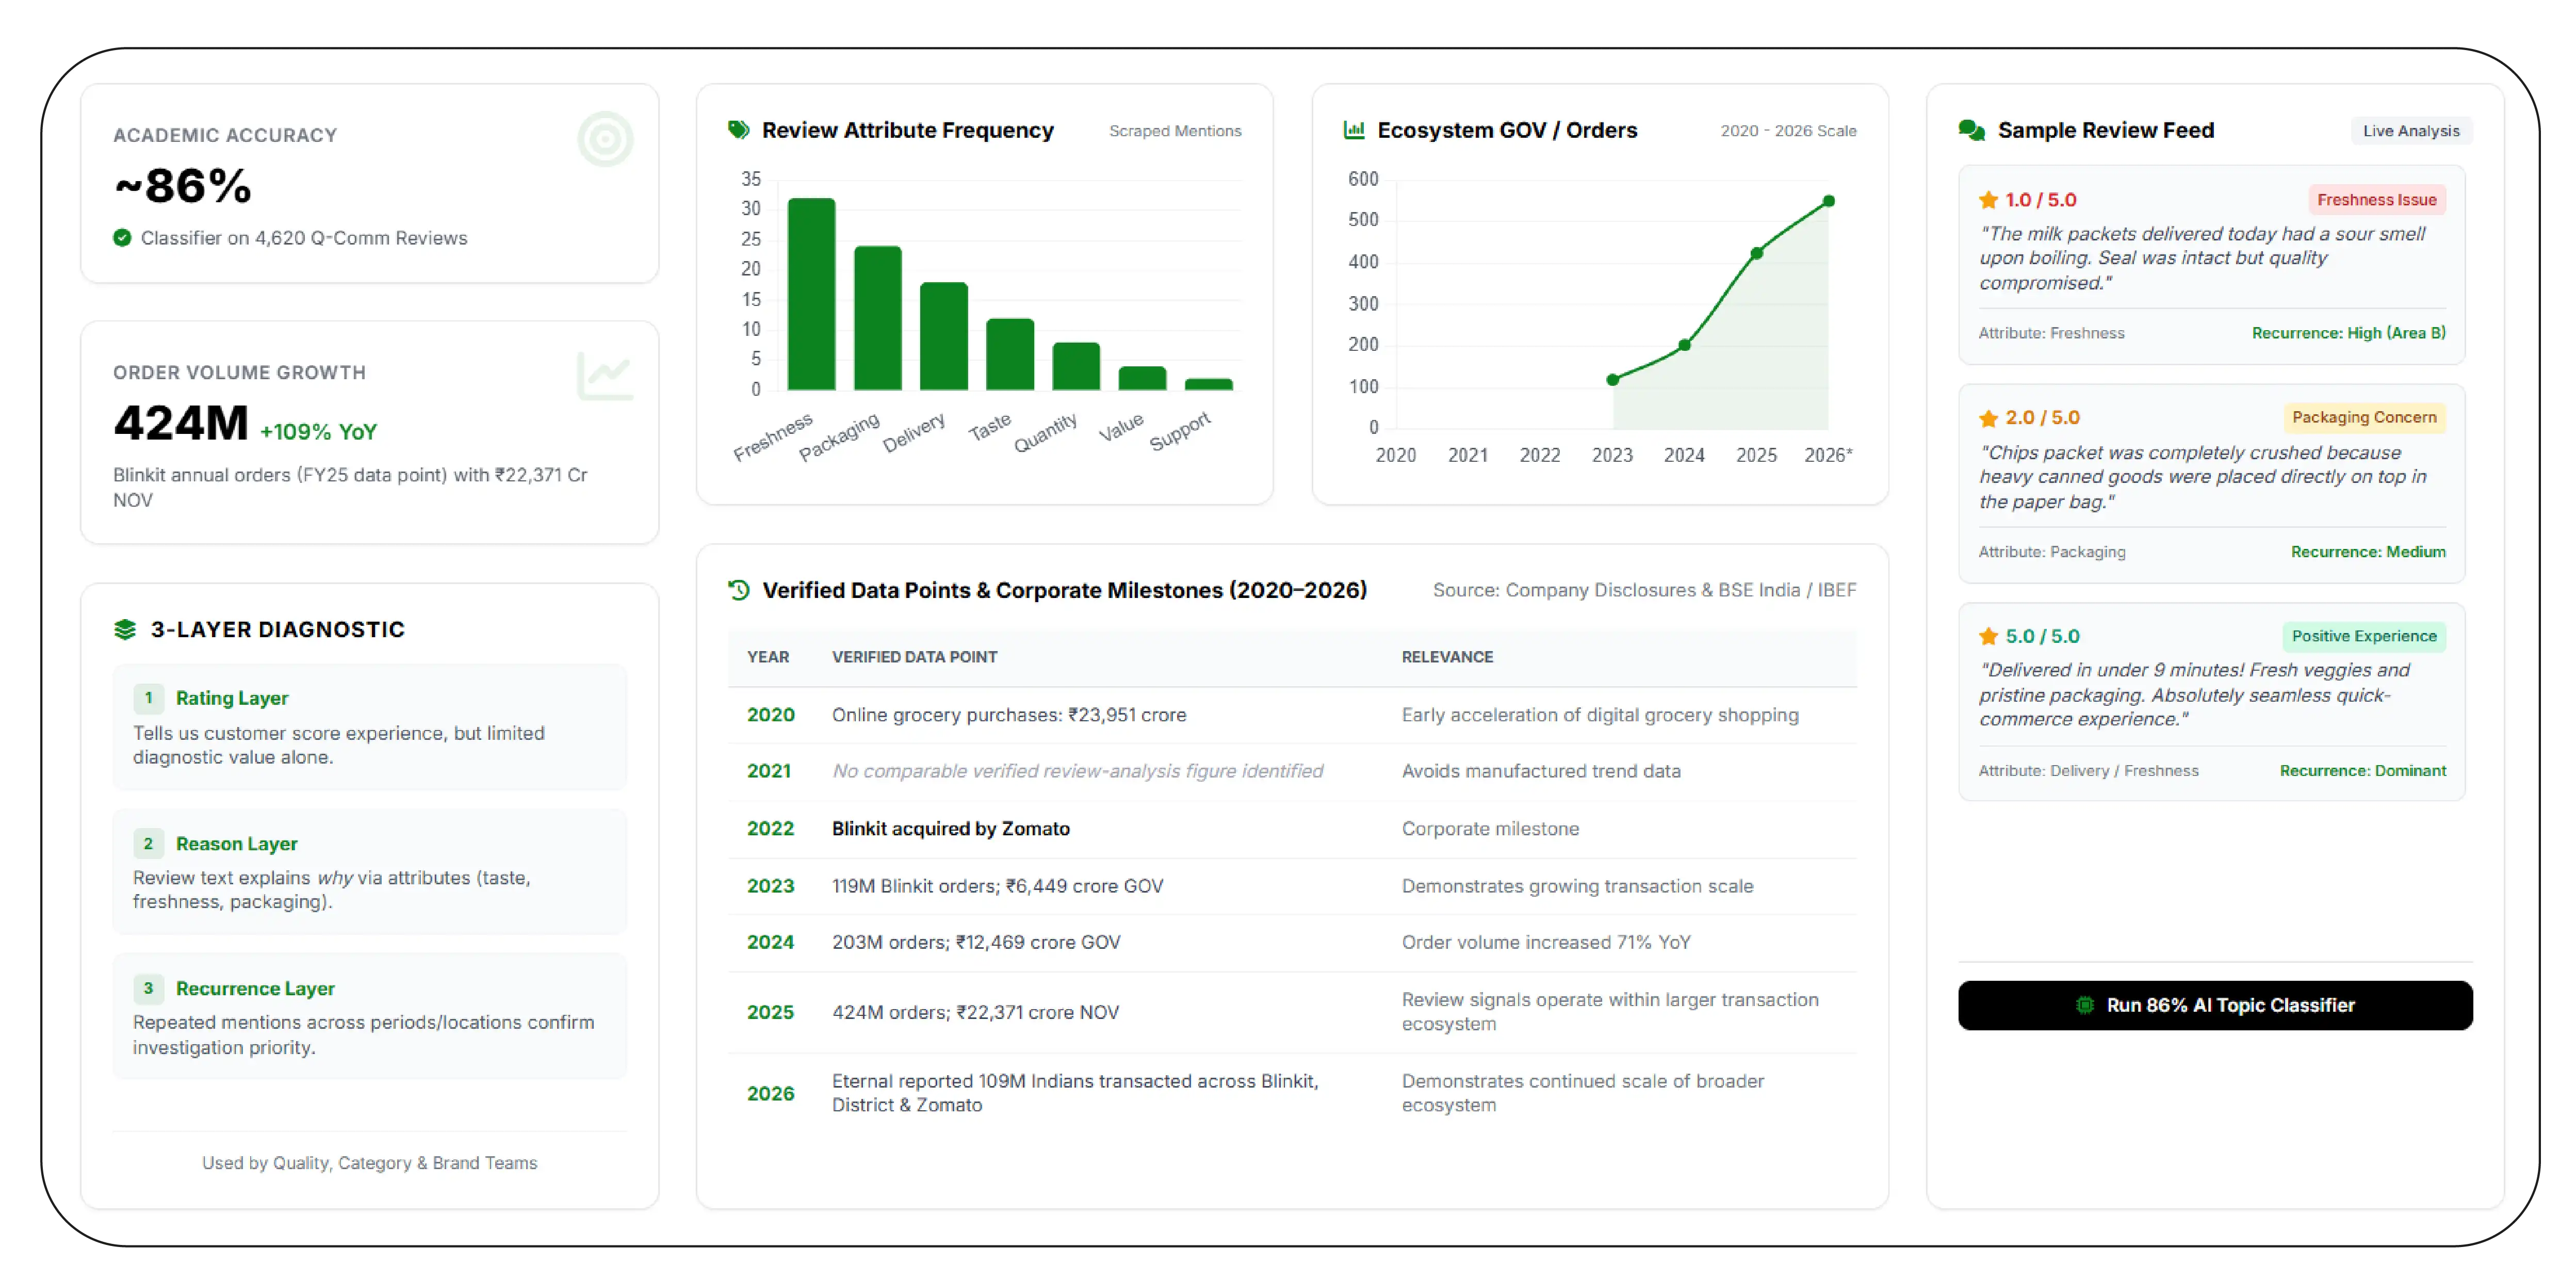
Blinkit Review Insights for Product Performance can move analysis beyond simple star averages. A rating tells a business how customers scored an experience, while review text can explain why.
Scraping Blinkit Reviews & Ratings Data can therefore be structured around identifiable attributes such as taste, freshness, packaging, quantity, authenticity, product condition, value, delivery, replacement, or customer support—provided those attributes are actually present in the collected data.
Independent research demonstrates the usefulness of this methodology. A 2025 academic study analyzed 4,620 user reviews from quick-commerce platforms including Blinkit, Zepto, and JioMart. Its classifier achieved approximately 86% accuracy, while topic modeling identified themes including operational issues, customer service, positive experiences, delivery delays, and payment/wallet concerns. micsymposium.org
| Year | Verified data point | Relevance |
|---|
| 2020 | Online grocery purchases: ₹23,951 crore | Early acceleration of digital grocery shopping |
| 2021 | No comparable verified review-analysis figure identified | Avoids manufactured trend data |
| 2022 | Blinkit acquired by Zomato | Corporate milestone |
| 2023 | 119M Blinkit orders; ₹6,449 crore GOV | Demonstrates growing transaction scale |
| 2024 | 203M orders; ₹12,469 crore GOV | Order volume increased 71% YoY |
| 2025 | 424M orders; ₹22,371 crore NOV | Review signals operate within a much larger transaction ecosystem |
| 2026 | Eternal reported 109M Indians transacted across Blinkit, District and Zomato during FY26 | Demonstrates continued scale of the broader ecosystem |
The FY23–FY25 figures come from company disclosures, while the 2020 figure is reported by IBEF from IIM Ahmedabad research. BSE India
For product teams, the actionable step is to combine three layers: rating, reason, and recurrence. A low rating with no explanation provides limited diagnostic value. Repeated mentions of a specific issue provide a stronger signal. Repeated mentions across different periods or locations strengthen the case for investigation.
This makes review intelligence useful for quality teams, category managers, brand managers, and marketplace teams seeking evidence-based product improvements.
What Makes Review Text Useful for Sentiment Analysis?
Blinkit Product Review Data for Sentiment Analysis can be processed through natural-language techniques to classify customer comments into positive, neutral, and negative categories. More advanced workflows can combine sentiment with topic classification, entity extraction, keyword frequency, and time-series analysis.
The objective should not be to generate a single "sentiment score" and treat it as absolute truth. Sarcasm, mixed opinions, short comments, spelling variations, multilingual text, and context can reduce classification quality. Human review of model outputs remains valuable for important decisions.
| Year | Verified context | Application to sentiment workflows |
|---|
| 2020 | Online grocery adoption accelerated during the pandemic | Larger digital feedback environment began developing |
| 2021 | No comparable verified Blinkit sentiment dataset located | No estimate used |
| 2022 | Blinkit acquisition completed | Platform entered Zomato's consolidated reporting |
| 2023 | 119M orders | Increasing transaction volume supports structured feedback monitoring |
| 2024 | 203M orders | Larger customer base provides more potential feedback signals |
| 2025 | 424M orders | Sentiment analysis can support increasingly granular monitoring |
| 2026 | 2,700+ stores and 400+ cities reported | Geographic segmentation becomes increasingly important |
Sources: Eternal/Zomato and IBEF. BSE India
A strong sentiment pipeline starts with data quality. Reviews should be deduplicated, timestamps normalized, product identifiers standardized, and irrelevant text removed. Language detection may be necessary when reviews contain English, Hindi, Hinglish, or other Indian-language expressions.
The second layer is classification. A model can assign sentiment, but businesses should also identify the topic driving that sentiment. "Negative" is less actionable than "negative because packaging was damaged" or "negative because the delivered product differed from expectations."
The third layer is monitoring. Analysts can compare sentiment by week or month, product category, SKU, location, or rating band. Sudden changes can trigger deeper investigation.
For buyers, this turns raw review collection into an operational feedback system rather than another static dataset.
How Can Ratings and Reviews Be Organized Into a Business Dataset?
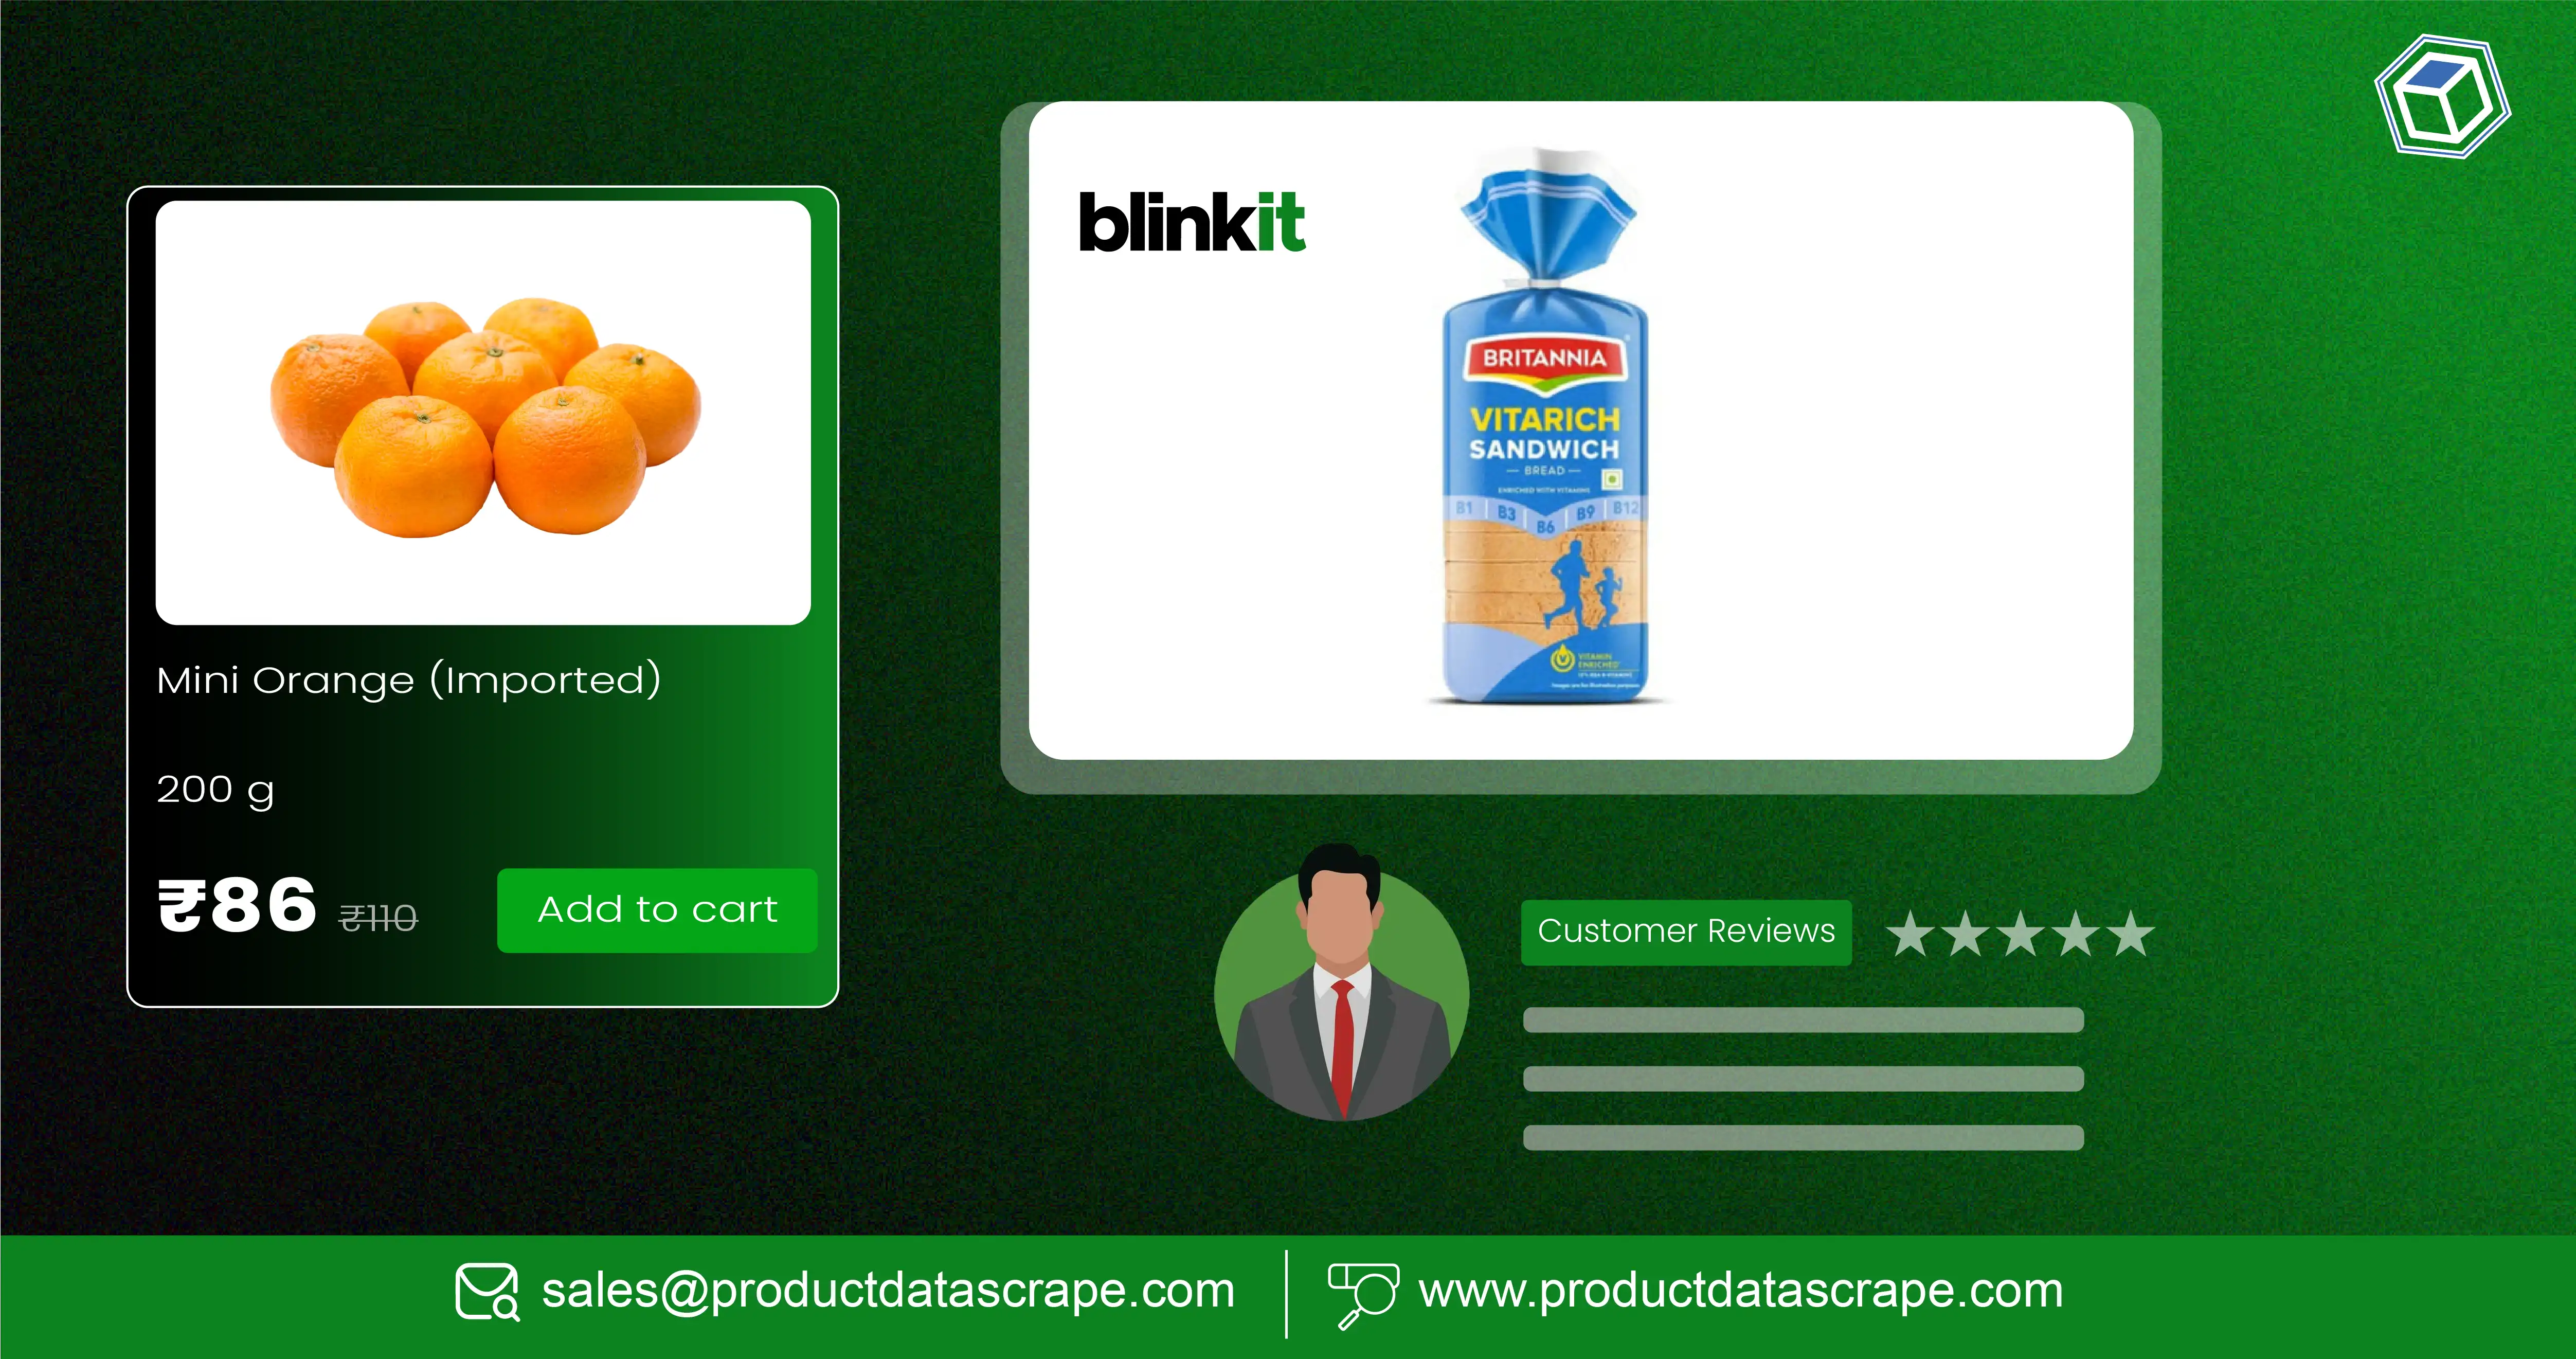
A Blinkit Customer Ratings and Reviews Dataset should be designed around the questions a business needs to answer. Typical fields can include product name, category, rating, review text, review date, location where legitimately available, sentiment classification, topic, source, and collection timestamp.
Scraping Blinkit Reviews & Ratings Data can provide the raw material for such a dataset, but data governance is equally important. Collection should respect applicable laws, platform terms, robots directives where relevant, and privacy requirements. Personally identifiable information should not be unnecessarily collected or retained.
| Year | Verified Blinkit scale | Dataset-design consideration |
|---|
| 2020 | ₹23,951 crore online grocery purchases cited by IBEF | Establish historical market context |
| 2021 | No verified Blinkit review dataset located | Do not backfill unsupported numbers |
| 2022 | Acquisition completed August 10 | Preserve corporate-period context |
| 2023 | 377 stores; 19 cities | Location dimension becomes relevant |
| 2024 | 526 stores; 26 cities | Increased geographic coverage |
| 2025 | 1,301 stores; 100+ cities | Greater need for standardized identifiers |
| 2026 | 2,700+ stores; 400+ cities | Large-scale location and category segmentation |
Sources: IBEF and Eternal/Zomato. India Brand Equity Foundation
Data normalization is critical because the same product may appear with variations in capitalization, pack size, brand spelling, or category classification. Without normalization, a business can mistakenly treat one SKU as multiple products.
Quality checks should include duplicate detection, missing-value monitoring, invalid ratings, inconsistent dates, and unusual review-volume changes. Every record should also retain source and collection metadata so analysts can distinguish historical observations from newly collected information.
For organizations operating across several product categories, the dataset can become a reusable analytical layer. Product teams can use it for quality monitoring, marketing teams can identify customer language, category managers can identify recurring issues, and research teams can compare consumer preferences.
The goal is not simply to accumulate millions of rows. It is to produce a clean, traceable dataset that supports decisions.
How Can Brands Measure Rating Changes Over Time?
Blinkit Product Rating Trend Analysis helps businesses understand whether customer perception is stable, improving, or declining. The most useful approach combines average rating with rating distribution, review volume, sentiment, and recurring themes.
A simple average can conceal important changes. For example, two products can have identical average ratings while one receives mostly four-star ratings and another has a mixture of one-star and five-star reviews. Those distributions imply different customer experiences.
| Year | Verified scale indicator | What analysts can monitor |
|---|
| 2020 | Online grocery purchases grew 80% | Growth in digital shopping behaviour |
| 2021 | No comparable verified Blinkit metric | Avoid unsupported historical assumptions |
| 2022 | Blinkit acquisition by Zomato | Corporate and reporting transition |
| 2023 | 119M orders | Baseline for transaction scale |
| 2024 | 203M orders | 71% YoY order growth |
| 2025 | 424M orders | 108% YoY order growth |
| 2026 | 2,700+ stores and 400+ cities reported | Expanded scope for geographic monitoring |
Sources: IBEF and Eternal/Zomato corporate disclosures. India Brand Equity Foundation
A useful dashboard should therefore track at least five indicators: average rating, rating distribution, review volume, sentiment mix, and dominant complaint themes. Businesses can add product availability, price, promotion, and category information where independently verified.
Trend analysis also requires sufficient sample size. A one-day change based on a few reviews should not automatically be interpreted as a product-quality shift. Longer observation periods provide stronger evidence.
For consumer brands, this framework can identify products requiring investigation, products with consistently strong customer approval, and areas where operational improvements may improve marketplace perception.
Why Choose Product Data Scrape?
For businesses that need structured marketplace intelligence, Product Data Scrape can support workflows designed around product, review, rating, pricing, and availability information. Review datasets can be normalized, categorized, and prepared for downstream analytics rather than delivered as unstructured raw records.
The emphasis should be on data quality, repeatable collection, field consistency, validation, and delivery formats that fit existing analytics environments. For brands, this can reduce the manual effort involved in monitoring large marketplace datasets and make customer feedback easier to connect with commercial decisions.
A strong data workflow also separates verified observations from assumptions. That distinction is essential when review intelligence is used by product, category, research, or executive teams.
Conclusion
Customer reviews are valuable because they explain the experience behind marketplace transactions. As India's quick-commerce sector expands, brands have more reason to monitor product perception, recurring complaints, ratings, and customer language systematically. IBEF reports that quick-commerce spending reached ₹64,000 crore in FY25, while Eternal reports Blinkit's network at more than 2,700 stores across 400+ cities in September 2026.
By combining Ratings, reviews and sentiment analysis, businesses can identify customer satisfaction patterns, understand recurring product concerns, and evaluate changing consumer preferences. Blinkit data scraping further helps brands organize relevant marketplace information into structured datasets for product performance monitoring, competitive research, and data-driven decision-making.
Q-Commerce data scraping can help businesses build broader datasets covering products, availability, prices, ratings, and customer feedback. Combined with structured sentiment and topic analysis, these datasets can support faster identification of customer concerns and changing preferences.
For organizations seeking scalable marketplace intelligence, Product Data Scrape can help turn publicly available, lawfully collected data into decision-ready datasets.
Talk to Product Data Scrape today to explore a compliant, scalable solution for Scraping Blinkit Reviews & Ratings Data and building actionable Q-commerce intelligence!
FAQs
1. What is Blinkit review data used for?
Blinkit review data helps brands analyze customer opinions, product ratings, recurring complaints, satisfaction signals, and product-specific feedback for research and decision-making.
2. How does sentiment analysis improve review monitoring?
Sentiment analysis categorizes customer opinions into positive, neutral, or negative signals and can reveal recurring themes that simple star ratings may not explain.
3. What fields can a review dataset contain?
Depending on availability and lawful collection, datasets can contain product information, ratings, review text, dates, categories, sentiment labels, topics, source details, and collection timestamps.
4. Can brands compare review sentiment across locations?
Yes. When reliable location information is lawfully available, businesses can segment feedback by market and compare ratings, review themes, and sentiment patterns across locations.
5. How can Product Data Scrape support marketplace intelligence?
Product Data Scrape can help businesses structure marketplace data into organized datasets for analysis, enabling teams to evaluate customer feedback, ratings, products, and broader market signals.


 Singapore
 EMAIL
 PHONE










.webp)