Introduction
The Indian social commerce market is creating new opportunities for sellers, retailers, manufacturers, and consumer brands. The Scrape India social commerce report Meesho examines marketplace growth, product pricing, category demand, seller competition, and emerging shopping trends, while Scraping Fast-Selling Categories From Meesho helps businesses identify popular products, monitor price movements, and understand changing consumer preferences. Meesho has become an important part of India's affordable e-commerce ecosystem by connecting consumers with a broad range of products and sellers. Its marketplace provides valuable research opportunities across fashion, beauty, home essentials, electronics accessories, and lifestyle categories. For businesses, understanding which products attract demand, how sellers compete, and where prices change can support better assortment planning and market positioning. This report examines Meesho's marketplace development from 2020 to 2026, highlighting measurable platform growth, category-level research opportunities, pricing intelligence, and practical applications of structured product data.
How Has Meesho's Marketplace Expanded Over the Years?
Meesho's growth reflects the increasing adoption of affordable online shopping across India's urban and non-urban markets. The platform connects consumers with independent sellers and manufacturers, providing access to products across multiple everyday categories. For retailers and brands, Meesho Price Data Scraping provides a way to monitor product prices, discounts, availability, and competing listings. Combined with Marketplace & Seller Intelligence, this information helps businesses understand how merchants position their products and respond to changing demand.
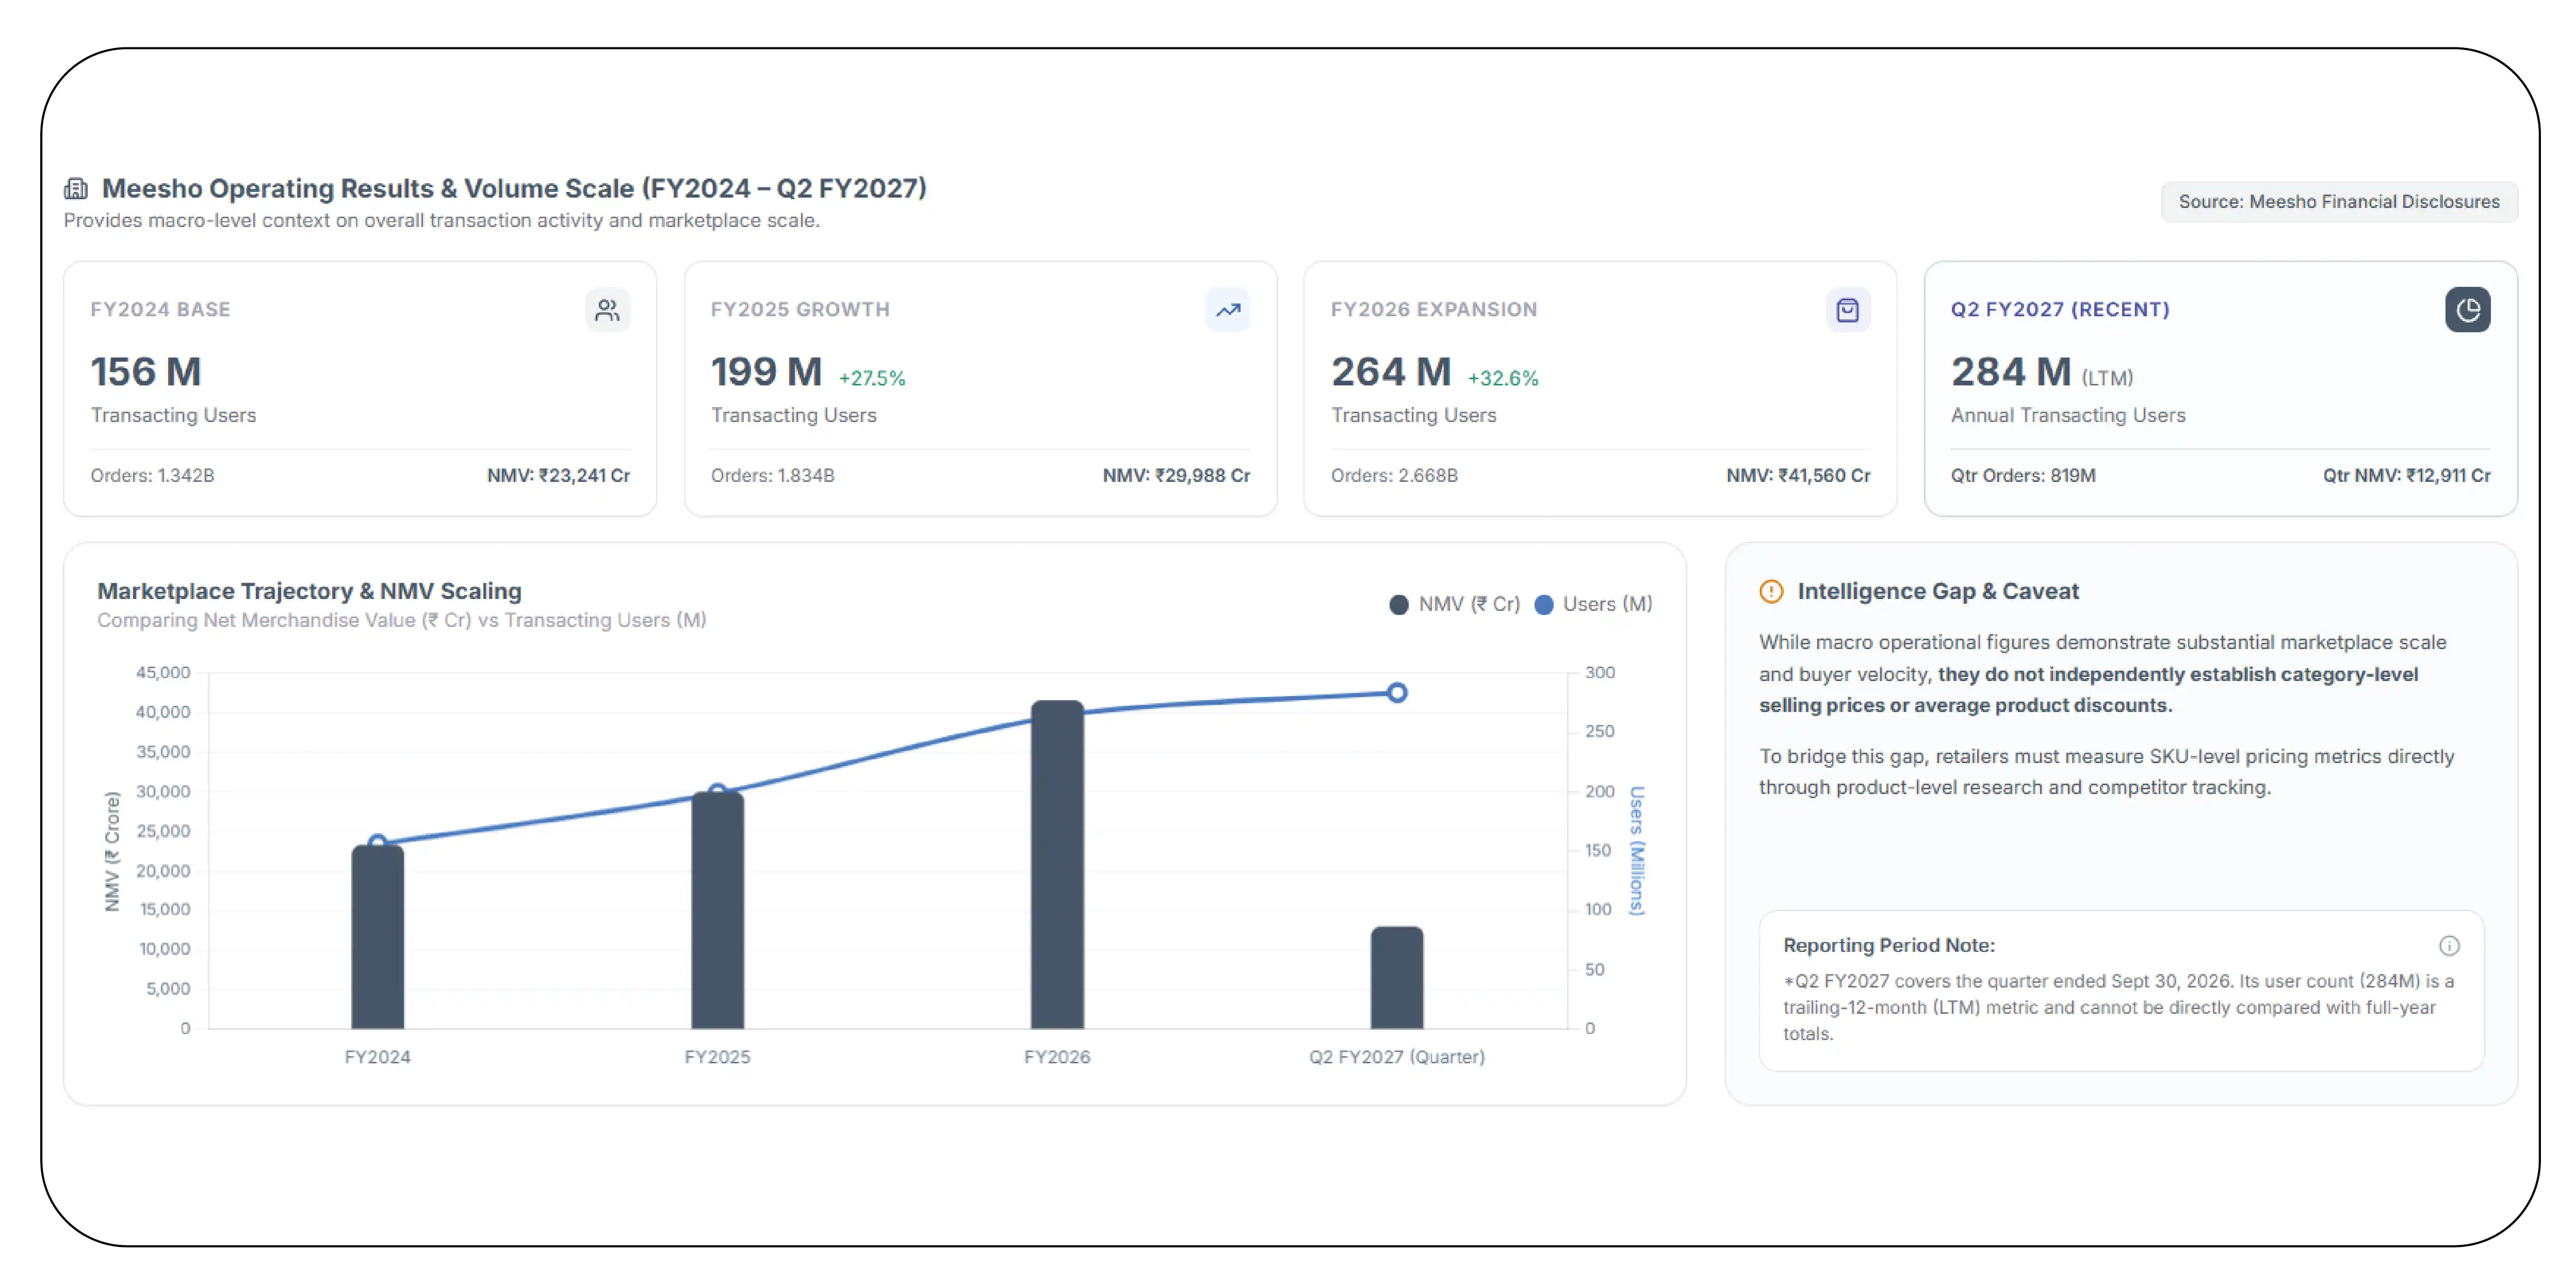
Meesho's growth has been particularly visible in its annual transacting users and placed orders. Its FY2024 annual report recorded 156 million annual transacting users and 1.342 billion orders. In FY2025, annual transacting users increased to approximately 199 million, while placed orders reached 1.834 billion. FY2026 performance further demonstrated this expansion, with 264 million annual transacting users and 2.668 billion placed orders.
| Year / Financial period | Annual transacting users | Orders placed |
|---|
| 2020 | Not separately disclosed on a comparable basis | Not separately disclosed |
| 2021 | Not separately disclosed on a comparable basis | Not separately disclosed |
| FY2022 | 110 million | 610 million |
| FY2023 | 136 million | 1,024 million |
| FY2024 | 156 million | 1,342 million |
| FY2025 | 199 million | 1,834 million |
| FY2026 | 264 million | 2,668 million |
Meesho annual reports and FY2026 shareholder disclosures. Financial years end in March. Figures for 2020 and 2021 are not presented as zero because comparable historical metrics are not available in the cited disclosures.
These numbers show why marketplace intelligence has become important for businesses competing in affordable product segments. More active buyers and higher order volumes create opportunities for merchants, but they also increase competition for product visibility and pricing.
Retailers can use structured marketplace data to identify frequently listed products, compare seller offers, evaluate discount patterns, and understand product availability. For example, a home accessories brand can compare storage organizers, kitchen tools, and decorative products across sellers to identify pricing gaps and assortment opportunities.
The most useful approach is to maintain historical product snapshots instead of collecting listings only once. This makes it possible to evaluate changes in prices, seller participation, and product availability over time.
Which Product Categories Offer the Strongest Research Opportunities?
Category-level research helps businesses understand where consumer demand is concentrated and how sellers compete within individual product segments. Meesho Category-Wise Product Price Scraping in India enables retailers and manufacturers to compare product prices, discounts, listing availability, and seller participation across different departments. This supports better Pricing intelligence and helps businesses identify categories where their products may be competitively positioned.
Meesho offers a broad assortment of fashion, beauty and personal care, home and kitchen, baby essentials, and lifestyle products. These categories provide useful starting points for understanding affordable product demand. However, category popularity should be established through observed listing activity and transaction indicators rather than assumptions about sales.
Businesses can organize their research around the following segments:
| Product category | Research attributes | Potential business application |
|---|
| Women's fashion | Clothing types, sizes, prices | Assortment planning |
| Beauty and personal care | Brands, product variants, discounts | Product positioning |
| Home and kitchen | Product types, ratings, prices | Demand analysis |
| Jewellery and accessories | Designs, seller offers, pricing | Competitor benchmarking |
| Electronics accessories | Models, specifications, availability | Price comparison |
| Baby and kids | Product types, age groups, pricing | Category expansion |
| Footwear | Sizes, styles, discounts | Competitive analysis |
The research should track regular prices, discounted prices, shipping charges, product variations, seller information, and customer feedback. These attributes help retailers understand whether a category is dominated by low-priced products or offers opportunities for differentiated products.
| Year | Category research priority |
|---|
| 2020 | Establish historical category baselines where data exists |
| 2021 | Examine changing online assortment |
| 2022 | Compare seller and product participation |
| 2023 | Identify expanding product segments |
| 2024 | Study category-level pricing differences |
| 2025 | Evaluate assortment and competition |
| 2026 | Monitor current category and promotional trends |
These are recommended research priorities, not verified annual category sales figures. Businesses should validate category performance using collected listing snapshots and available transaction data.
What Can Businesses Learn From India's Growing Digital Shopping Ecosystem?
India's digital commerce ecosystem has expanded through affordable smartphones, internet accessibility, digital payments, and improved delivery networks. Meesho has contributed to this development by making online shopping accessible to a wider consumer base, including customers in smaller cities and towns.
An India Social Commerce Market Dataset can help businesses understand the relationship between marketplace participation, product discovery, pricing, and consumer purchasing behaviour. Studying the broader India market also helps brands distinguish platform-specific trends from wider retail developments.
Meesho's annual performance offers measurable indicators of this expansion. Its FY2026 annual transacting users increased to 264 million, while annual transacting sellers reached 961,000. The company also reported 2.668 billion placed orders during the financial year.
| Financial year | Annual transacting users | Annual transacting sellers | Placed orders |
|---|
| FY2022 | 110 million | — | 610 million |
| FY2023 | 136 million | 450,000 approximately | 1,024 million |
| FY2024 | 156 million | 424,000 approximately | 1,342 million |
| FY2025 | 199 million | 514,000 approximately | 1,834 million |
| FY2026 | 264 million | 961,000 | 2,668 million |
Meesho annual reports and FY2026 disclosures. Seller counts are rounded. FY2022 seller figures are omitted because a comparable figure is not included in the cited dataset.
These figures demonstrate the scale of the marketplace and the importance of understanding its seller ecosystem. More merchants can create wider product choices for consumers while increasing competition for pricing, visibility, and customer attention.
Businesses can use marketplace research to examine how product assortments differ across regions, which merchants offer similar products, and how pricing varies between competing listings. They can also compare marketplace observations with internal sales information to identify potential distribution gaps.
For brands entering India's value-conscious e-commerce segment, this research provides a practical foundation for evaluating product opportunities before expanding inventory or launching new collections.
How Does Marketplace Pricing Influence Competitive Positioning?
Pricing plays a major role in affordable e-commerce because consumers frequently compare similar products before purchasing. India Marketplace Pricing Intelligence helps retailers understand how merchants use discounts, promotional offers, and product variations to attract customers. Combining these observations with Social commerce data provides a broader view of product discovery and marketplace competition.
For example, a seller offering kitchen storage products may face several competitors selling similar designs at different prices. Comparing product specifications, materials, dimensions, ratings, and shipping charges helps determine whether the difference reflects actual product value or simply a pricing strategy.
A useful pricing dataset should contain:
- Original listed price and current selling price.
- Discount percentage and promotional information.
- Product title, brand, model, and specifications.
- Seller name and listing identifier.
- Available product variants.
- Shipping charges and delivery information.
- Ratings and review counts.
- Stock and listing availability.
- Collection date and time.
Meesho's FY2026 operating results also provide context for the importance of marketplace pricing and transaction activity.
| Period | Annual transacting users | Placed orders | Net merchandise value |
|---|
| FY2024 | 156 million | 1.342 billion | ₹23,241 crore |
| FY2025 | 199 million | 1.834 billion | ₹29,988 crore |
| FY2026 | 264 million | 2.668 billion | ₹41,560 crore |
| Q2 FY2027 | 284 million LTM | 819 million quarterly | ₹12,911 crore quarterly |
Meesho financial disclosures. Q2 FY2027 covers the quarter ended September 30, 2026; its annual user figure is a trailing-12-month measure and should not be compared directly with financial-year totals.
The figures show substantial marketplace activity, but they do not independently establish category-level selling prices or average product discounts. Those indicators must be measured through product-level research.
Retailers should also monitor pricing changes around major shopping events, seasonal promotions, and new product launches. Maintaining historical price records helps businesses identify recurring discount patterns and avoid making decisions based on temporary promotional fluctuations.
How Can Historical Price Movements Reveal Product Opportunities?
Understanding how product prices change over time can help businesses improve their competitive strategies. Meesho Pricing Trend Analysis supports the identification of discount patterns, seller price differences, and product-level fluctuations. These findings contribute to the Scrape India social commerce report Meesho by connecting marketplace pricing observations with wider category and seller research.
A reliable pricing study should collect information at regular intervals and maintain historical records. For example, a retailer tracking fashion accessories can monitor the same product across multiple seller listings and compare its prices over several weeks. This helps identify whether price reductions are temporary promotions or part of a longer-term competitive strategy.
The following framework highlights useful research priorities.
| Year | Price monitoring focus | Recommended analysis |
|---|
| 2020 | Historical price baseline | Establish available reference prices |
| 2021 | Promotional price changes | Compare available snapshots |
| 2022 | Seller price differences | Identify competitive gaps |
| 2023 | Product-level price movements | Monitor recurring changes |
| 2024 | Discount and assortment comparisons | Evaluate pricing strategies |
| 2025 | Competitive price positioning | Study merchant differences |
| 2026 | Current price and promotion tracking | Identify emerging opportunities |
This is a proposed research framework. It does not represent measured historical Meesho price movements or verified annual discount rates.
Businesses should compare identical products wherever possible. Product matching can use brand names, model numbers, dimensions, colour, material, and other relevant attributes. Without this process, comparisons between similar but different products may produce misleading conclusions.
Retailers can also segment products into entry-level, mid-range, and premium price bands. This makes it easier to understand where competing products are concentrated and where a new product could be positioned.
For manufacturers, these insights can support product development and distributor pricing. For online sellers, they can help identify competitive pricing opportunities and improve product assortment decisions. Regular monitoring also makes it easier to detect unusual price changes and investigate their possible causes.
Which Marketplace Indicators Help Identify Fast-Selling Products?
Identifying fast-selling products requires more than looking at low prices or high listing counts. Businesses need to examine multiple indicators, including order activity where accessible, review growth, listing visibility, seller participation, product availability, and repeated promotional activity.
Meesho Marketplace Price Tracking helps retailers compare product prices and monitor changes across competing seller listings. When integrated into the Scrape India social commerce report Meesho, this information supports a more comprehensive understanding of product performance and competitive positioning.
Businesses should distinguish between products that are frequently listed and products that actually generate strong sales. Listing counts alone do not prove demand. Similarly, high review counts may reflect historical popularity rather than current sales momentum.
A practical fast-selling product research framework includes:
- Listing activity: Track newly added products and changes in existing listings.
- Price competitiveness: Compare current and historical selling prices.
- Review movement: Observe changes in review counts over time.
- Seller participation: Identify the number of merchants offering comparable products.
- Availability: Monitor changes in stock and listing status.
- Promotional activity: Identify products receiving recurring discounts.
- Product variations: Compare demand indicators across sizes, colours, and models.
| Year | Fast-selling product research focus | Business application |
|---|
| 2020 | Identify available product baselines | Initial assortment planning |
| 2021 | Examine product discovery changes | Product opportunity research |
| 2022 | Compare seller and listing activity | Competition analysis |
| 2023 | Monitor review and availability changes | Product evaluation |
| 2024 | Study category and price patterns | Assortment optimization |
| 2025 | Compare recurring product activity | Seller benchmarking |
| 2026 | Identify current product opportunities | Market-entry decisions |
These are recommended research stages, not verified historical rankings of Meesho's best-selling products.
For stronger results, businesses should combine marketplace observations with their own order records, inventory data, and customer feedback. This creates a more reliable method of evaluating fast-moving products and prioritizing products for sourcing, marketing, and inventory investment.
Product Data Scrape helps businesses collect, organize, and analyze marketplace information for competitive research, pricing analysis, and product assortment planning. For brands, manufacturers, retailers, and market research companies, structured product datasets can reduce manual research and make marketplace comparisons more consistent.
With a customized Meesho Scraping API, businesses can collect relevant marketplace information and integrate it into their research workflows, dashboards, and business intelligence systems, subject to applicable platform access and usage requirements.
Key capabilities include:
- Product information extraction: Collect product titles, descriptions, brands, specifications, and variations.
- Price monitoring: Track listed prices, discounts, and promotional changes.
- Seller intelligence: Examine merchant participation and competing product listings.
- Category research: Organize products into relevant categories for comparative analysis.
- Availability monitoring: Track listing and stock-status changes.
- Historical datasets: Maintain time-based records for identifying marketplace changes.
- Custom data delivery: Receive structured datasets in formats suitable for business analysis.
The Scrape India social commerce report Meesho can support businesses looking to understand product demand, identify competitive categories, and evaluate seller positioning.
Product Data Scrape focuses on delivering organized, business-ready information that can help companies improve pricing decisions, identify assortment opportunities, and develop stronger marketplace strategies.
Conclusion
Meesho's expanding marketplace demonstrates the growing importance of affordable digital commerce in India. Increasing user participation, rising order volumes, and a broader seller ecosystem create opportunities for retailers, manufacturers, and consumer brands. However, businesses need reliable product-level information to understand category competition, evaluate pricing strategies, and identify emerging opportunities.
Catalog Enrichment Services can further help businesses organize product information, standardize attributes, improve product matching, and maintain consistent datasets across research and commerce platforms.
A structured approach to marketplace research can help businesses:
- Identify competitive product categories.
- Compare seller pricing and promotional activity.
- Monitor product availability and listing changes.
- Understand category-level competition.
- Discover potential fast-selling product opportunities.
- Improve product assortment and pricing strategies.
The Scrape India social commerce report Meesho provides a research framework for understanding marketplace developments from 2020 to 2026. Combining historical platform performance with structured product, seller, and pricing information can help businesses make more informed decisions.
Ready to uncover new opportunities in India's social commerce market?
Partner with Product Data Scrape for customized Meesho product data extraction, category research, competitor price monitoring, and marketplace intelligence solutions. Get structured insights to strengthen your competitive strategy and make smarter e-commerce decisions!


 Singapore
 EMAIL
 PHONE











.webp)