Introduction
Retailers can identify missing products and increase sales by comparing their catalog with competitor products, categories, brands, variants, prices, and availability. Competitor Assortment Gap Analysis for Catalog Data converts competitor catalog information into actionable insights for merchandising, sourcing, category expansion, and product onboarding.
A retailer may have thousands of products yet still lose customers because competitors offer a more complete selection. Missing products can include entire categories, individual SKUs, pack sizes, colors, sizes, brands, price tiers, or newly launched products. Modern assortment analysis helps teams identify these differences systematically rather than relying on manual website checks.
Assortment and availability monitoring adds another important dimension. A product appearing on a competitor website does not necessarily mean it is consistently available. Tracking listing status over time helps distinguish a genuine assortment difference from a temporary stock-out or discontinued item.
Current ecommerce catalog intelligence solutions commonly compare competitor catalogs by retailer, category, brand, SKU, and market while tracking new product additions, delistings, overlap, and category depth.
For category managers, ecommerce heads, merchandising teams, and retail analysts, the core objective is straightforward: identify commercially meaningful gaps, validate them with competitive and demand signals, and prioritize products that can strengthen the assortment.
How Can Retailers Build a Complete View of Competitor Catalogs?
Scrape Competitor Catalog for Gap Analysis to create a structured view of the products competitors make available to customers. A competitive catalog dataset should capture more than product names. It should include SKU or product identifiers, brands, categories, subcategories, prices, availability, variants, product URLs, ratings, reviews, specifications, and collection timestamps.
Catalog normalization is essential because different retailers organize the same product differently. One competitor may classify a product under "Kitchen Appliances," while another may place it under "Small Appliances." Without taxonomy normalization, category comparisons can produce misleading results.
The same principle applies to product names. A competitor may use a shortened product title while another uses a detailed specification-led title. Matching should therefore use multiple attributes whenever available.
Market Share Analytics can complement assortment analysis by helping teams understand where competitive catalog presence is concentrated. Assortment data does not directly equal market share, but it can provide valuable context around brand and category presence.
Catalog Monitoring Growth Targets
| Year |
Catalog Coverage Target |
Core Data Fields |
Recommended Review |
| 2020 |
30% |
10 |
Monthly |
| 2021 |
40% |
12 |
Monthly |
| 2022 |
50% |
15 |
Biweekly |
| 2023 |
60% |
18 |
Weekly |
| 2024 |
70% |
22 |
Weekly |
| 2025 |
85% |
26 |
Daily |
| 2026 |
90%+ |
30+ |
Daily |
These are operational planning targets, not industry-wide statistics.
A complete dataset allows category managers to compare their own catalog against several competitors simultaneously. It can reveal which competitors have greater category depth, which brands are expanding, which products are newly introduced, and where the retailer has meaningful assortment gaps.
What Can Assortment Gap Analysis Reveal About a Retailer's Catalog?
Competitor Assortment Gap Analysis identifies products, categories, brands, variants, or price tiers available from competitors but absent or underrepresented in a retailer's own catalog.
The most valuable gaps are not necessarily the largest gaps. A competitor may have thousands of additional SKUs, but many could be low-demand long-tail products. A smaller gap involving a highly relevant product family can be more commercially important.
Retailers should therefore score gaps according to several factors. Competitor penetration is one useful signal. If four major competitors carry a product and the retailer does not, the gap deserves more attention than a product found on only one competitor.
Availability persistence is another signal. A product consistently available for several months provides stronger evidence of assortment importance than a listing that appears briefly.
Customer engagement can also help prioritize opportunities. Ratings, review volume, search demand, internal sales data, and conversion information can be combined with competitor catalog data to establish stronger business cases.
Gap Identification Metrics
| Year |
Products Compared |
Competitor Coverage |
Gap Prioritization |
| 2020 |
10,000 |
2 competitors |
Manual |
| 2021 |
25,000 |
3 competitors |
Basic ranking |
| 2022 |
50,000 |
4 competitors |
Rule-based |
| 2023 |
100,000 |
5 competitors |
Weighted scoring |
| 2024 |
250,000 |
6 competitors |
Multi-factor |
| 2025 |
500,000 |
8 competitors |
Automated scoring |
| 2026 |
1M+ |
10+ competitors |
Dynamic prioritization |
These figures represent scalable operating targets for a monitoring program.
A strong gap report should answer practical questions: Which products are missing? How many competitors carry them? How long have they been available? Are they consistently in stock? What price tier do they occupy? Does the retailer already have a similar product?
This changes assortment planning from a simple product-count comparison into a commercial decision framework.
How Does SKU-Level Competitive Data Improve Product Decisions?
Scrape Competitor SKU Data for Analysis to understand the precise products and variants that competitors offer. Category-level comparisons can identify broad gaps, but SKU-level data reveals the details required for merchandising decisions.
Consider a fashion category. A retailer may offer a particular jacket but only in two colors and three sizes, while competitors provide six colors, a wider size range, and multiple fits. A basic product match could incorrectly conclude that there is no assortment gap. SKU and variant analysis exposes the deeper opportunity.
The same applies to electronics, grocery, beauty, furniture, and consumer goods. Gaps can occur at the model, capacity, flavor, pack size, color, material, configuration, or compatibility level.
SKU-level monitoring also helps retailers track new product introductions. If several competitors add products within the same subcategory, the pattern can indicate increasing competitive activity.
SKU Intelligence Expansion
| Year |
SKU Attributes |
Variant Coverage |
Historical Tracking |
| 2020 |
8 |
Basic |
30 days |
| 2021 |
10 |
Basic |
60 days |
| 2022 |
14 |
Moderate |
90 days |
| 2023 |
18 |
Expanded |
180 days |
| 2024 |
22 |
Advanced |
12 months |
| 2025 |
27 |
Automated |
18 months |
| 2026 |
30+ |
Continuous |
24 months |
The figures represent recommended data maturity targets.
Historical SKU data is especially useful because it distinguishes persistent assortment differences from temporary changes. A product that appears across multiple competitors over an extended period is more relevant than a product that was briefly listed.
Retailers can then combine competitive SKU data with internal sales and inventory information to determine which gaps are worth closing.
Why Is Accurate Product Matching Essential for Assortment Decisions?
Product Matching for Assortment Analysis prevents retailers from confusing different listings of the same product with separate products. Accurate matching is one of the most important foundations of competitive assortment intelligence.
Retailers should use multiple matching attributes wherever available. Product identifiers, model numbers, brand names, normalized titles, pack sizes, specifications, dimensions, images, and variant attributes can all contribute to a stronger match.
Variant matching requires additional attention. Two listings may represent the same parent product but different colors, sizes, capacities, or configurations. Retailers should preserve this distinction rather than treating every variant as a duplicate.
Confidence scoring can help manage ambiguous matches. High-confidence matches can move directly into analysis, while uncertain matches can be reviewed manually.
Product Matching Maturity
| Year |
Matching Signals |
Automation |
Quality Control |
| 2020 |
2 |
Low |
Manual |
| 2021 |
3 |
Low |
Manual sampling |
| 2022 |
5 |
Moderate |
Exception review |
| 2023 |
7 |
Moderate |
Confidence scoring |
| 2024 |
9 |
High |
Automated validation |
| 2025 |
12 |
High |
Exception-based review |
| 2026 |
15+ |
Advanced |
Continuous validation |
These represent process-development targets rather than external market statistics.
Poor product matching can create false gaps. A retailer might appear to be missing a product simply because the competitor uses a different title or identifier. Better matching produces cleaner overlap measurements and more reliable opportunity reports.
For merchandising teams, the result is a clearer distinction between products the retailer genuinely lacks and products it already sells under different catalog structures.
How Can Product Listings Expose Missing Assortment Opportunities?
Scrape Product Listings for Assortment Gaps to capture the detailed information required to determine whether competitor products represent genuine opportunities.
A product listing can reveal the product name, brand, SKU, category, price, discount, availability, ratings, reviews, variants, specifications, seller information, and URL. When collected consistently, these fields create a competitive product dataset that can be compared with internal catalog records.
Availability should be tracked over time. A product listed by a competitor but frequently unavailable may not represent a stable assortment advantage. Conversely, a product consistently available across multiple competitors can signal stronger competitive coverage.
Price positioning can provide another useful dimension. A retailer may have a product category but lack products within a specific price tier. Competitors may offer entry-level, mid-range, and premium options while the retailer focuses on only one segment.
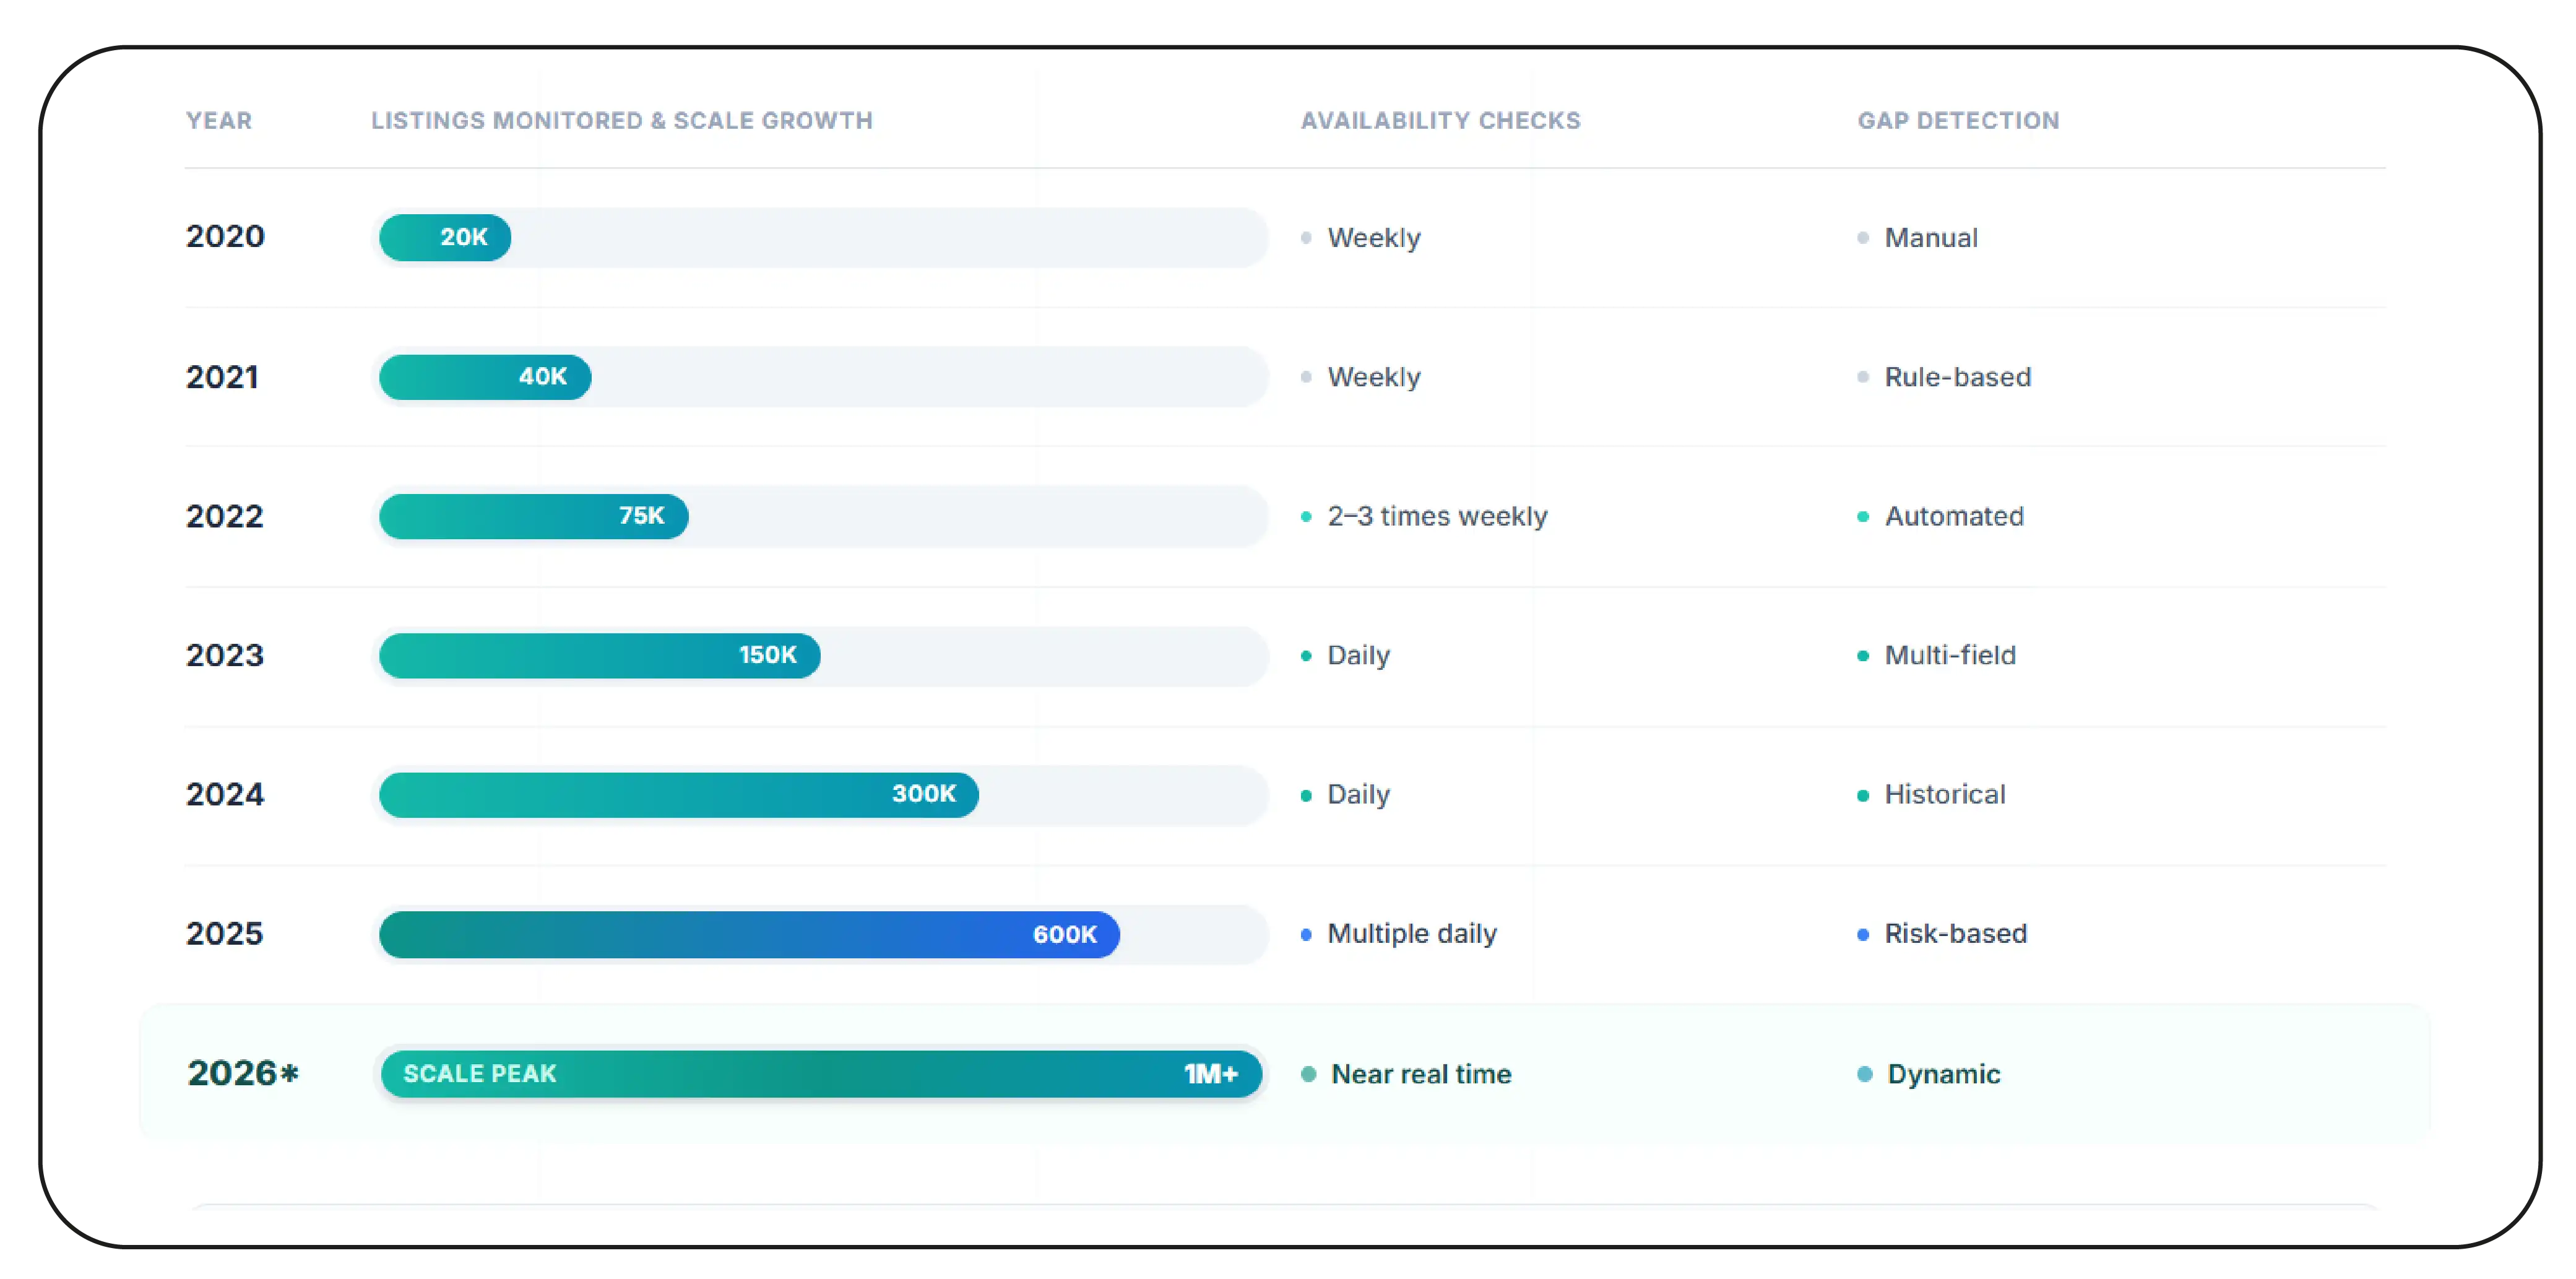
Product Listing Monitoring Targets
| Year |
Listings Monitored |
Availability Checks |
Gap Detection |
| 2020 |
20K |
Weekly |
Manual |
| 2021 |
40K |
Weekly |
Rule-based |
| 2022 |
75K |
2–3 times weekly |
Automated |
| 2023 |
150K |
Daily |
Multi-field |
| 2024 |
300K |
Daily |
Historical |
| 2025 |
600K |
Multiple daily |
Risk-based |
| 2026 |
1M+ |
Near real time |
Dynamic |
These are operational scale targets for catalog monitoring.
Listing-level data becomes more valuable when it is joined with internal product information. Teams can identify products competitors carry but the retailer does not, products with missing variants, products available elsewhere but out of stock internally, and categories where competitor depth is significantly higher.
How Can Retailers Turn Competitive Catalog Differences Into Sales Opportunities?
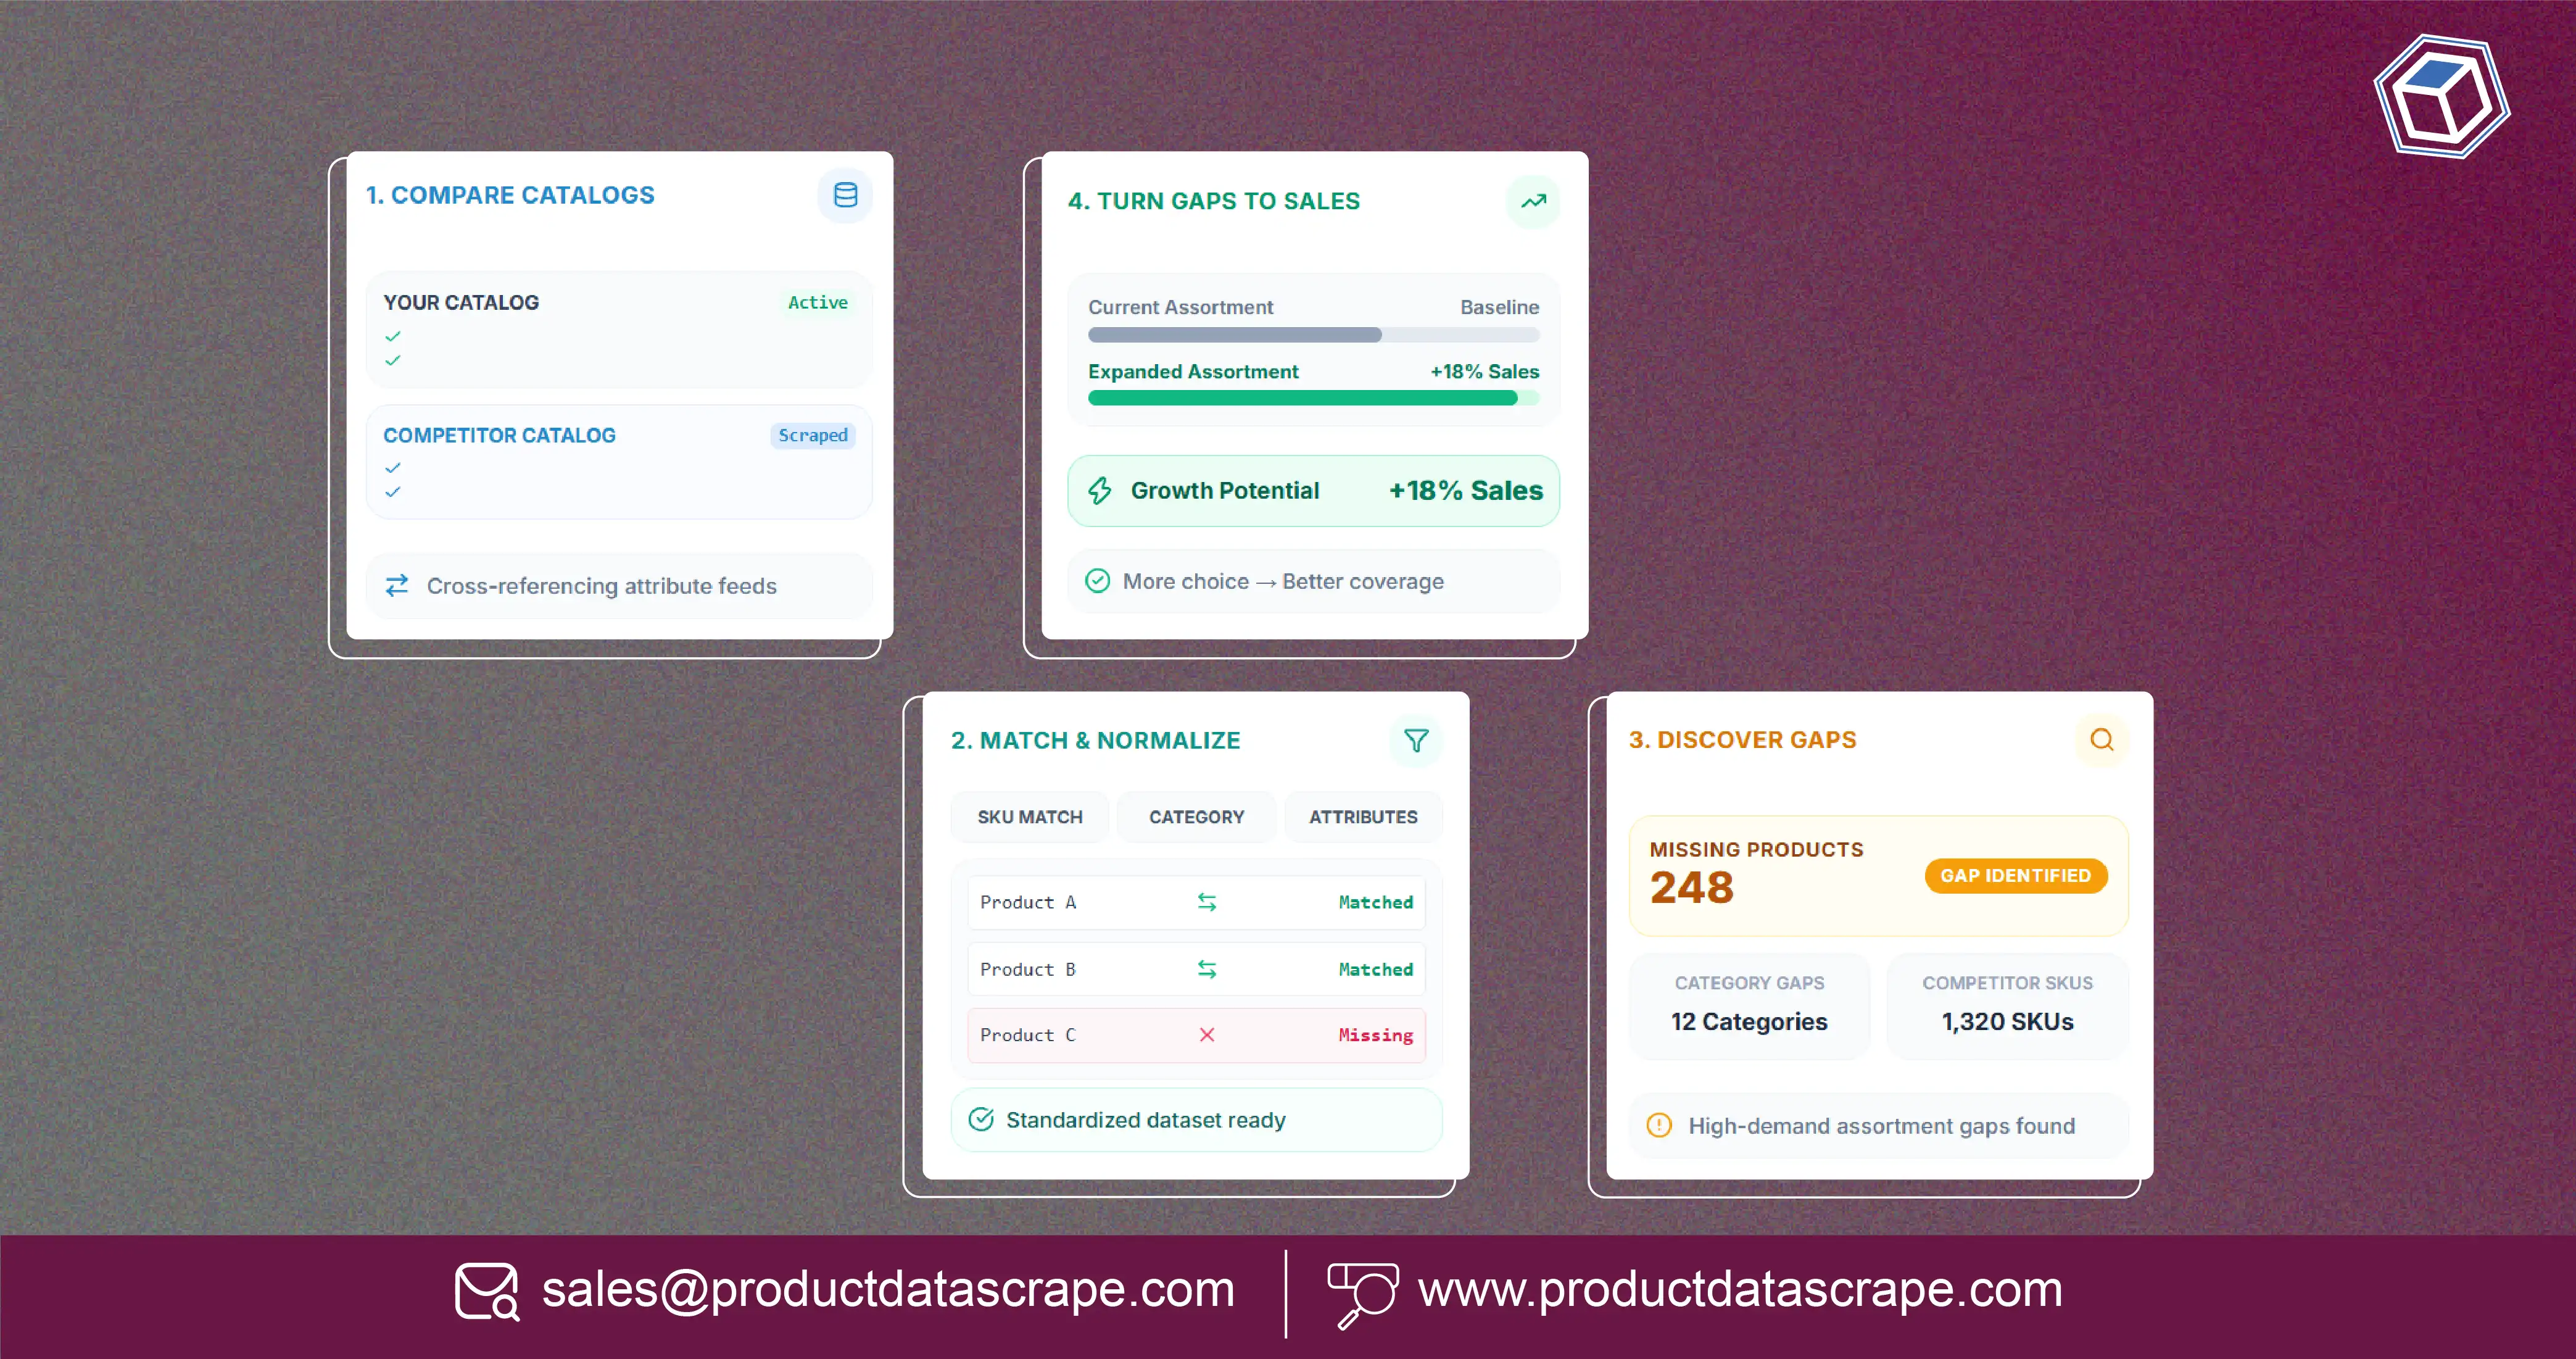
Product matching connects competitor products with the retailer's catalog so that gaps can be categorized and prioritized. Competitor Assortment Gap Analysis for Catalog Data then turns those differences into actionable recommendations for category managers and merchandising teams.
A useful workflow separates gaps into different types. Product gaps occur when competitors carry products the retailer does not. Variant gaps occur when the retailer carries the parent product but misses important options. Category gaps occur when competitors have entire subcategories absent from the retailer's range. Price-tier gaps occur when the retailer does not cover an important market segment.
New-product monitoring adds another layer. When competitors repeatedly introduce products within the same category, retailers can identify emerging assortment movements before they become obvious in periodic reviews.
Current catalog intelligence approaches commonly measure SKU counts, newness, delistings, category structure, assortment overlap, and exclusive products across retailers.
Decision Intelligence Maturity
| Year |
Decision Signals |
Output |
Review Model |
| 2020 |
3 |
Manual shortlist |
Category team |
| 2021 |
4 |
Gap report |
Category team |
| 2022 |
5 |
Priority ranking |
Merchandising |
| 2023 |
7 |
SKU recommendations |
Cross-functional |
| 2024 |
9 |
Opportunity scoring |
Governance rules |
| 2025 |
12 |
Dynamic recommendations |
Exception review |
| 2026 |
15+ |
Continuous opportunity feed |
Automated + human |
These are operating-model targets, not reported market statistics.
The objective is not to copy competitors. It is to identify gaps that align with customer demand, category strategy, margins, inventory capability, and brand positioning.
For example, if multiple competitors carry a product, it remains consistently available, and internal search or sales data indicates customer interest, that gap can receive a higher priority. If the product has little demand and weak commercial fit, the retailer can avoid unnecessary catalog expansion.
This creates a disciplined connection between competitive intelligence and assortment decisions.
Why Choose Product Data Scrape?
Competitor price monitoring provides an important additional layer to assortment intelligence by showing how competitors position products across different price bands. Combining price, catalog, SKU, availability, and product-matching data helps retailers understand not only what competitors sell but also how their ranges are structured. Product Data Scrape can support scalable competitive data workflows that reduce manual catalog audits and provide structured information for merchandising and category teams. The focus is on usable data rather than disconnected product pages. Retailers can use recurring datasets to identify missing products, monitor category depth, detect new launches, compare competitive coverage, and prioritize assortment decisions using consistent evidence.
Conclusion
Retailers can improve product discovery and sales opportunities by continuously comparing their catalog with competitor products, variants, categories, brands, prices, and availability. Product Data Feed API solutions can help deliver structured product information into analytics and merchandising workflows, while Competitor Assortment Gap Analysis for Catalog Data identifies where competitive coverage exceeds the retailer's own range. The strongest approach combines accurate product matching, historical availability, competitor penetration, and internal demand signals. With Product Data Scrape, teams can build scalable catalog intelligence and respond faster to competitive assortment changes.
Contact Product Data Scrape today to uncover high-value assortment gaps and build a smarter, data-driven product strategy!
FAQs
1. What is competitor assortment gap analysis?
It compares a retailer's catalog with competitors to identify missing products, brands, categories, variants, and price tiers that may represent commercially relevant assortment opportunities.
2. Why does product matching matter?
Product matching prevents the same product from being counted as different items because of variations in titles, descriptions, SKUs, brands, specifications, or marketplace catalog structures.
3. What data should retailers compare?
Retailers should compare SKUs, brands, categories, product attributes, variants, prices, availability, ratings, reviews, pack sizes, specifications, and historical listing changes.
4. How frequently should competitor catalogs be monitored?
Daily monitoring is useful for fast-changing categories, while weekly or biweekly monitoring can work for slower categories. Frequency should reflect competitive volatility and business priorities.
5. How can Product Data Scrape support assortment analysis?
Product Data Scrape can provide structured competitor catalog data for SKU comparison, product matching, availability monitoring, price analysis, historical tracking, and assortment gap identification.


 Singapore
 EMAIL
 PHONE











.webp)