Introduction
Quick commerce has changed how consumers discover, compare, and purchase everyday products. Instead of waiting for conventional e-commerce delivery windows, shoppers increasingly expect groceries, household essentials, personal care products, electronics, and other frequently purchased items to arrive within minutes. This shift has made product assortment, inventory availability, pricing, delivery coverage, and local SKU visibility important areas for retailers and brands.
The Flipkart Minutes Daily Monitoring Report 2026 examines the changing quick-commerce environment through daily marketplace data, with particular attention to product availability, pricing, assortment, SKU-level movements, and delivery coverage. Flipkart Minutes launched in August 2024 and has expanded rapidly. In June 2026, Flipkart announced that Minutes had crossed 1,000 micro-fulfilment centers across more than 130 cities and 8,000+ pincodes.
The platform's expansion continued through September 2026, when Flipkart reported nearly 1,200 micro-fulfilment centers across more than 150 cities and 4X year-on-year growth. This expanding footprint makes daily monitoring increasingly relevant for businesses seeking granular visibility into local product availability and competitive movements.
Another important consideration is Flipkart Quick Dark Store Coverage, because the geographical distribution of micro-fulfilment centers can influence which products are visible to consumers in different locations. A structured monitoring program can therefore connect marketplace assortment with location-specific availability and delivery signals.
Tracking Daily Changes Across the Marketplace
Real-Time Flipkart Minutes Assortment Monitoring provides businesses with a way to observe changes in product availability, category coverage, prices, discounts, sellers, and SKU presence at regular intervals. In quick commerce, a product catalog is not static. Items can become unavailable, new products can be introduced, prices can change, and local assortment can vary according to demand and fulfillment capacity.
A Flipkart scraper can help collect publicly accessible product-level information and organize it into structured records for comparison and historical analysis. Relevant fields may include product name, brand, category, SKU, MRP, selling price, discount, availability, rating, delivery estimate, location, and product URL.
| Monitoring Metric |
Business Application |
| Product count |
Measures assortment depth |
| SKU availability |
Identifies active and unavailable products |
| Selling price |
Tracks daily price movements |
| Discount |
Measures promotional activity |
| Category coverage |
Identifies assortment expansion |
| Delivery estimate |
Tracks service availability |
| Product status |
Detects listing changes |
2020–2026 Development
Between 2020 and 2022, Indian e-commerce remained heavily focused on conventional delivery models, while consumers increasingly became comfortable purchasing groceries and everyday products online. During 2023, quick-commerce operators increasingly emphasized smaller fulfillment locations and faster delivery windows. Flipkart Minutes entered the market in August 2024, creating a new monitoring opportunity around rapid local assortment changes. By 2025, Flipkart reported 16X year-on-year order growth in the second half of the year and more than 53 million unique visitors, while expanding into more than 30 new cities. In September 2025, Flipkart also stated that Minutes would provide 10-minute delivery across 19 cities and 3,000 pincodes during The Big Billion Days. By June 2026, the network had crossed 1,000 micro-fulfilment centers and 130+ cities. In September 2026, Flipkart reported nearly 1,200 micro-fulfilment centers across 150+ cities. This progression illustrates why daily data collection has become increasingly useful. Businesses can compare morning and evening availability, monitor category expansion, identify newly introduced SKUs, and track how product visibility changes across locations.
Building a Structured View of Market Activity
A Flipkart Minutes Market Intelligence Dataset can transform frequently changing marketplace observations into structured records suitable for business analysis. Instead of looking at individual product pages, organizations can consolidate thousands of observations across categories, brands, locations, and dates.
A useful dataset can include product attributes, pricing, inventory status, seller information, ratings, delivery estimates, promotional details, and timestamps. Historical records allow businesses to identify recurring patterns rather than relying on a single marketplace snapshot.
| Dataset Component |
Example Insight |
| Product information |
Catalog composition |
| Brand |
Brand-level presence |
| SKU |
Product-level monitoring |
| Price |
Competitive pricing |
| Discount |
Promotional intensity |
| Availability |
Inventory visibility |
| Location |
Local assortment |
| Timestamp |
Historical comparison |
2020–2026 Development
The 2020–2022 period accelerated digital grocery adoption and increased the importance of online product visibility. From 2023 onward, quick commerce introduced a more location-sensitive model in which product availability could depend on nearby fulfillment capacity. Flipkart Minutes launched in 2024 and subsequently expanded its geographic and category coverage. During 2025, Flipkart said Minutes expanded into more than 30 new cities, while fruits and vegetables represented 45% of every basket according to the company's December 2025 announcement. The company also highlighted AI-driven demand forecasting, real-time inventory synchronization, automated dark-store operations, and intelligent routing as components of its operating model. In 2026, the continued expansion of fulfillment infrastructure created an even larger data environment for market researchers. The June 2026 milestone of 1,000 micro-fulfilment centers across 130+ cities and 8,000+ pincodes illustrates the increasing geographic scale. A structured intelligence dataset can preserve this evolution by recording product and price observations over time. Brands can use these records to understand which categories are expanding, where specific SKUs are consistently available, how discounts change, and whether assortment varies between locations. This makes daily marketplace data useful for competitive research, category planning, and retail intelligence.
Measuring Delivery Promise and Product Availability
Flipkart Minutes 10-Minute Delivery Monitoring focuses on the relationship between product availability and the platform's rapid-delivery promise. Monitoring can capture delivery estimates, product availability, serviceable locations, and changes in the assortment presented to shoppers.
For brands, delivery visibility can be especially relevant because an unavailable product may have a different commercial impact from a product that is available but offered with a longer delivery window.
| Delivery Indicator |
Monitoring Purpose |
| Delivery estimate |
Measures displayed speed |
| Product availability |
Identifies serviceable inventory |
| Pincode |
Tracks geographic coverage |
| Store/location |
Connects inventory to fulfillment |
| Category |
Compares delivery coverage |
| Timestamp |
Records delivery changes |
2020–2026 Development
The transition from traditional e-commerce toward quick commerce accelerated throughout the 2020–2024 period. Conventional online retail often focused on next-day or scheduled delivery, whereas quick commerce introduced delivery expectations measured in minutes. Flipkart Minutes launched in August 2024 and subsequently expanded its network of micro-fulfilment centers. In 2025, the company announced 10-minute delivery across 19 cities and 3,000 pincodes during its Big Billion Days event. The same year, it expanded into cities including Hyderabad, Chennai, Mysore, and Rohtak, with local assortment adapted to regional consumer preferences. By June 2026, the company reported 1,000 micro-fulfilment centers across 130+ cities and 8,000+ pincodes. By September, that figure had reached nearly 1,200 micro-fulfilment centers across 150+ cities. These developments make delivery monitoring a useful component of marketplace intelligence. Historical observations can reveal whether specific products consistently carry the 10-minute promise, whether delivery availability differs by location, and whether expanding fulfillment infrastructure changes local assortment. For brands, these insights can complement pricing and inventory data and provide a more complete picture of the customer-facing marketplace experience.
Comparing Individual Products at Scale
Flipkart Minutes SKU-Level Competitive Analysis enables businesses to move beyond broad category comparisons and evaluate individual products. SKU-level monitoring can identify differences in pricing, discounts, availability, ratings, brand presence, and delivery status.
For FMCG and grocery brands, SKU-level information is especially useful because seemingly similar products may differ by pack size, flavor, quantity, formulation, or brand.
| SKU Attribute |
Competitive Use |
| SKU/product ID |
Unique product tracking |
| Product name |
Catalog matching |
| Brand |
Brand comparison |
| Pack size |
Like-for-like analysis |
| Selling price |
Price comparison |
| Discount |
Promotion monitoring |
| Availability |
Stock comparison |
| Rating |
Customer-facing signal |
2020–2026 Development
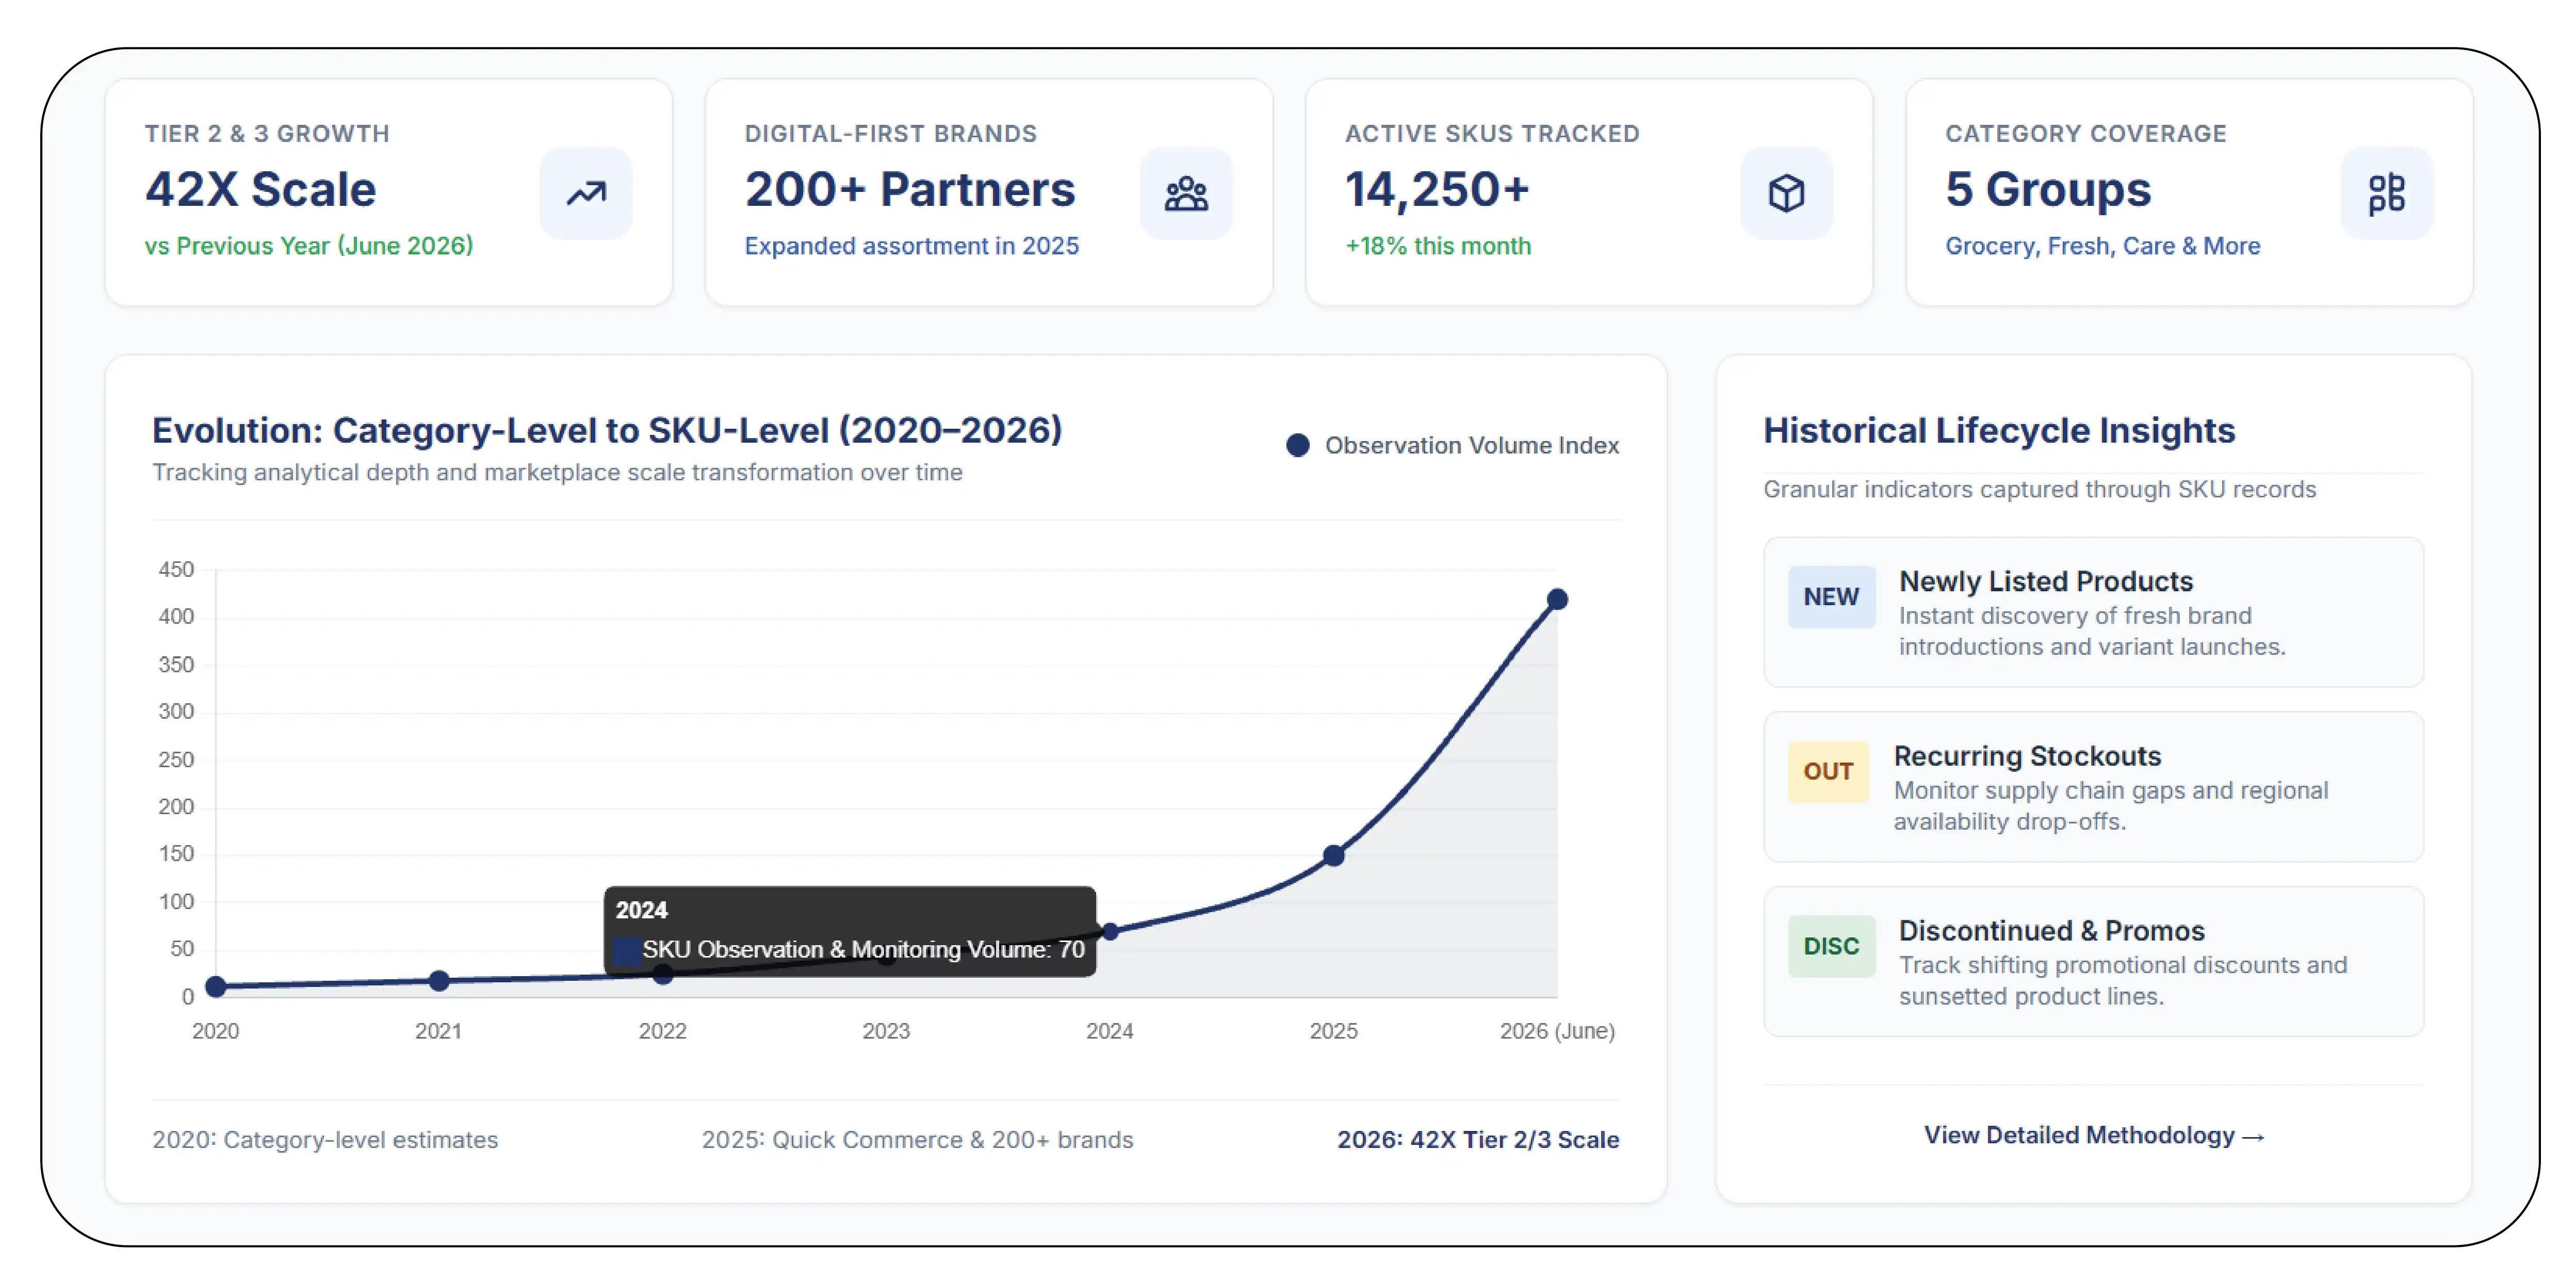
From 2020 to 2022, online grocery analysis often relied on category-level observations because data collection at scale was more difficult. As quick commerce expanded, SKU-level monitoring became more valuable because fulfillment networks could carry large numbers of products with different local availability. Flipkart Minutes expanded its category presence during 2025, including grocery, fresh produce, personal care, electronics, and other product groups. The company also reported collaborations with more than 200 digital-first brands during 2025. This broader assortment creates more opportunities for SKU-level comparison. In 2026, the growth of the fulfillment network further increases the volume of product observations that can be monitored. Flipkart reported that Tier 2 and Tier 3 markets were driving significant growth, with the company citing 42X scale compared with the previous year in these markets in its June 2026 announcement. SKU-level monitoring can help businesses identify whether a product is available across multiple locations, whether its price differs geographically, and whether competitor products are being introduced into the same category. Historical SKU records can also reveal product lifecycle changes, including newly listed products, discontinued products, recurring stockouts, and changing promotional activity. This level of granularity can support brand monitoring, category research, assortment planning, and competitor intelligence.
Measuring Performance Through Delivery Data
Flipkart Minutes 10-minute delivery analytics can combine product, inventory, location, and delivery observations to help businesses understand the operational characteristics of quick commerce from the customer-facing side.
Rather than analyzing delivery speed independently, businesses can connect delivery observations with assortment and stock information to understand which products are consistently available within the advertised service window.
| Analytics Area |
Potential Insight |
| Delivery availability |
Service coverage |
| SKU availability |
Product accessibility |
| Location |
Geographic differences |
| Category |
Delivery coverage by category |
| Time of observation |
Daily fluctuations |
| Stock status |
Availability patterns |
2020–2026 Development
Between 2020 and 2022, delivery analytics in Indian e-commerce primarily centered on conventional fulfillment timelines. The rise of quick commerce shifted attention toward fulfillment measured in minutes. Flipkart Minutes entered the market in 2024 and expanded its infrastructure during 2025 and 2026. In December 2025, Flipkart reported that customers in Bengaluru, Kolkata, Mumbai, and NCR were placing an average of more than 5 million orders per month collectively, while also highlighting expansion across Tier 2 and Tier 3 markets. The company said its operating model uses AI-driven demand forecasting, real-time inventory synchronization, automated dark-store operations, and intelligent routing. In 2026, the platform's reported network expansion provided a larger geographic base for analyzing delivery availability. The company reported more than 1,000 micro-fulfilment centers by June and nearly 1,200 by September. Delivery analytics can therefore be combined with product and inventory monitoring to identify patterns across locations and time periods. Businesses can examine whether certain categories consistently maintain the 10-minute promise, whether availability changes during peak periods, and how assortment differs between mature and newly launched locations. This creates a more detailed understanding of the customer-facing quick-commerce environment.
Identifying Missing Products and Category Opportunities
Flipkart Assortment Gap Analysis helps businesses identify products, brands, pack sizes, categories, or variants that may be absent or underrepresented in a monitored marketplace assortment.
Gap analysis can compare an internal product catalog with observed marketplace listings. Businesses can also compare the availability of competitor products, identify frequently unavailable SKUs, and examine differences between locations.
| Gap Indicator |
Potential Business Insight |
| Missing SKU |
Potential assortment opportunity |
| Missing brand |
Competitive coverage gap |
| Missing pack size |
Variant opportunity |
| Repeated stockout |
Availability gap |
| Category undercoverage |
Assortment expansion opportunity |
| Regional difference |
Localized assortment opportunity |
2020–2026 Development
The 2020–2022 period established online grocery and essential-product purchasing as an important digital retail channel, while 2023–2024 saw quick commerce accelerate the focus on hyperlocal availability. Flipkart Minutes launched in August 2024 and expanded rapidly during 2025. The company reported more than 53 million unique visitors during 2025 and expansion into over 30 new cities. Its city-level expansion also demonstrated how assortment could be adapted to regional preferences. For example, Flipkart's 2025 announcements for Hyderabad and Chennai highlighted locally popular brands alongside broader grocery, electronics, and daily-essentials assortments. In 2026, network expansion further increased the potential for regional assortment differences. Flipkart reported more than 1,000 micro-fulfilment centers in June and nearly 1,200 across 150+ cities in September. This creates a broader dataset for identifying assortment gaps by city, pincode, category, and SKU. Businesses can compare their product portfolios with observed marketplace availability and identify products that competitors offer but they do not. They can also monitor whether gaps are temporary or persistent by using repeated daily observations. Such analysis can support assortment planning, brand expansion research, product launches, and regional retail strategies.
Why Choose Product Data Scrape?
Product Data Scrape provides structured data collection and monitoring solutions for businesses that need recurring visibility into fast-changing e-commerce and quick-commerce marketplaces.
With Scrape 10-Minute Delivery Assortment, businesses can create datasets covering products that are presented through rapid-delivery services. The collected information can be normalized, validated, deduplicated, and organized according to the client's required schema.
The solution can capture product names, brands, categories, SKUs, prices, discounts, availability, ratings, delivery information, locations, and other accessible marketplace attributes. Recurring collection makes it possible to compare daily observations and identify changes that may not be visible through one-time research.
Product Data Scrape can also structure data for dashboards, databases, analytics platforms, or custom business intelligence workflows. Historical snapshots can support price tracking, assortment monitoring, inventory analysis, competitor research, SKU-level comparison, and regional market analysis.
As quick-commerce networks expand across cities and pincodes, structured data becomes increasingly useful for brands that need to understand what consumers can actually see and purchase in different locations. Product Data Scrape can help transform these changing marketplace observations into organized datasets suitable for ongoing analysis.
Conclusion
The rapid expansion of Flipkart Minutes demonstrates how quickly India's quick-commerce landscape can change. From its August 2024 launch to more than 1,000 micro-fulfilment centers by June 2026 and nearly 1,200 across 150+ cities by September 2026, the platform has developed a significantly larger geographic and operational footprint.
The Flipkart Minutes Daily Monitoring Report 2026 framework provides a structured way to examine product assortment, SKU availability, prices, discounts, inventory signals, delivery coverage, and regional differences through recurring observations.
For businesses conducting grocery, FMCG, retail, and quick-commerce research, Scrape Top Grocery SKUs from Flipkart Minutes can help create structured product datasets for competitive analysis, assortment planning, pricing intelligence, and inventory monitoring.
Start your Flipkart Minutes data monitoring project with Product Data Scrape and turn daily quick-commerce changes into structured, actionable retail intelligence!


 Singapore
 EMAIL
 PHONE











.webp)