Introduction
Can Global Quick Commerce Data Help Retailers Make Better Decisions? Yes. Retailers, brands, and marketplaces can improve pricing, inventory planning, promotions, and customer experience using Global Q-Commerce Data Scraping. Real-time marketplace intelligence reveals changing demand, competitor pricing, delivery performance, and product availability, enabling businesses to make faster and more profitable retail decisions.
Industry Insight: According to industry estimates, the global quick commerce market is expected to surpass USD 350 billion by 2026, driven by rapid urbanization, instant delivery services, and increasing mobile commerce adoption. Businesses leveraging marketplace intelligence consistently outperform competitors in pricing accuracy and inventory optimization.
Quick commerce has transformed how consumers purchase groceries, personal care products, household essentials, and daily necessities. Customers now expect deliveries within minutes rather than days, forcing retailers to optimize pricing, inventory, promotions, and fulfillment continuously. As competition intensifies across markets, data-driven decisions have become essential for maintaining profitability and customer satisfaction.
Global Q-Commerce Data Scraping enables businesses to collect real-time information from leading quick commerce platforms across multiple countries. Retailers gain visibility into pricing changes, inventory availability, product assortment, delivery timelines, promotional campaigns, and consumer purchasing trends. Combined with Quick Commerce intelligence, these insights help brands react faster to market dynamics, optimize product positioning, and improve digital shelf performance.
For FMCG brands, grocery chains, distributors, manufacturers, and market intelligence teams, continuous monitoring of quick commerce marketplaces supports smarter pricing strategies, improved assortment planning, and better forecasting. Instead of relying on historical reports, businesses can use live marketplace data to identify opportunities, benchmark competitors, and respond to evolving consumer demand with confidence.
Why Is Real-Time Marketplace Visibility Critical?
Modern consumers compare products across several delivery apps before making purchases. They evaluate:
- Product prices
- Delivery availability
- Discounts
- Product assortment
- Customer ratings
- Delivery speed
- Brand visibility
- Stock availability
Businesses that monitor these factors continuously gain significant competitive advantages.
What Business Functions Benefit from Marketplace Intelligence?
Real-time marketplace analytics support multiple teams across an organization.
| Business Function |
Primary Benefit |
| Pricing Teams |
Competitive pricing optimization |
| Marketing |
Promotion effectiveness |
| Merchandising |
Product assortment planning |
| Supply Chain |
Inventory forecasting |
| Sales |
Market opportunity identification |
| Executive Leadership |
Strategic decision-making |
How Has Global Quick Commerce Expanded?
Between 2020 and 2026, quick commerce platforms expanded rapidly across Asia, Europe, North America, and the Middle East.
Global Quick Commerce Market Growth (2020–2026)
| Year |
Estimated Market Size (USD Billion) |
Countries with Active Q-Commerce |
Annual Growth |
| 2020 |
52 |
18 |
24% |
| 2021 |
83 |
27 |
31% |
| 2022 |
126 |
38 |
34% |
| 2023 |
182 |
49 |
37% |
| 2024 |
238 |
58 |
31% |
| 2025* |
296 |
66 |
24% |
| 2026* |
354 |
73 |
20% |
*Projected industry estimates.
These figures demonstrate why marketplace intelligence has become essential for global retail growth.
How Can Retailers Improve Decision Making?
Businesses using marketplace analytics can:
- Monitor competitor prices daily.
- Track inventory availability.
- Analyze promotional campaigns.
- Compare product assortment.
- Measure delivery performance.
- Improve customer satisfaction.
- Forecast regional demand.
- Optimize category performance.
Continuous monitoring allows businesses to respond before competitors rather than after market conditions change.
How Can Businesses Scale Across International Markets?
Expanding into multiple countries requires accurate visibility into regional pricing, consumer preferences, and marketplace competition. Every country has unique buying behaviors, product assortments, pricing strategies, and promotional calendars. Without centralized intelligence, businesses often struggle to maintain consistent pricing and merchandising strategies across regions.
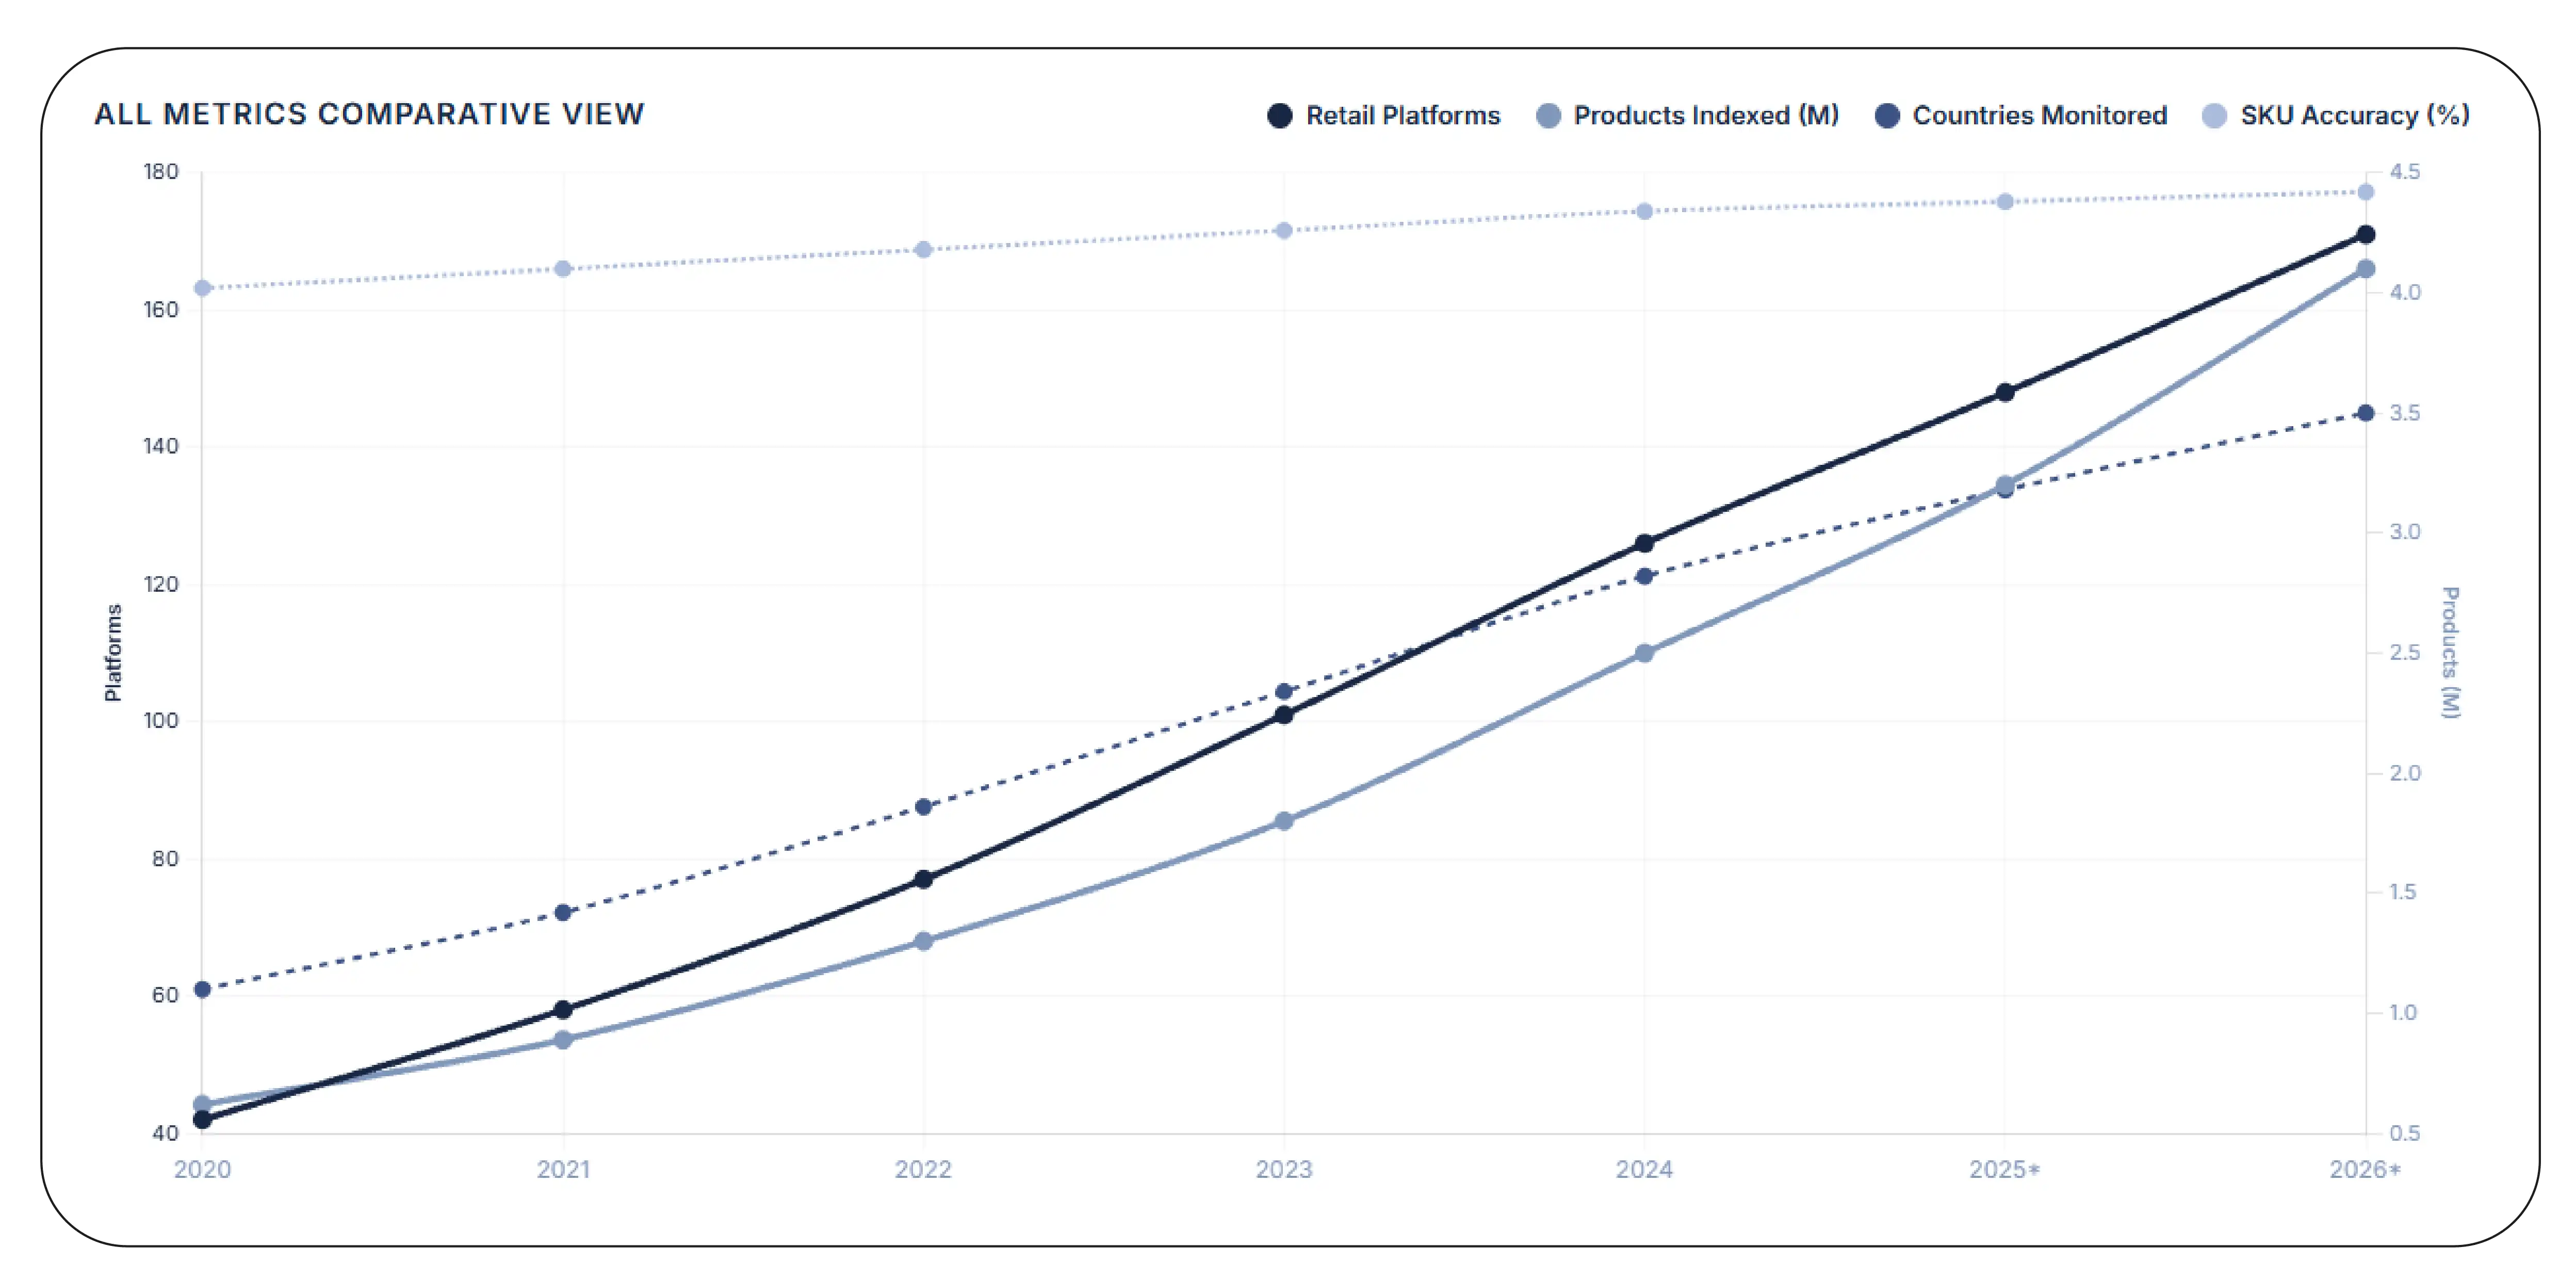
Leveraging Quick Commerce Catalog Scraping Across Multiple Countries allows brands to collect standardized product information from numerous quick commerce platforms simultaneously. Businesses can compare SKU availability, packaging variations, pricing structures, product descriptions, category placement, and promotional offers across international markets. These insights simplify cross-border expansion while improving pricing consistency and assortment planning.
Global catalog intelligence also supports product launch strategies. Businesses can identify which products succeed in mature markets before introducing them into emerging regions. Marketing teams gain visibility into localized merchandising practices, while category managers benchmark assortment gaps against competitors. Real-time monitoring reduces manual research, improves forecasting accuracy, and enables faster decision-making across international operations.
Global Catalog Intelligence Trends (2020–2026)
| Year |
Countries Monitored |
Products Indexed |
SKU Accuracy |
Retail Platforms |
| 2020 |
15 |
620K |
88% |
42 |
| 2021 |
23 |
890K |
90% |
58 |
| 2022 |
34 |
1.3M |
92% |
77 |
| 2023 |
46 |
1.8M |
94% |
101 |
| 2024 |
58 |
2.5M |
96% |
126 |
| 2025* |
67 |
3.2M |
97% |
148 |
| 2026* |
75 |
4.1M |
98% |
171 |
Key Business Benefits
- Compare international product catalogs.
- Standardize assortment planning.
- Monitor regional pricing strategies.
- Benchmark marketplace competition.
- Identify expansion opportunities.
- Improve launch planning across countries.
How Do Pricing and Retail Media Shape Consumer Decisions?
Consumers are increasingly influenced by dynamic pricing, sponsored product placements, and targeted retail media campaigns on quick commerce platforms. Small changes in pricing or advertisement visibility can significantly impact click-through rates, conversions, and repeat purchases. Businesses therefore require continuous monitoring to understand how competitors position products throughout the day.
Using Global Dark Store Price Monitoring together with Retail media and ad intelligence, brands can monitor pricing changes, sponsored listings, promotional banners, featured products, and advertising performance across multiple delivery platforms. These insights reveal how retailers adjust prices during peak demand, optimize promotional budgets, and increase product visibility.
Dark store analytics also help businesses understand inventory movement and fulfillment efficiency. By monitoring pricing alongside promotional activity, retailers can determine whether sales growth results from discounts, advertising investment, or improved assortment strategies. Marketing teams can benchmark campaign effectiveness, while pricing analysts identify opportunities to maximize margins without sacrificing competitiveness.
Pricing & Retail Media Trends (2020–2026)
| Year |
Avg. Daily Price Updates |
Sponsored Listings |
Promotion Frequency |
Ad Engagement |
| 2020 |
6 |
12% |
18% |
24% |
| 2021 |
8 |
16% |
22% |
29% |
| 2022 |
11 |
21% |
27% |
35% |
| 2023 |
14 |
26% |
33% |
41% |
| 2024 |
17 |
31% |
39% |
47% |
| 2025* |
20 |
36% |
44% |
52% |
| 2026* |
23 |
41% |
50% |
58% |
Key Takeaways
- Dynamic pricing influences purchasing behavior.
- Sponsored products improve marketplace visibility.
- Promotional campaigns increase conversion rates.
- Retail media spending continues growing globally.
- Continuous monitoring improves pricing accuracy.
- Real-time intelligence supports stronger competitive positioning.
How Can Businesses Stay Ahead of Global Quick Commerce Competition?
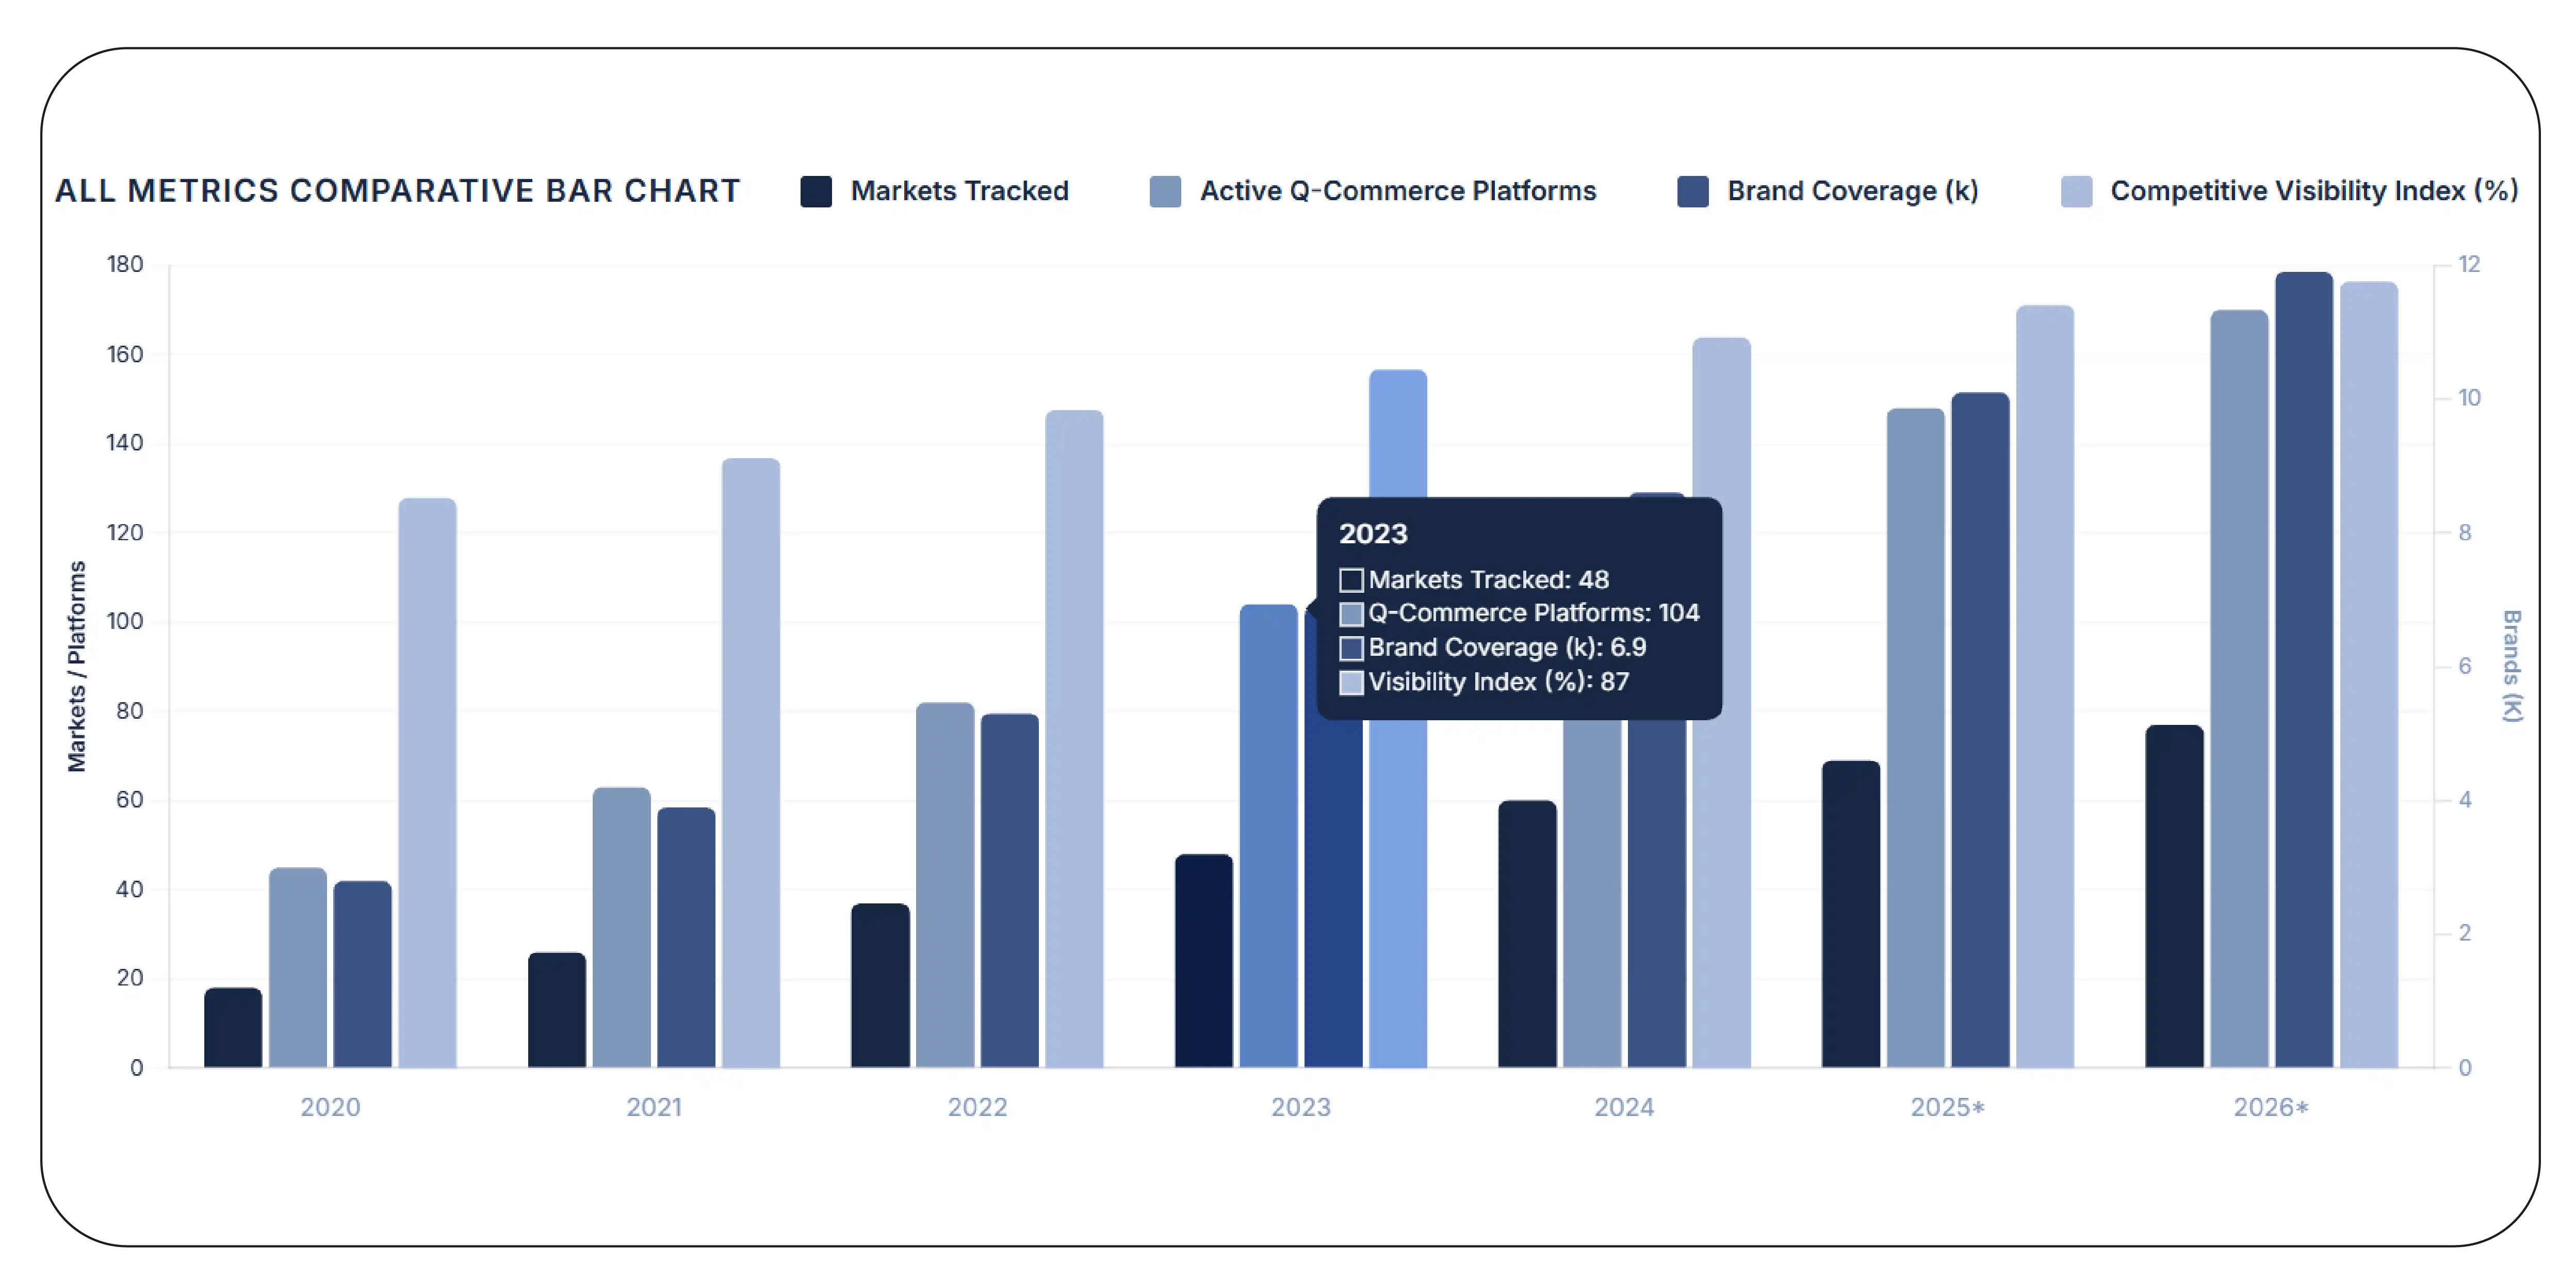
The global quick commerce ecosystem changes every hour. New competitors enter the market, product prices fluctuate, delivery promises improve, and consumer preferences evolve rapidly. Brands that rely on historical reports often miss critical market opportunities. Real-time intelligence helps businesses anticipate changes instead of reacting after they occur.
Using Worldwide Quick Commerce Market Intelligence, organizations can monitor competitor strategies, pricing behavior, assortment expansion, promotional campaigns, and regional demand patterns across multiple countries. This intelligence enables retailers, FMCG manufacturers, distributors, and category managers to benchmark performance against leading quick commerce platforms while identifying untapped growth opportunities.
Market intelligence also supports strategic planning. Businesses can compare category growth, evaluate regional expansion trends, identify high-performing brands, and monitor consumer purchasing behavior across diverse geographic markets. Decision-makers gain a comprehensive view of marketplace dynamics that supports pricing optimization, inventory forecasting, and targeted promotional campaigns. Rather than making assumptions, organizations rely on accurate marketplace data to improve operational efficiency and increase profitability.
Worldwide Market Intelligence Trends (2020–2026)
| Year |
Markets Tracked |
Active Q-Commerce Platforms |
Brand Coverage |
Competitive Visibility Index |
| 2020 |
18 |
45 |
2,800 |
71 |
| 2021 |
26 |
63 |
3,900 |
76 |
| 2022 |
37 |
82 |
5,300 |
82 |
| 2023 |
48 |
104 |
6,900 |
87 |
| 2024 |
60 |
127 |
8,600 |
91 |
| 2025* |
69 |
148 |
10,100 |
95 |
| 2026* |
77 |
170 |
11,900 |
98 |
*Projected industry estimates.
Why Market Intelligence Matters
- Benchmark global competitors.
- Identify emerging retail trends.
- Monitor assortment expansion.
- Improve pricing strategies.
- Forecast regional demand accurately.
- Support international growth planning.
- Optimize promotional investments.
- Enhance category management decisions.
Continuous market intelligence allows businesses to adapt quickly, improve decision-making, and maintain a competitive advantage in rapidly evolving quick commerce markets.
Why Should Retailers Analyze Hyperlocal Consumer Trends?
Consumer demand varies significantly across neighborhoods, cities, and regions. Product availability, purchasing behavior, delivery expectations, and pricing strategies differ based on local market conditions. Retailers that understand these variations can create highly targeted strategies that improve customer satisfaction and operational efficiency.
Leveraging Global Hyperlocal Commerce Analytics alongside Price monitoring enables businesses to evaluate local pricing patterns, product availability, promotional effectiveness, and inventory movement across thousands of delivery zones. Hyperlocal analytics reveal which products perform best in specific locations, how competitors adjust prices throughout the day, and where inventory shortages may occur.
These insights help retailers optimize assortment planning, improve replenishment schedules, and implement localized promotional campaigns. Pricing teams benefit from neighborhood-level intelligence, while marketing teams gain visibility into regional purchasing trends and consumer preferences. Hyperlocal data also supports demand forecasting by identifying recurring buying patterns during weekends, holidays, and seasonal events. Businesses using localized analytics consistently improve fulfillment performance while increasing customer loyalty and profitability.
Hyperlocal Commerce Performance (2020–2026)
| Year |
Delivery Zones Analyzed |
Local Price Changes/Day |
Inventory Accuracy |
Local Promotion Success |
| 2020 |
2,400 |
5 |
84% |
62% |
| 2021 |
3,300 |
7 |
87% |
67% |
| 2022 |
4,600 |
10 |
90% |
72% |
| 2023 |
6,100 |
13 |
93% |
78% |
| 2024 |
7,800 |
16 |
95% |
83% |
| 2025* |
9,600 |
19 |
97% |
88% |
| 2026* |
11,500 |
22 |
98% |
92% |
*Projected industry estimates.
Benefits of Hyperlocal Analytics
- Monitor neighborhood-level pricing trends.
- Detect inventory shortages early.
- Optimize local promotional campaigns.
- Improve demand forecasting accuracy.
- Benchmark regional competitors.
- Strengthen customer satisfaction.
- Reduce fulfillment inefficiencies.
- Increase profitability through localized decision-making.
By combining hyperlocal intelligence with real-time marketplace analytics, businesses can respond to regional demand shifts faster and build stronger competitive positioning across global quick commerce markets.
How Can Retailers Benchmark Grocery App Pricing Across Markets?
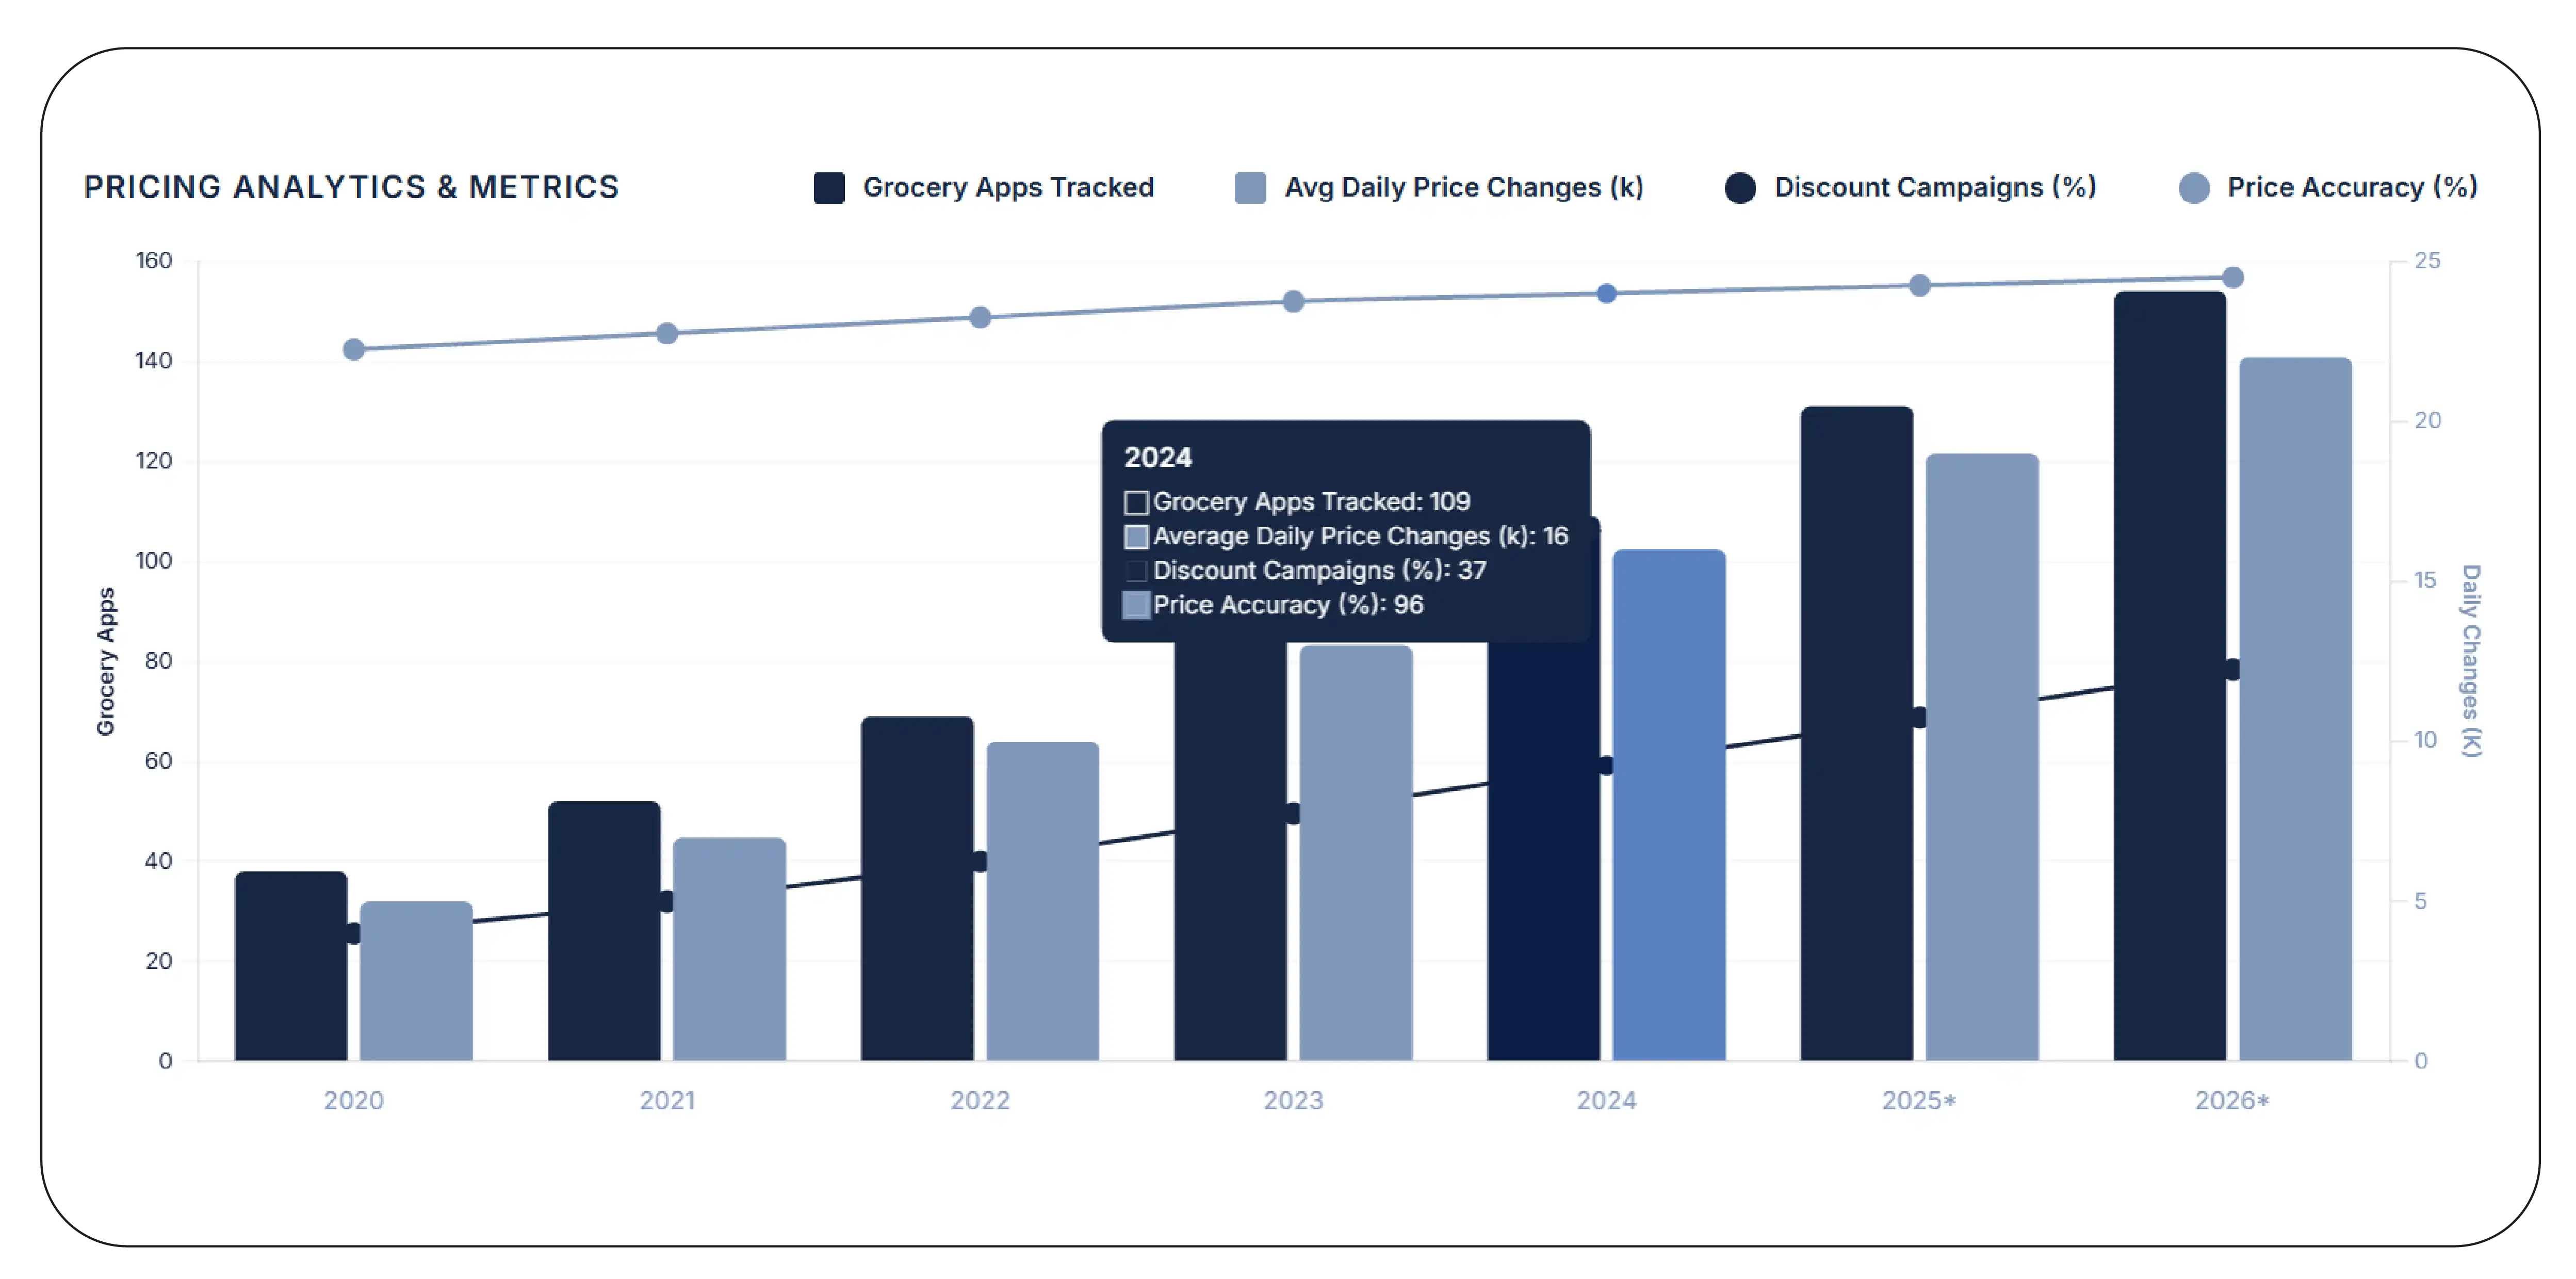
Grocery apps have become one of the strongest growth drivers in global quick commerce. Consumers frequently compare prices, promotions, delivery fees, and product availability before placing an order. Even a small pricing difference can influence purchasing decisions and brand loyalty. Retailers therefore need continuous visibility into competitor pricing across multiple grocery platforms.
By leveraging Global Retail Price Monitoring Across Grocery Apps, businesses can compare prices across countries, cities, retailers, and delivery platforms in real time. These insights help pricing teams identify underpriced or overpriced products, evaluate competitor discount strategies, and optimize promotional calendars. Continuous monitoring also reveals how frequently prices change, which categories experience the highest volatility, and where brands can improve their competitive positioning.
Retail price intelligence supports more than pricing decisions. Category managers can benchmark assortment gaps, supply chain teams can anticipate inventory demand, and marketing teams can measure the effectiveness of promotional campaigns. Combined with real-time analytics, grocery app monitoring helps organizations improve margins while maintaining competitive pricing across fast-moving markets.
Global Grocery Pricing Trends (2020–2026)
| Year |
Grocery Apps Tracked |
Average Daily Price Changes |
Discount Campaigns |
Price Accuracy |
| 2020 |
38 |
5 |
16% |
89% |
| 2021 |
52 |
7 |
20% |
91% |
| 2022 |
69 |
10 |
25% |
93% |
| 2023 |
88 |
13 |
31% |
95% |
| 2024 |
109 |
16 |
37% |
96% |
| 2025* |
131 |
19 |
43% |
97% |
| 2026* |
154 |
22 |
49% |
98% |
*Projected industry estimates.
Key Advantages
- Compare prices across global grocery apps.
- Monitor competitor discount strategies.
- Optimize promotional pricing.
- Improve category-level benchmarking.
- Detect price fluctuations instantly.
- Support data-driven merchandising decisions.
- Strengthen profitability while remaining competitive.
- Improve customer value perception.
Why Is Automated Product Data Collection Essential?
Quick commerce platforms add thousands of new products, promotions, and inventory updates every day. Manual monitoring is slow, expensive, and often inaccurate. Businesses require automated solutions that continuously collect structured marketplace data for analysis and decision-making.
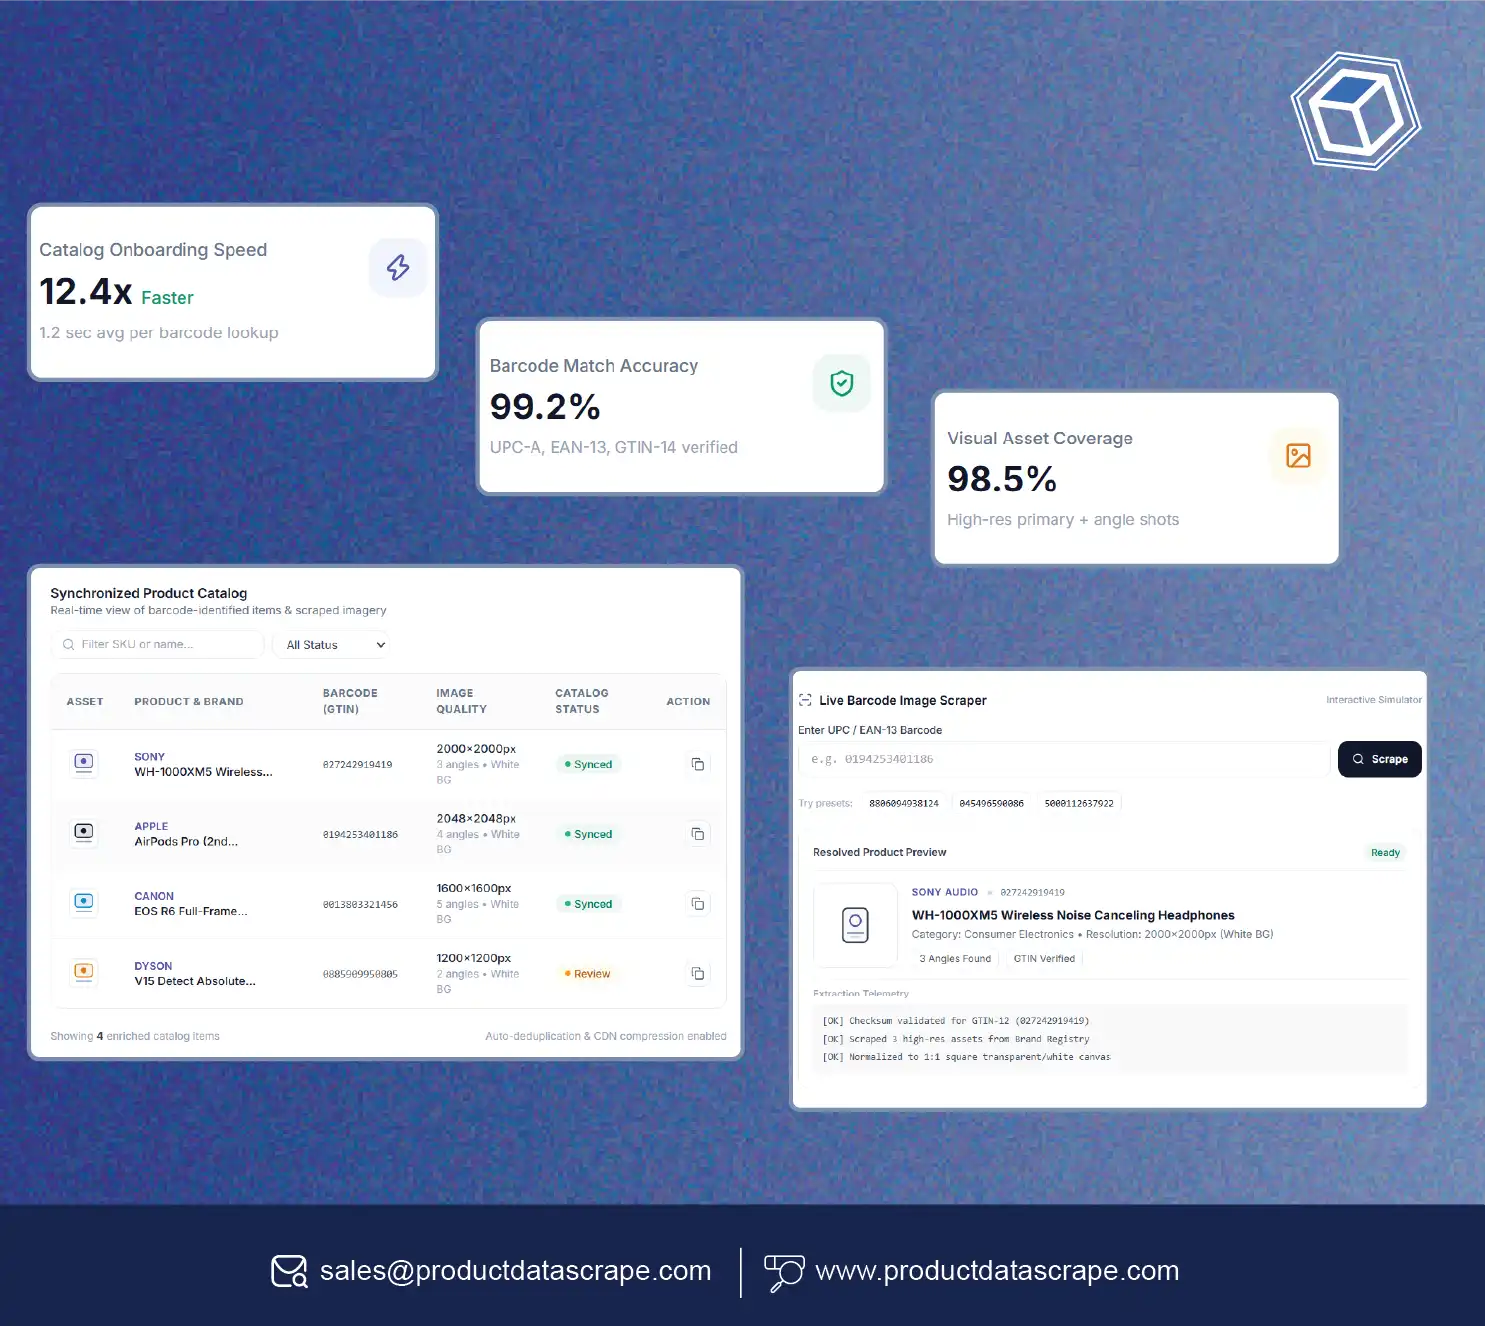
Using Worldwide Quick Commerce Product Data Extraction, organizations can capture product titles, descriptions, pricing, discounts, availability, images, brand information, SKU details, customer ratings, delivery estimates, and promotional campaigns from multiple marketplaces. Automated extraction enables businesses to build comprehensive product databases that support pricing intelligence, assortment planning, inventory optimization, and competitive benchmarking.
Product data extraction also enhances forecasting accuracy by providing historical pricing trends, seasonal demand patterns, and inventory movement across different markets. Retailers can identify fast-selling products, monitor new product launches, evaluate seller performance, and detect assortment changes before competitors. This automated approach reduces manual effort, improves data accuracy, and delivers timely insights that support faster strategic decisions.
Product Data Collection Growth (2020–2026)
| Year |
Products Extracted (Millions) |
Daily Data Updates |
Supported Countries |
Data Accuracy |
| 2020 |
28 |
420K |
18 |
90% |
| 2021 |
41 |
610K |
26 |
92% |
| 2022 |
58 |
880K |
37 |
94% |
| 2023 |
79 |
1.2M |
49 |
95% |
| 2024 |
103 |
1.7M |
61 |
97% |
| 2025* |
132 |
2.2M |
70 |
98% |
| 2026* |
168 |
2.9M |
79 |
99% |
*Projected industry estimates.
Business Outcomes
- Automate marketplace data collection.
- Track new product launches globally.
- Monitor inventory and assortment changes.
- Build centralized product intelligence databases.
- Improve pricing and promotional analysis.
- Enhance demand forecasting.
- Reduce manual research time.
- Enable faster and more informed business decisions.
As quick commerce continues expanding worldwide, automated product data extraction becomes a strategic capability for brands seeking sustainable growth and operational excellence.
Why Choose Product Data Scrape?
Businesses need reliable marketplace intelligence to compete in today's fast-moving retail environment. Product Data Scrape delivers scalable solutions for collecting and analyzing Global quick commerce data across leading instant delivery platforms worldwide. Combined with advanced Global Q-Commerce Data Scraping capabilities, our services provide real-time pricing, product availability, promotions, catalog updates, and competitive insights. We help brands, retailers, FMCG companies, and market researchers improve pricing strategies, optimize assortments, monitor competitors, and make data-driven decisions that accelerate growth across global quick commerce markets with accurate, timely, and actionable intelligence.
Conclusion
Success in global quick commerce depends on accurate, real-time marketplace intelligence. Leveraging Hyperlocal pricing intelligence together with Global Q-Commerce Data Scraping enables businesses to optimize pricing, monitor competitors, improve inventory planning, and respond quickly to changing consumer demand. Organizations that invest in continuous data monitoring gain stronger digital shelf visibility, better forecasting accuracy, and sustainable competitive advantages across international markets.
Ready to transform your quick commerce strategy? Partner with Product Data Scrape to unlock actionable marketplace intelligence, optimize retail performance, and drive smarter business decisions with real-time global data insights!
FAQs
1. Why is quick commerce data important for retailers?
Quick commerce data provides real-time insights into pricing, inventory, promotions, product availability, and customer demand, helping retailers make faster decisions, improve competitiveness, and optimize operational efficiency.
2. Which industries benefit most from quick commerce analytics?
FMCG brands, grocery retailers, pharmaceutical companies, consumer goods manufacturers, e-commerce businesses, distributors, and market research firms benefit from marketplace intelligence for pricing, assortment, and competitor monitoring.
3. How frequently should marketplace data be updated?
High-performing businesses update marketplace data multiple times daily to capture pricing changes, stock availability, promotions, and assortment modifications as they happen across delivery platforms.
4. Can businesses monitor multiple countries simultaneously?
Yes. Global marketplace intelligence enables organizations to compare pricing, product catalogs, promotions, and inventory across numerous countries, helping standardize strategies while identifying regional growth opportunities.
5. How does Product Data Scrape support global quick commerce analytics?
Product Data Scrape provides automated data collection, real-time marketplace monitoring, competitive intelligence, pricing analysis, and customized reporting that helps businesses make accurate, data-driven retail decisions across global quick commerce platforms.


 Singapore
 EMAIL
 PHONE











.webp)