Introduction
The automotive e-commerce ecosystem is becoming increasingly data-driven as consumers compare tyre specifications, auto parts, prices, discounts, availability, ratings, and seller information before making purchasing decisions. For retailers, manufacturers, distributors, and automotive brands, marketplace data provides an important view of changing assortment strategies and customer-facing pricing.
This research report examines Lazada vs Tuhu Tyres & Auto Parts and evaluates how structured marketplace information can support competitive analysis across tyres and automotive products. Lazada operates as a major Southeast Asian e-commerce marketplace, while Tuhu has developed a large digitally enabled automotive-service ecosystem in China. Tuhu reported more than 150 million registered users and 26.5 million transacting users for the 12 months ended June 30, 2025, alongside 7,205 workshops. (Tuhu)
The research also examines E-Commerce Data 2026 through the lens of product assortment, price movements, inventory signals, tyre sizes, SKU coverage, and competitive benchmarking. Tuhu's 2025 annual report shows automotive products and services revenue of RMB15.4 billion, while its tires and chassis parts and auto-maintenance segment increased 12% year over year to RMB12.9 billion. (HKEX News)
For organizations seeking repeatable data collection, a Lazada Scraping API can support automated retrieval of structured marketplace information for monitoring, normalization, comparison, and downstream analytics.
Mapping Product and Marketplace Coverage
Comparing two automotive-focused digital commerce environments requires more than collecting product names and prices. Lazada and Tuhu Auto Parts Data Scraping enables businesses to capture product titles, brands, categories, specifications, tyre dimensions, SKU identifiers, sellers, ratings, discounts, stock status, delivery information, and product URLs where available. A structured dataset built from these attributes can support accurate product comparisons, competitive pricing analysis, assortment monitoring, and broader automotive e-commerce intelligence.
Lazada's marketplace model can expose a broad assortment across multiple countries and seller ecosystems, while Tuhu combines digital commerce with an extensive automotive-service network. This means the two datasets can have different product structures and commercial signals. Tuhu's 2025 reporting indicates that revenue from sales of auto parts through Qipeilong reached RMB1.4966 billion, up 6.3% from 2024. (HKEX News)
| Data Indicator |
Lazada |
Tuhu |
| Marketplace/service model |
Multi-category e-commerce |
Automotive-focused online/offline ecosystem |
| Key automotive data |
Tyres, parts, accessories |
Tyres, chassis parts, maintenance, auto parts |
| 2025 reported user indicator |
Multi-market marketplace |
150M+ registered users as of Jun. 2025 |
| Tuhu workshops |
N/A |
7,205 as of Jun. 2025 |
| Tuhu auto-parts sales via Qipeilong |
N/A |
RMB 1.4966B in 2025 |
2020–2026 Market Development
From 2020 onward, automotive e-commerce increasingly shifted from static catalog publishing toward continuously updated product intelligence. During 2020–2021, businesses relied heavily on marketplace listings and manual price checks, but growing SKU volumes made spreadsheet-based monitoring increasingly difficult. Between 2022 and 2023, structured collection became more important as retailers expanded digital catalogs and customers became more comfortable comparing automotive products online. During 2024–2025, automotive platforms increasingly connected digital product discovery with fulfillment, service networks, and customer engagement. Tuhu's disclosed network of 7,205 workshops across more than 300 prefecture-level cities illustrates the scale of this integrated model. (Tuhu) In 2026, businesses can use recurring collection workflows to create comparable datasets across marketplaces, categories, and product specifications. The emphasis is moving toward SKU-level visibility rather than simple page-level extraction. Historical snapshots can also reveal when products entered or exited a marketplace, how frequently prices changed, and whether assortment expanded or contracted. For automotive businesses, this creates a foundation for competitor monitoring, supplier research, assortment planning, and pricing analysis. A standardized schema is particularly important because tyre and auto-part attributes vary significantly between sellers and platforms.
Understanding Pricing Dynamics and Category Movement
Pricing is one of the most important variables in online automotive commerce. Auto Parts Market Trend Analysis helps businesses understand pricing patterns while comparing products accurately by brand, model, specification, size, pack configuration, and other identifiers. A lower displayed price may reflect a discount, promotional campaign, different specification, or different seller rather than a genuine price advantage.
A structured Price scraping workflow can capture regular prices, promotional prices, discount percentages, shipping charges where available, seller information, and timestamps. This creates historical records that can be used to identify price volatility and promotional patterns.
| Pricing Metric |
Business Use |
| Listed price |
Baseline price comparison |
| Discounted price |
Promotion analysis |
| Discount percentage |
Campaign measurement |
| Seller price |
Seller-level benchmarking |
| Price history |
Trend and volatility analysis |
| Availability |
Price-versus-stock analysis |
2020–2026 Market Development
Between 2020 and 2022, online automotive pricing was influenced by rapid changes in consumer purchasing behavior, supply-chain conditions, and marketplace expansion. E-commerce data scraping became increasingly valuable as brands needed historical price records rather than isolated observations, especially by 2023, when competitor prices could change several times during a campaign. In 2024 and 2025, automated monitoring became more relevant for organizations managing large catalogs across multiple sellers and regions. Tuhu's 2025 results show that its tires and chassis parts and auto-maintenance revenue increased from RMB11.6 billion in 2024 to RMB12.9 billion in 2025, a 12.0% increase. The company attributed this partly to product diversification, marketing refinement, and network expansion. (HKEX News) The 2026 environment therefore calls for more granular pricing datasets that distinguish regular prices from promotions and product-level changes. Businesses can compare the same tyre model across sellers, identify recurring promotional windows, calculate average observed prices, and monitor changes in competitive positioning. Historical price data also helps separate temporary discounts from sustained pricing changes. When combined with availability and seller information, price observations become more actionable because businesses can evaluate whether a low-priced listing is consistently available or represents a temporary promotional event.
Comparing Tyre Specifications and Customer-Facing Prices
Tyre comparison requires a specification-driven approach. Tyre Size Price Comparison Across Lazada and Tuhu helps businesses evaluate dimensions such as width, aspect ratio, rim diameter, load index, speed rating, seasonality, construction, and brand, all of which can materially affect price. Comparing only product titles can therefore produce inaccurate results.
A structured dataset can normalize tyre specifications and map equivalent or closely comparable products across platforms. This enables businesses to examine price ranges by size, brand, product family, and specification.
| Comparison Attribute |
Example Data Point |
Analytical Purpose |
| Tyre width |
205 mm |
Size-based comparison |
| Aspect ratio |
55 |
Specification matching |
| Rim diameter |
16 inches |
Product grouping |
| Brand |
Brand-level |
Competitive analysis |
| Listed price |
Marketplace price |
Benchmarking |
| Discount |
Promotional percentage |
Promotion analysis |
| Rating |
Customer rating |
Product-quality signal |
2020–2026 Market Development
The 2020–2021 period saw increasing consumer adoption of online product research, including comparison of automotive specifications before purchasing. During 2022–2023, larger digital catalogs made standardized attribute extraction more important because similar products were frequently represented using different naming conventions. By 2024, businesses increasingly required normalized datasets capable of comparing products using technical specifications rather than product titles alone. In 2025, Tuhu's reported tires and chassis parts and auto-maintenance revenue reached RMB12.9 billion, reflecting the scale of demand moving through its broader automotive ecosystem. (HKEX News) In 2026, tyre comparison can be strengthened by combining technical attributes with price, seller, availability, discount, and rating data. For example, a business could group all 205/55 R16 products and then compare observed prices by brand and platform. Similar workflows can be applied to commercial tyres, performance tyres, seasonal products, batteries, filters, brake components, and other automotive categories. Historical datasets further allow businesses to determine whether specific tyre sizes experience recurring price changes or whether certain product categories show greater promotional activity. This type of structured comparison reduces the risk of comparing non-equivalent products and gives pricing teams a more reliable basis for marketplace analysis.
Tracking Product Availability and Assortment Changes
Inventory visibility is another important component of marketplace intelligence. Lazada Tuhu Auto Parts Inventory Monitoring helps automotive businesses understand whether products are available, temporarily unavailable, discontinued, newly listed, or offered by multiple sellers. This visibility supports better assortment planning, competitor monitoring, and inventory-related decision-making.
Automated monitoring can record stock indicators, seller changes, product availability, listing status, and assortment changes at defined intervals. These observations can help businesses identify potential supply gaps and understand how marketplace catalogs evolve.
| Inventory Signal |
Possible Business Insight |
| In stock |
Active product availability |
| Out of stock |
Potential supply gap |
| New listing |
Assortment expansion |
| Removed listing |
Potential catalog contraction |
| Multiple sellers |
Marketplace competition |
| Availability change |
Inventory movement |
2020–2026 Market Development
From 2020 to 2022, inventory disruptions highlighted the importance of visibility across digital sales channels. Automotive businesses increasingly needed to know not only what competitors were selling but whether those products were actually available. Between 2023 and 2024, monitoring expanded from individual products to entire categories and SKU groups. In 2025, Tuhu's operating model demonstrated the importance of connecting digital demand with a broad physical service network. Its company overview reported 7,205 workshops as of June 30, 2025, covering more than 300 prefecture-level cities and around 1,800 county-level regions. (Tuhu) The 2026 environment places greater emphasis on recurring inventory observation because automotive catalogs can change quickly. A historical dataset can identify products that repeatedly go out of stock, newly introduced SKUs, disappearing listings, and changes in seller participation. For retailers, this information can support procurement and assortment decisions. For manufacturers, it can reveal where products are available and where competitive listings are expanding. Inventory monitoring becomes particularly useful when combined with price monitoring because businesses can determine whether price increases coincide with reduced availability or whether aggressive discounts occur alongside high stock visibility.
Creating Comparable Competitive Pricing Measures
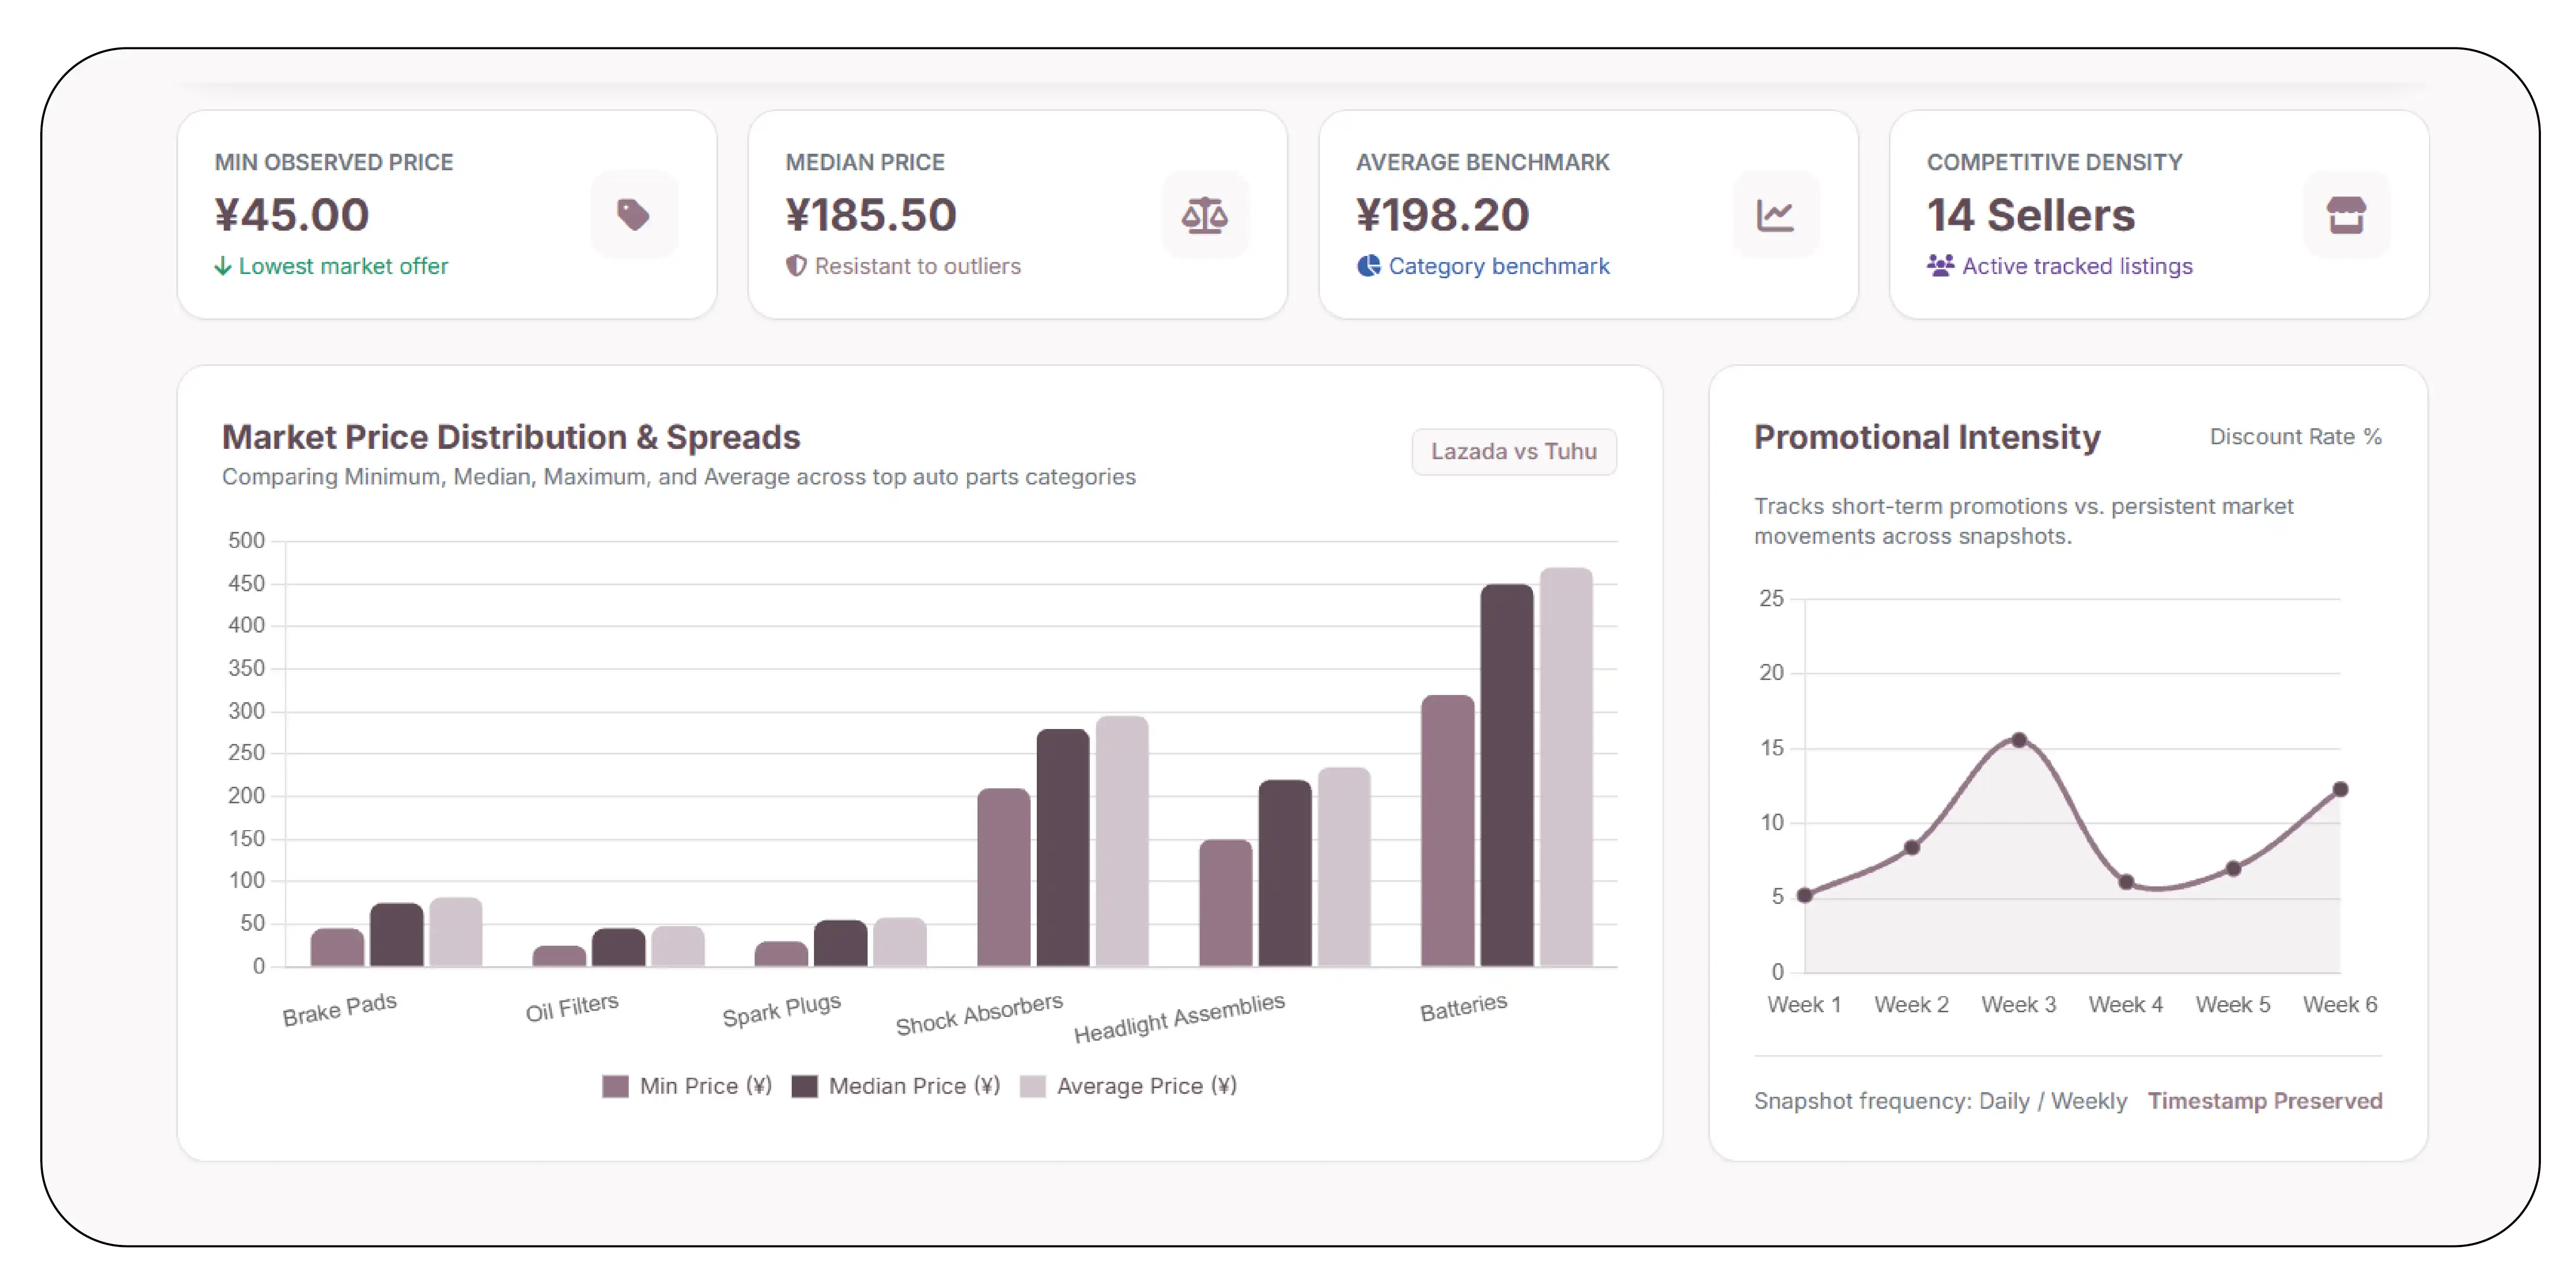
Price benchmarking becomes more meaningful when products are matched according to comparable attributes. Auto Parts Price Benchmarking Across Lazada and Tuhu enables businesses to build accurate product-level and category-level benchmarks instead of relying solely on an entire marketplace's average price. This approach provides clearer insights into competitive pricing and market positioning.
A benchmarking dataset may include minimum observed price, maximum observed price, median price, average price, discount rate, seller count, and availability. These metrics can be calculated over daily, weekly, or monthly snapshots.
| Benchmark Metric |
Application |
| Minimum price |
Identifies lowest observed offer |
| Maximum price |
Defines market price ceiling |
| Median price |
Reduces impact of extreme values |
| Average price |
Category-level benchmark |
| Seller count |
Measures competitive density |
| Discount rate |
Tracks promotional intensity |
2020–2026 Market Development
During 2020–2021, many automotive businesses relied on manual competitor checks that provided only limited snapshots. As digital catalogs grew, this approach became increasingly difficult to scale. Between 2022 and 2023, automated collection enabled businesses to move toward scheduled price comparisons. In 2024 and 2025, historical datasets became more valuable because pricing teams could distinguish isolated promotions from persistent market movements. Tuhu's 2025 annual report provides a useful business-scale reference: automotive products and services revenue increased 11.5% year over year to RMB15.4 billion, while revenue from auto-parts sales through Qipeilong increased 6.3% to RMB1.4966 billion. (HKEX News) In 2026, benchmarking can be expanded beyond simple price comparisons by incorporating product specifications, sellers, discounts, stock status, and customer-facing signals. Businesses can calculate price gaps between comparable listings and observe how those gaps change over time. This can support pricing teams when evaluating market positioning, promotional timing, and assortment strategies. A reliable benchmark should also preserve timestamps because marketplace prices are dynamic. Without historical context, a single price observation may provide limited insight into whether a competitor is consistently cheaper or simply running a short-term promotion.
Turning Marketplace Records into Business Intelligence
The value of automotive marketplace information increases when raw listings are transformed into structured, validated, and analytics-ready Auto parts data. Product-level records can be organized by category, brand, SKU, specification, seller, price, discount, availability, rating, and other accessible attributes. This structured approach helps businesses conduct product analysis, competitive benchmarking, pricing research, and marketplace intelligence more efficiently.
| Dataset Layer |
Example Information |
Business Application |
| Product |
Name, SKU, brand |
Catalog intelligence |
| Specification |
Size, model, technical attributes |
Product matching |
| Pricing |
Regular and promotional price |
Pricing analysis |
| Seller |
Seller name and offer |
Seller intelligence |
| Availability |
Stock/listing status |
Inventory monitoring |
| Customer signals |
Ratings/reviews |
Product analysis |
2020–2026 Market Development
The evolution from 2020 to 2026 demonstrates a broader shift from isolated web data collection toward structured competitive intelligence. In the early period, businesses often collected product pages manually or maintained limited spreadsheets. By 2022–2023, recurring automated collection became increasingly useful as marketplace catalogs expanded. From 2024 onward, businesses increasingly connected product datasets with dashboards, analytics environments, pricing systems, and internal databases. Tuhu's scale provides an example of how automotive commerce can operate as part of a wider digital ecosystem: as of June 2025, the company reported 26.5 million transacting users during the preceding 12 months and more than 150 million registered users. (Tuhu) Its 2025 annual report also recorded RMB15.4 billion in automotive products and services revenue. (HKEX News) By 2026, structured marketplace datasets can support a wider range of applications, including assortment analysis, competitor research, SKU matching, pricing intelligence, seller monitoring, inventory analysis, and market trend research. The key is consistency: the same fields should be captured repeatedly so that changes can be measured over time. When Lazada and Tuhu records are standardized into a common schema, businesses can create cross-platform comparisons while preserving platform-specific attributes.
Why Choose Product Data Scrape?
Product Data Scrape helps businesses convert complex online marketplace information into structured datasets designed for analysis and recurring monitoring. Automotive catalogs can contain thousands or millions of product records, making manual collection difficult to maintain.
With Extract Lazada Product Data, businesses can collect relevant product attributes and organize them into structured datasets for pricing, assortment, seller, and catalog analysis.
The workflow can include product discovery, data extraction, normalization, validation, deduplication, field mapping, and scheduled delivery. Depending on the project requirements, datasets can be structured around SKUs, categories, brands, specifications, prices, discounts, seller information, availability, ratings, and other accessible fields.
Product Data Scrape can also support recurring collection so businesses can move beyond one-time research. Historical snapshots make it possible to track product additions, removals, pricing changes, seller movements, and availability changes.
For automotive brands and retailers, this approach can help create an analytics-ready foundation for competitive intelligence, marketplace monitoring, assortment planning, and pricing research.
Conclusion
The comparison of Lazada and Tuhu demonstrates why structured marketplace intelligence is becoming increasingly important for automotive businesses. Differences in marketplace structure, product assortment, seller participation, pricing, availability, and automotive-service integration make standardized data collection essential for meaningful comparisons.
A structured Lazada vs Tuhu Tyres & Auto Parts E-Commerce Data 2026 dataset can help businesses examine product coverage, tyre specifications, prices, discounts, sellers, inventory signals, and competitive changes through consistent historical records.
For organizations conducting ongoing marketplace intelligence, Monitor Lazada product catalog data through scheduled collection workflows to identify product, price, seller, and assortment changes.
Start building structured automotive marketplace intelligence with Product Data Scrape and turn dynamic Lazada and Tuhu data into actionable competitive insights!


 Singapore
 EMAIL
 PHONE












.webp)