Introduction
The Talabat vs Noonfood vs Lulu API Report 2026 examines how structured product and pricing data can help businesses compare UAE quick-commerce platforms, monitor assortment changes, identify price differences, and understand digital grocery trends. The UAE has become one of the region's most digitally mature commerce markets, with e-commerce sales reaching $3.9 billion in 2020 after a 53% increase that year.
For brands, retailers, grocery businesses, marketplace operators, and market-research teams, E-commerce data scraping in the UAE provides a way to transform online product information into structured datasets for competitive analysis.
The UAE government's digital-economy strategy aims to increase the digital economy's contribution to GDP from 9.7% in 2022 to 19.4% within ten years. This broader digital transformation creates a strong environment for data-driven retail intelligence.
Quick-commerce analysis is particularly useful because product prices, promotions, availability, pack sizes, and assortments can change frequently. Comparing structured observations over time allows businesses to identify not only what products are listed, but also how their commercial positioning changes across platforms.
What Is Driving UAE Quick-Commerce Data Intelligence in 2026?
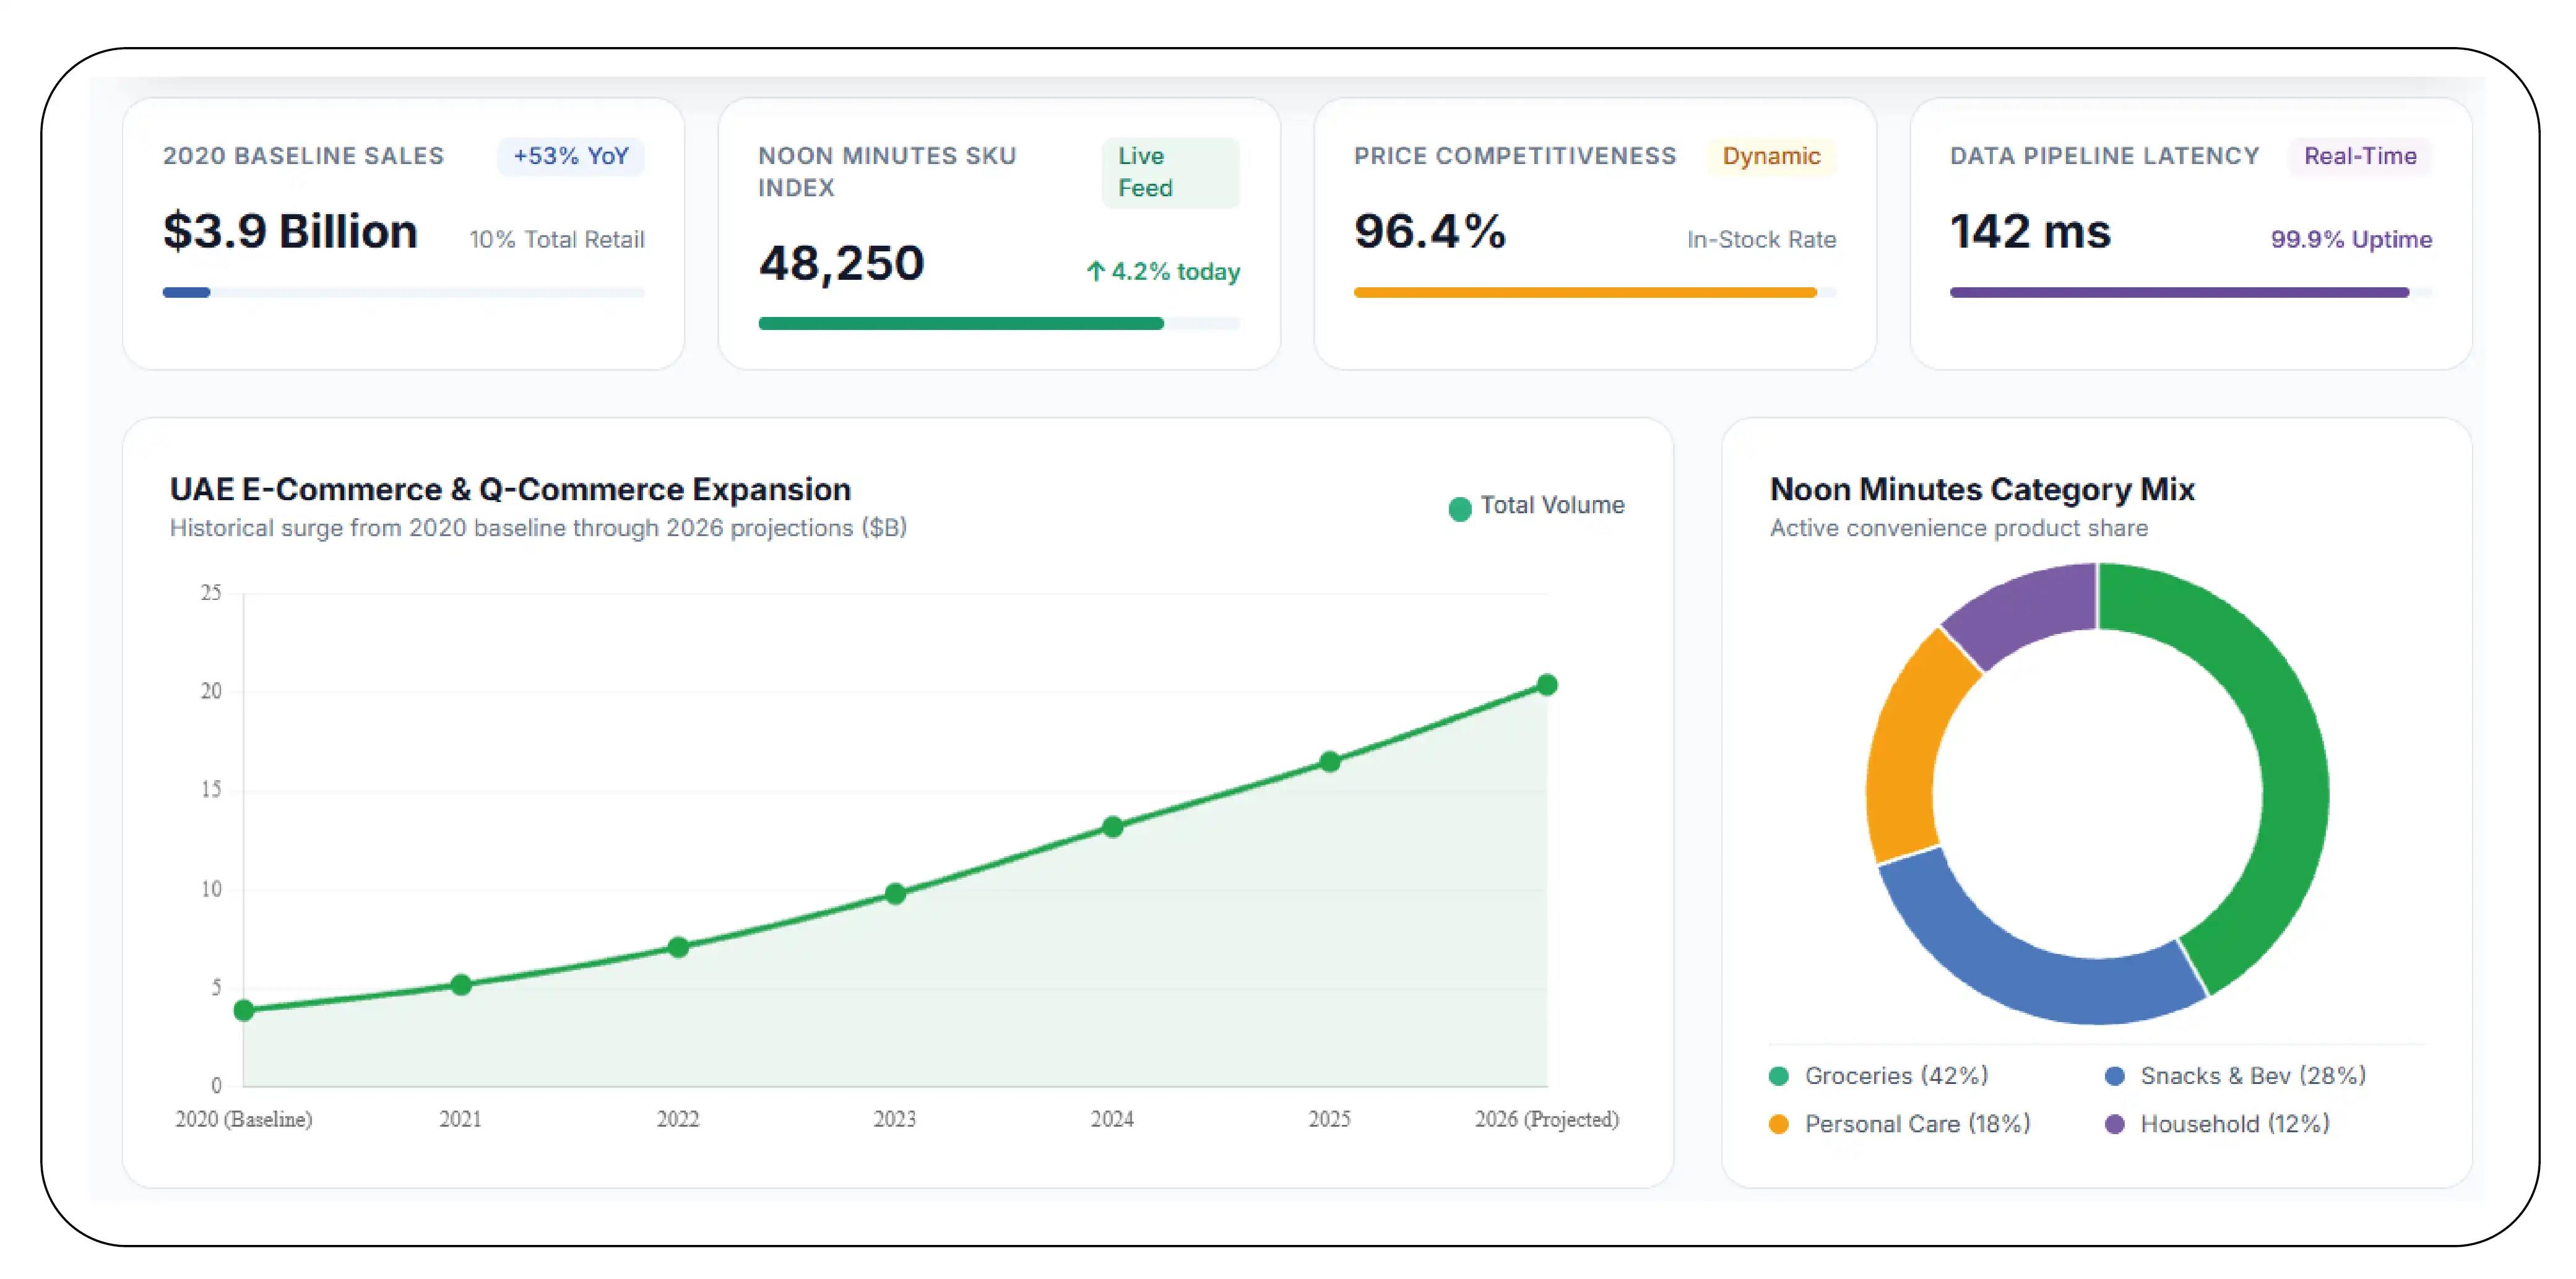
UAE Q-Commerce Data Intelligence brings together product, pricing, availability, category, promotion, retailer, and timestamp information to create a comparable market view.
One practical use case is Noon Minutes Quick Commerce Data Scraping API, where structured collection can help businesses organize online grocery and convenience-product information into a consistent dataset. The exact technical mechanism depends on permitted access methods and the applicable platform terms; an "API" in an analytics workflow can also refer to a customer's authorized data-delivery interface rather than a publicly documented platform API.
The UAE's digital commerce expansion accelerated dramatically in 2020. According to the U.S. International Trade Administration, UAE e-commerce sales reached $3.9 billion in 2020, representing 10% of total retail sales, following 53% growth during that year.
UAE digital-commerce timeline
| Year |
Market/Data Context |
Intelligence Implication |
| 2020 |
E-commerce sales reached $3.9B; 53% annual growth |
Digital grocery visibility became more important |
| 2021 |
Digital adoption remained elevated after COVID-era acceleration |
Historical benchmarks became valuable |
| 2022 |
UAE launched its Digital Economy Strategy |
Data infrastructure gained strategic importance |
| 2023 |
UAE e-commerce continued expanding across retail categories |
Product and pricing monitoring became more scalable |
| 2024 |
Digital commerce regulations and infrastructure continued evolving |
Data governance became increasingly important |
| 2025 |
UAE e-commerce forecast was approximately $8B |
Competitive monitoring gained broader commercial relevance |
| 2026 |
Digital-commerce maturity continues |
Real-time and historical intelligence can support decisions |
The 2025 $8 billion figure is a forecast cited by the U.S. International Trade Administration from the Dubai Chamber of Commerce and Industry, rather than a measured 2025 result.
For businesses building a 2026 intelligence program, the key opportunity is connecting historical data with current observations. A product that was competitively priced in 2023 may have a different relative position in 2026 because of assortment changes, inflation, promotions, private-label expansion, or competitor strategies.
How Can Businesses Measure Assortment Across UAE Quick-Commerce Platforms?
UAE Quick Commerce Assortment Intelligence focuses on understanding what products each platform offers, how deeply categories are represented, and how assortments change over time.
A basic comparison can capture product name, brand, category, subcategory, pack size, SKU, GTIN where available, price, discount, availability, product URL, retailer/platform, and collection timestamp.
This allows analysts to calculate assortment overlap and gaps.
For example, if Platform A lists 10,000 grocery SKUs in a category and Platform B lists 8,000, the important question is not simply which has more products. Analysts need to determine how many products overlap, which brands are exclusive, which pack sizes differ, and which categories have the greatest assortment gaps.
Example assortment framework
| Metric |
What It Measures |
Business Use |
| SKU count |
Listed products |
Assortment breadth |
| Brand count |
Represented brands |
Brand coverage |
| Category depth |
Products per category |
Category strength |
| Overlap rate |
Shared products |
Competitive similarity |
| Exclusive SKUs |
Platform-specific listings |
Differentiation |
| Availability rate |
In-stock products |
Shelf visibility |
| Promotion rate |
Discounted listings |
Promotional intensity |
From 2020 through 2022, the UAE's e-commerce environment was reshaped by rapid digital adoption. The country's e-commerce market increased 53% in 2020, according to the U.S. International Trade Administration.
By 2022, the UAE had launched a Digital Economy Strategy targeting an increase in the digital economy's GDP contribution from 9.7% to 19.4% over ten years.
In 2023 and 2024, online retail continued developing alongside regulatory and digital-infrastructure initiatives. The UAE's 2023 Modern Technology-Based Trade law covers online buying and selling through websites, mobile applications, social media platforms, and digital marketplaces.
For 2025 and 2026, the commercial focus increasingly shifts from basic online availability to granular competitive intelligence. Businesses can therefore use assortment data to identify category opportunities, missing brands, disappearing products, and changes in competitive positioning.
How Can Businesses Compare Grocery Prices Across the Three Platforms?
Talabat vs Noon Food vs Lulu price comparison UAE can be built around standardized products, pack sizes, brands, categories, and timestamps. Grocery data scraping can then support recurring collection and comparison of these observations, subject to permitted access and platform terms.
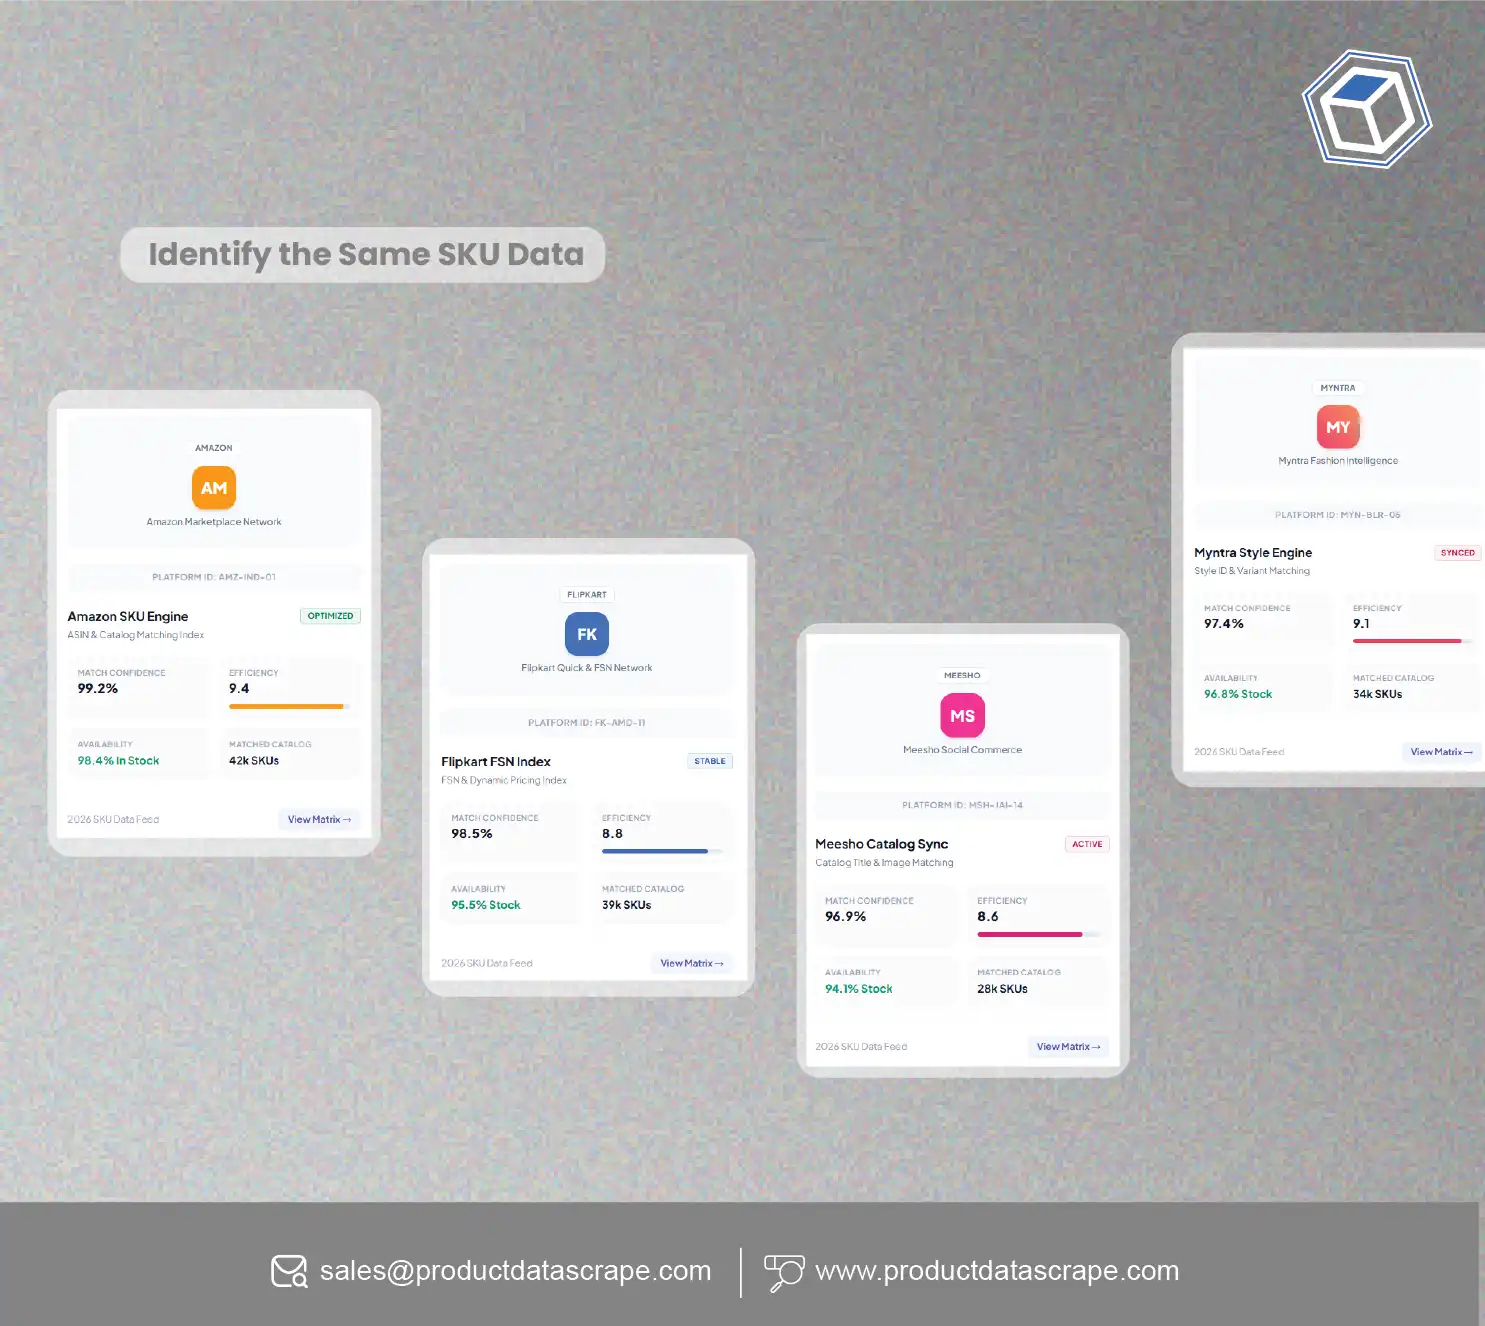
Price comparison is more meaningful when the same product is matched correctly. A 500g product should not be treated as identical to a 1kg product simply because the product names are similar. Unit pricing, promotional status, and pack-size normalization are therefore essential.
Illustrative price-comparison dataset
| Field |
Example |
| Platform |
Talabat / Noon Food / Lulu |
| Product |
Branded grocery item |
| Brand |
Manufacturer brand |
| Pack size |
500g |
| Regular price |
AED value |
| Promotional price |
AED value |
| Discount |
Percentage |
| Availability |
In stock / unavailable |
| Timestamp |
Collection date and time |
| Category |
Grocery category |
The historical context helps explain why continuous monitoring matters. The UAE's e-commerce sector experienced a significant acceleration in 2020, with $3.9 billion in e-commerce sales and 10% of total retail sales attributed to e-commerce that year.
In 2021, businesses had to distinguish temporary pandemic-driven shifts from lasting online-shopping behavior. By 2022, the UAE's national Digital Economy Strategy formalized a long-term objective of increasing digital-economy contribution to GDP.
During 2023–2024, online retail became increasingly integrated into the wider retail ecosystem. The U.S. International Trade Administration identifies Lulu Group and other major supermarket operators among UAE retail players with online shopping capabilities.
By 2025–2026, pricing teams can use recurring observations to identify price gaps, promotion frequency, and product-level changes.
A useful metric is the price gap percentage:
Price Gap % = ((Competitor Price − Reference Price) / Reference Price) × 100
This can be calculated at SKU, brand, category, or platform level.
How Can an API-Based Architecture Improve Market Monitoring?
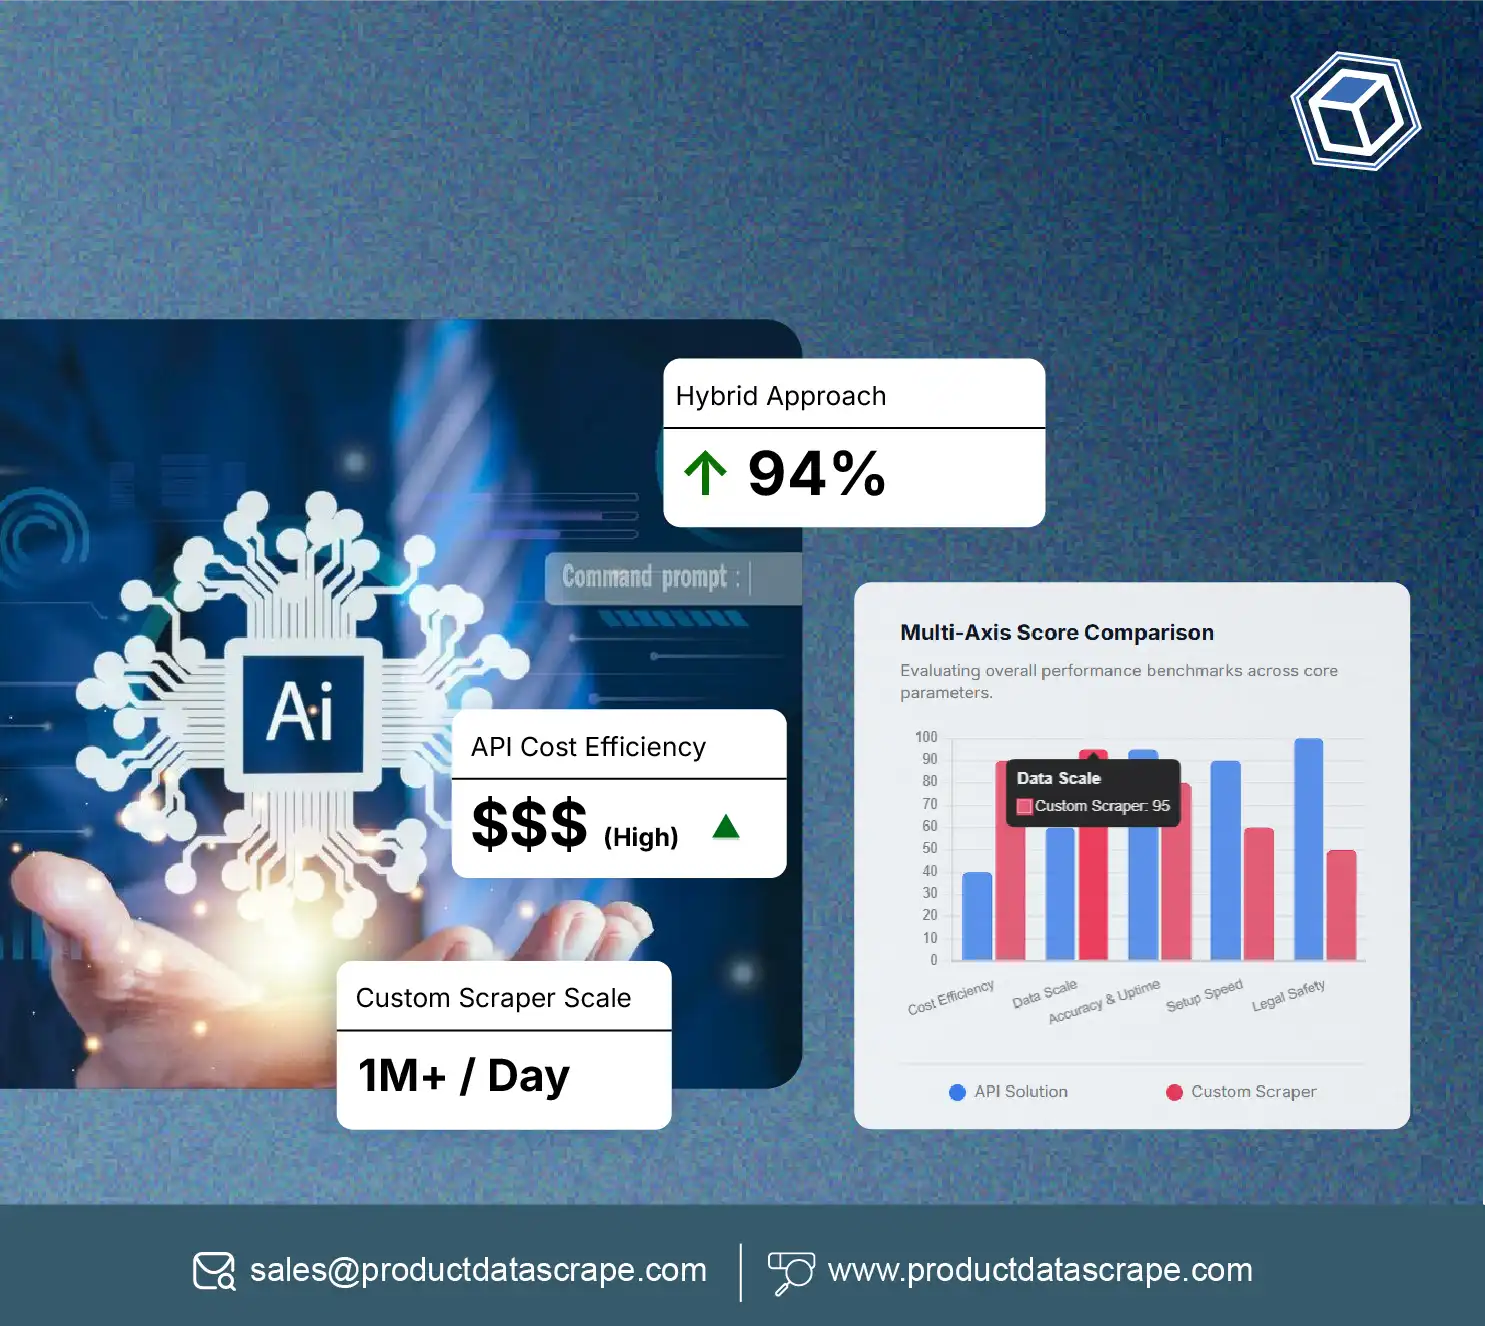
A UAE Q-commerce data intelligence API can act as the delivery layer between a structured collection system and a business's analytics environment.
Instead of manually downloading files, organizations can receive standardized records in a format suitable for dashboards, databases, pricing engines, or business-intelligence tools.
The architecture can contain four layers:
- Collection layer – gathers permitted product and pricing observations.
- Normalization layer – standardizes product names, units, prices, categories, and identifiers.
- Validation layer – detects missing, duplicate, or inconsistent records.
- Delivery layer – supplies structured data through API endpoints, files, databases, or dashboards.
Example data-delivery structure
| Layer |
Key Output |
| Collection |
Raw product observations |
| Processing |
Standardized records |
| Matching |
Comparable SKUs |
| Validation |
Quality-controlled dataset |
| API |
Machine-readable delivery |
| Analytics |
Dashboards and reports |
The importance of structured digital infrastructure has grown alongside UAE policy. The UAE Digital Economy Strategy, launched in April 2022, includes more than 30 initiatives and programs across six sectors and five growth areas.
The regulatory environment has also evolved. Federal Decree by Law No. 14 of 2023 covers technology-based trade, including online sales through websites, applications, social platforms, and digital marketplaces.
For 2024–2026, data workflows therefore need to address both scalability and governance. Businesses should define what information they require, how frequently it should be refreshed, how products should be matched, and what access methods are authorized.
An API-based delivery system is particularly useful when pricing teams need frequent updates rather than periodic spreadsheets.
How Can Businesses Track Product Pricing and Grocery Availability?
Businesses seeking to real-time Track Noon Food product pricing data can use a recurring monitoring architecture that records product-level observations with timestamps. Similarly, a LuluHypermarket Grocery Data Scraping API workflow can organize grocery products, prices, promotions, and availability into structured records where access is permitted.
The critical distinction is between a one-time snapshot and a historical time series.
A snapshot tells an analyst what a product costs today. A time series can show whether its price has changed, how often it was discounted, and whether competitor pricing moved simultaneously.
Example monitoring metrics
| Metric |
Frequency |
Use |
| Product price |
Daily/hourly where permitted |
Price movement |
| Discount |
Daily |
Promotion monitoring |
| Availability |
Recurring |
Stock visibility |
| Product title |
Recurring |
Listing changes |
| Pack size |
Recurring |
Product matching |
| Category |
Recurring |
Assortment analysis |
| Competitor gap |
Calculated |
Pricing decisions |
Between 2020 and 2022, rapid digital adoption created a strong reason to establish online price baselines. UAE e-commerce sales reached $3.9 billion in 2020, with e-commerce accounting for 10% of total retail sales.
In 2023–2024, the market increasingly required more granular competitive monitoring because online channels had become part of established retail strategies. The U.S. International Trade Administration notes that major UAE retailers, including Lulu Group, operate online shopping portals.
In 2025, the UAE's e-commerce market was forecast by the Dubai Chamber of Commerce and Industry to reach $8 billion, according to the U.S. International Trade Administration.
For 2026, recurring monitoring can help brands identify changes in promotional behavior, assortment, and product positioning rather than relying on isolated observations.
What Can Product-Level Data Reveal About UAE Grocery Competition?
Lulu grocery product data scraping UAE can provide structured observations for category, assortment, price, promotion, and availability analysis when collected through authorized means. The same analytical framework can be extended across multiple platforms to create a common comparison model.
The Talabat vs Noonfood vs Lulu API Report 2026 should therefore be viewed as a data-intelligence framework rather than simply a platform comparison. Its purpose is to understand how product information changes across channels.
A useful dataset might contain:
- Product name
- Brand
- SKU
- GTIN/barcode where available
- Category
- Subcategory
- Pack size
- Regular price
- Promotional price
- Discount
- Availability
- Retailer/platform
- Location
- Product URL
- Timestamp
2020–2026 market progression
| Year |
Development |
Data Requirement |
| 2020 |
$3.9B UAE e-commerce sales |
Digital product baseline |
| 2021 |
Continued online adoption |
Historical comparison |
| 2022 |
Digital Economy Strategy launched |
Scalable data infrastructure |
| 2023 |
Technology-based trade framework |
Structured digital commerce |
| 2024 |
Online retail integration continues |
Cross-platform monitoring |
| 2025 |
$8B e-commerce forecast |
Broader competitive intelligence |
| 2026 |
Mature digital-commerce environment |
Recurring product and price intelligence |
The 2020 figure is reported by the U.S. International Trade Administration, while the $8 billion 2025 figure is a forecast cited by that same source.
The regulatory environment also matters. UAE e-commerce rules require online traders to provide accurate product and service information, protect customer data, and issue digital invoices.
For data users, this reinforces the importance of building compliant workflows around publicly available or authorized information and avoiding unnecessary collection of personal customer data.
Why Choose Product Data Scrape?
Product Data Scrape can support businesses that need structured marketplace and grocery intelligence across multiple sources and geographic markets.
The core value lies in converting fragmented online product information into normalized datasets that can be used by pricing, category-management, market-research, procurement, and business-intelligence teams.
A structured workflow can capture product attributes, prices, promotions, availability, categories, identifiers, retailer information, and timestamps. These records can then be standardized, validated, matched, and delivered in an analytics-ready format.
Key capabilities
| Capability |
Business Value |
| Product data collection |
Builds structured market datasets |
| Price monitoring |
Identifies price movements |
| SKU matching |
Enables accurate comparisons |
| Promotion tracking |
Measures discount activity |
| Assortment monitoring |
Detects product additions/removals |
| Historical datasets |
Supports trend analysis |
| API-ready delivery |
Enables automated workflows |
| Quality validation |
Improves analytical reliability |
The approach can also be adapted to different collection frequencies. A pricing team may require frequent updates for high-volatility products, while a market-research team may require weekly or monthly historical observations.
How Should Businesses Approach Pricing Intelligence in 2026?
Talabat vs Noon Food pricing analysis 2026 should focus on comparable products rather than raw listing counts. Product matching, pack-size normalization, timestamps, promotions, and availability all affect the quality of a comparison.
Pricing intelligence becomes more useful when it answers specific commercial questions:
- Which platform has the lowest observed price for a comparable SKU?
- How frequently does a product receive promotions?
- Which categories show the largest price gaps?
- Which products have inconsistent availability?
- Which brands have broad cross-platform coverage?
- Which products are unique to individual platforms?
- How quickly do prices change after promotions?
A practical analytical model can calculate a platform price index using a common basket of products.
For example:
Platform Price Index = (Observed Basket Cost / Base Basket Cost) × 100
If a monitored basket costs AED 500 during the base period and AED 525 in a later observation, its index becomes 105.
The index should be interpreted within a defined product basket and methodology. It should not be presented as a general inflation measure unless the underlying sample and weighting methodology support that conclusion.
The 2020–2026 timeline also demonstrates why a consistent methodology is important. The UAE's e-commerce market experienced a major 2020 acceleration, followed by institutional investment in digital transformation and technology-based trade.
By 2026, businesses can benefit from combining historical observations with frequent current data to identify meaningful changes rather than isolated price movements.
What Should a 2026 UAE Q-Commerce Dataset Include?
A useful research dataset should balance breadth, frequency, product accuracy, and analytical consistency.
Recommended data fields
| Data Group |
Recommended Fields |
| Product |
Name, SKU, GTIN, brand |
| Category |
Category, subcategory |
| Pricing |
Regular price, sale price, discount |
| Unit economics |
Pack size, quantity, unit price |
| Availability |
In-stock/out-of-stock |
| Retailer |
Platform, merchant/store |
| Geography |
City, delivery area where available |
| Content |
Product URL, image URL where permitted |
| Time |
Collection timestamp |
| Analytics |
Price gap, price index, promotion status |
This structure allows businesses to build dashboards around assortment, pricing, promotions, and availability.
It also enables historical comparisons. A business can compare January 2026 with June 2026, or 2026 observations with historical datasets from 2024 and 2025, provided the methodology and product basket remain sufficiently consistent.
For AI-powered analytics, structured fields are especially valuable because they allow large datasets to be queried using consistent entities and attributes. Product identifiers, retailer names, categories, prices, and timestamps provide the foundation for machine-readable market intelligence.
What Are the Main Business Applications?
The resulting dataset can support several commercial functions.
Pricing teams
Monitor comparable products, calculate price gaps, identify competitor movements, and evaluate promotional positioning.
Category managers
Measure assortment depth, brand coverage, product availability, and category-level changes.
CPG brands
Track digital shelf visibility, product availability, competitor promotions, and price positioning.
Market researchers
Build historical datasets for UAE quick-commerce trends and platform comparisons.
E-commerce teams
Identify missing products, pricing inconsistencies, and assortment opportunities.
Procurement teams
Use product and price observations to understand market-level changes and supplier/category dynamics.
The value comes from combining these applications rather than treating product data as a single-purpose dataset.
Conclusion
The TalabatMart Grocery Data Scraping API concept illustrates how structured delivery can connect recurring grocery observations with pricing dashboards, market-research systems, and business intelligence workflows. The UAE's e-commerce market has evolved rapidly since 2020, when online sales reached $3.9 billion and represented 10% of total retail sales.
The Talabat vs Noonfood vs Lulu API Report 2026 framework can help businesses organize product, pricing, assortment, promotion, and availability information across major UAE digital-commerce channels. The strongest analytical results come from consistent product matching, timestamped observations, standardized units, and clearly defined comparison methodologies.
For 2026, the opportunity is to move beyond static marketplace snapshots toward continuously refreshed datasets that reveal how products and prices change over time.
Partner with Product Data Scrape to build a scalable UAE quick-commerce data pipeline and transform product, pricing, assortment, and competitive observations into structured intelligence for faster business decisions!


 Singapore
 EMAIL
 PHONE










.webp)